


vk.com/id446425943
Anglo American Platinum – HOLD
Renaissance Capital
6 February 2019
Metals & Mining
Figure 97: Anglo American Platinum, ZARmn (unless otherwise noted)
|
|
|
|
|
|
|
|
|
|
|
|
|
|
|
Anglo American Platinum |
|
AMSJ.J |
|
|
|
|
|
Target Price, ZAR: |
|
|
540 |
|||
Market capitalisation, ZARmn: |
|
172,308 |
|
|
|
|
|
Last Price, ZAR: |
|
|
636 |
|||
Enterprise value, ZARmn: |
|
173,615 |
|
|
|
|
|
Potential 12-month return: |
|
-13.2% |
||||
|
|
|
|
|
|
|
|
|
|
|
|
|
|
|
Dec-YE |
|
2016 |
2017 |
2018E |
2019E |
2020E |
Dec-YE |
2016 |
2017 |
|
2018E |
2019E |
2020E |
|
Income statement |
|
|
|
|
|
|
|
Balance sheet |
|
|
|
|
|
|
Revenue |
|
61,944 |
65,671 |
74,174 |
84,130 |
88,561 |
|
Net operating assets |
44,516 |
40,109 |
|
44,068 |
46,046 |
47,664 |
EBITDA |
|
9,168 |
12,367 |
16,537 |
20,045 |
21,856 |
|
Investments |
2,585 |
2,725 |
|
2,341 |
2,388 |
2,436 |
EBIT |
|
4,501 |
8,274 |
12,342 |
15,588 |
17,188 |
|
Equity |
40,016 |
41,527 |
|
46,964 |
54,531 |
62,945 |
Net interest |
|
-1,153 |
-951 |
-95 |
-201 |
82 |
|
Minority interest |
-234 |
-526 |
|
259 |
259 |
259 |
Taxation |
|
-364 |
-1,616 |
-3,108 |
-4,770 |
-5,354 |
|
Net debt |
7,319 |
1,833 |
|
-814 |
-6,356 |
-13,103 |
Equity accounted income |
|
-115 |
-362 |
48 |
0 |
0 |
|
|
|
|
|
|
|
|
Attributable profit |
|
552 |
1,945 |
7,035 |
10,549 |
11,824 |
|
Balance sheet ratios |
|
|
|
|
|
|
Headline earnings |
|
1,867 |
3,886 |
8,218 |
10,549 |
11,824 |
|
Gearing (net debt/(net debt+equity)) |
15.5% |
4.2% |
|
-1.8% |
-13.2% |
-26.3% |
HEPS, ZAc |
|
713 |
1,482 |
3,089 |
3,926 |
4,400 |
|
Net debt to EBITDA |
0.8x |
0.1x |
|
0.0x |
-0.3x |
-0.6x |
|
|
RoCE |
8.1% |
16.6% |
|
24.8% |
29.3% |
31.1% |
||||||
Thomson Reuters consensus HEPS, ZAc |
|
|
|
2,648 |
3,202 |
3,587 |
|
RoIC (after tax) |
4.0% |
11.9% |
|
18.9% |
20.8% |
21.9% |
DPS declared, ZAc |
|
0 |
349 |
916 |
1,178 |
1,320 |
|
RoE |
4.7% |
9.5% |
|
18.6% |
20.8% |
20.1% |
Breakdown of EBIT |
|
|
|
|
|
|
|
Cash flow statement |
|
|
|
|
|
|
Mogalakwena |
|
4,785 |
7,029 |
8,266 |
9,642 |
10,089 |
|
Operating cash flow |
11,030 |
9,486 |
|
13,238 |
15,988 |
17,064 |
EBIT margin |
|
34% |
44% |
42% |
46% |
46% |
|
Capex (net of disposals) |
-4,695 |
-4,744 |
|
-6,366 |
-6,427 |
-6,208 |
Amandelbult |
|
1,293 |
1,699 |
3,042 |
4,453 |
5,198 |
|
Other |
1,399 |
1,841 |
|
-3,257 |
-777 |
-617 |
EBIT margin |
|
12% |
15% |
23% |
30% |
33% |
|
FCF |
7,734 |
6,583 |
|
3,615 |
8,784 |
10,239 |
Unki |
|
22 |
369 |
537 |
521 |
654 |
|
Equity shareholders' cash |
5,450 |
5,486 |
|
4,580 |
8,525 |
10,157 |
EBIT margin |
|
1% |
15% |
17% |
19% |
22% |
|
Dividends and share buy backs |
0 |
0 |
|
-1,933 |
-2,983 |
-3,410 |
JV operations |
|
626 |
659 |
2,029 |
2,617 |
2,479 |
|
Movement in net debt |
5,450 |
5,486 |
|
2,647 |
5,542 |
6,747 |
EBIT margin |
|
10% |
11% |
23% |
26% |
24% |
|
Cash flow ratios |
|
|
|
|
|
|
Third party |
|
1,319 |
2,104 |
2,510 |
3,027 |
3,132 |
|
|
|
|
|
|
|
|
EBIT margin |
|
9% |
8% |
9% |
9% |
8% |
|
Working capital turnover, days |
49 |
52 |
|
50 |
47 |
47 |
Other |
|
-3,544 |
-3,586 |
-4,042 |
-4,672 |
-4,364 |
|
FCF yield |
7.8% |
7.3% |
|
3.4% |
5.3% |
6.5% |
EBIT |
|
4,501 |
8,274 |
12,342 |
15,588 |
17,188 |
|
Equity shareholders' yield |
5.9% |
6.2% |
|
4.3% |
5.0% |
6.0% |
Income statement ratios |
|
|
|
|
|
|
|
Capex/EBITDA |
44.9% |
36.0% |
|
37.6% |
30.4% |
27.2% |
|
|
|
|
|
|
|
Cash conversion |
2.9x |
1.4x |
|
0.6x |
0.8x |
0.9x |
|
EBITDA margin |
|
15% |
19% |
22% |
24% |
25% |
|
Valuation |
|
|
|
|
|
|
EBIT margin |
|
7% |
13% |
17% |
19% |
19% |
|
|
|
|
|
|
|
|
HEPS growth |
|
1626% |
108% |
108% |
27% |
12% |
|
SoTP DCF fair value and calculation of target price |
|
|
|
ZARmn |
ZAR/sh |
|
Dividend payout ratio |
|
0% |
47% |
35% |
30% |
30% |
|
Union mine |
|
|
|
|
25 |
0 |
Input assumptions |
|
|
|
|
|
|
|
Amandelbult operations |
|
|
|
|
33,123 |
124 |
|
|
|
|
|
|
|
Mogalakwena mine |
|
|
|
|
104,250 |
389 |
|
Platinum, $/oz |
|
988 |
950 |
880 |
870 |
1,070 |
|
Twickenham mine |
|
|
|
|
-431 |
-2 |
Palladium, $/oz |
|
614 |
871 |
1,030 |
1,216 |
1,088 |
|
Unki mine |
|
|
|
|
6,885 |
26 |
Rhodium, $/oz |
|
694 |
1,108 |
2,218 |
2,379 |
2,163 |
|
Modikwa |
|
|
|
|
4,160 |
16 |
USD/ZAR |
|
14.70 |
13.31 |
13.24 |
14.31 |
14.14 |
|
Mototolo |
|
|
|
|
3,728 |
14 |
Sales volumes, koz |
|
|
|
|
|
|
|
Kroondal |
|
|
|
|
2,651 |
10 |
|
|
|
|
|
|
|
Third party sales |
|
|
|
|
8,773 |
33 |
|
Mined platinum |
|
1,809 |
1,389 |
1,370 |
1,364 |
1,369 |
|
Other |
|
|
|
|
-17,785 |
-66 |
Third party platinum |
|
652 |
1,066 |
1,094 |
1,188 |
1,208 |
|
Enterprise value |
|
|
|
|
145,379 |
542 |
Total platinum sales |
|
2,416 |
2,505 |
2,429 |
2,552 |
2,577 |
|
Investments as at 31 December 2017 |
|
|
|
|
2,725 |
10 |
Volume growth |
|
-2.2% |
3.7% |
-3.0% |
5.1% |
1.0% |
|
Net debt as at 31 December 2017 |
|
|
|
|
-1,833 |
-9 |
3PGM breakeven price, $/oz |
|
|
|
|
|
|
|
Cash used in share buy-backs during 2018E |
|
|
|
0 |
0 |
|
|
|
|
|
|
|
|
Equity value |
|
|
|
|
146,271 |
544 |
|
Mogalakwena breakeven |
|
530 |
430 |
533 |
492 |
517 |
|
|
|
|
|
|
|
|
Rounded to |
|
|
|
|
|
540 |
||||||||
Amandelbult breakeven |
|
684 |
761 |
725 |
712 |
704 |
|
Current share price on 3/2/2019 |
|
|
|
|
|
636.0 |
Unki breakeven |
|
699 |
660 |
752 |
775 |
770 |
|
Expected share price return |
|
|
|
|
|
-15.1% |
JV operations breakeven |
|
702 |
788 |
744 |
770 |
837 |
|
Plus: expected dividend yield |
|
|
|
|
|
1.9% |
Group (mined production) breakeven |
|
754 |
744 |
742 |
744 |
756 |
|
Total implied one-year return |
|
|
|
|
|
-13.2% |
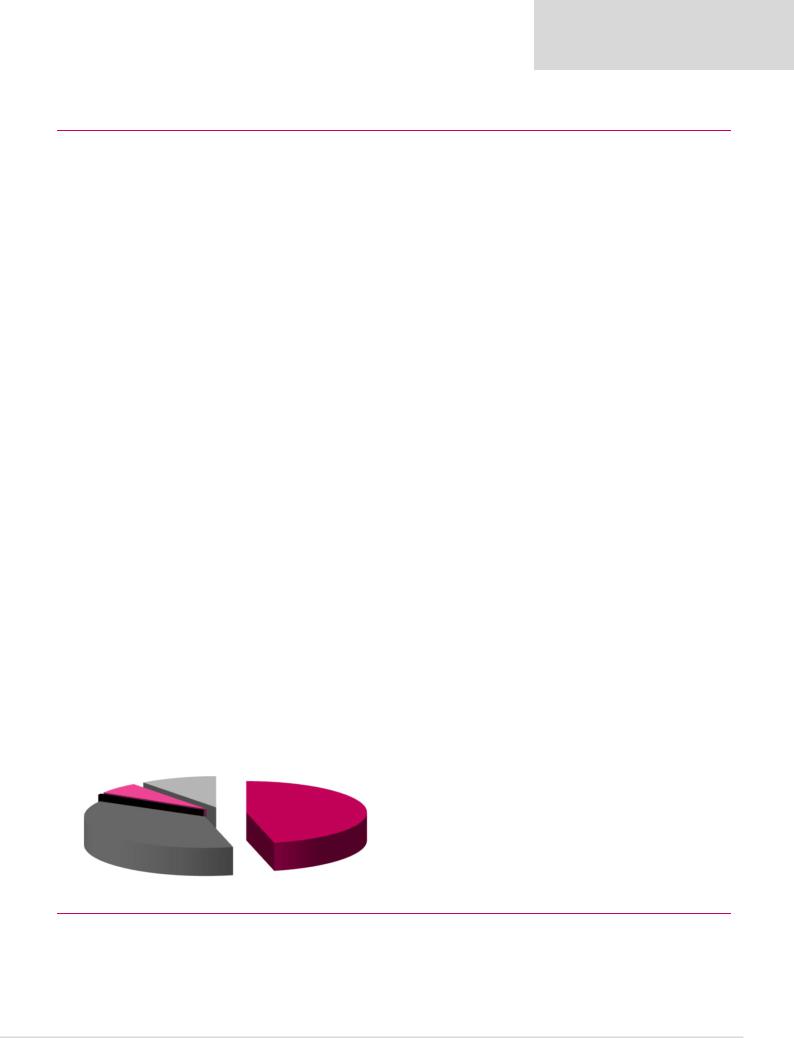
Contribution to FY18E underlying EBITDA |
|
|
|
|
|
|
Share price range, ZAR: |
|
|
|
|
|
|
|
|
|
|
|
|
|
|
|
12-month high |
650 |
12-month low |
|
299 |
||
Third party |
Union |
|
Amandelbult |
|
|
Price move since high |
-2.1% Price move since low |
|
112.9% |
|||||
15% |
|
|
18% |
|
|
|
|
|
|
|
|
|
|
|
|
0% |
|
|
|
|
Calculation of WACC |
|
|
|
|
|
|
||
Kroondal |
|
|
|
|
|
|
|
|
|
|
|
|||
6% |
|
|
|
|
|
|
|
WACC |
11.4% |
Cost of debt |
|
|
10.0% |
|
Mototolo |
|
|
|
|
|
|
Risk-free rate |
9.0% |
Tax rate |
|
|
28% |
||
5% |
|
|
|
|
|
|
|
Equity risk premium |
4.0% |
After-tax cost of debt |
|
7.2% |
||
Modikwa |
|
|
|
|
|
|
Beta |
1.30 |
Debt weighting |
|
40% |
|||
|
|
|
|
|
|
Cost of equity |
14.2% |
Terminal growth rate |
|
6.0% |
||||
3% |
|
|
Mogalakwena |
|
|
|
|
|||||||
|
|
|
|
|
|
|
|
|
|
|
|
|||
|
|
|
|
|
|
|
|
|
|
|
|
|
||
Unki |
|
|
49% |
|
|
|
Valuation ratios |
|
|
|
|
|
|
|
|
|
|
|
|
|
Dec-YE |
2016 |
2017 |
|
2018E |
2019E |
2020E |
||
4% |
|
|
|
|
|
|
|
|
||||||
|
|
|
|
|
|
|
P/E multiple |
48.5x |
22.4x |
|
12.8x |
16.2x |
14.5x |
|
|
|
|
|
|
|
|
|
|
||||||
|
|
|
|
|
|
|
|
Dividend yield |
0.0% |
1.1% |
|
2.3% |
1.9% |
2.1% |
|
|
|
|
|
|
|
|
EV/EBITDA |
9.5x |
6.8x |
|
6.2x |
7.8x |
6.9x |
|
|
|
|
|
|
|
|
P/B |
2.3x |
2.1x |
|
2.3x |
3.1x |
2.7x |
|
|
|
|
|
|
|
|
NAV per share, ZAR |
149 |
155 |
|
175 |
203 |
235 |
Source: Bloomberg, Thomson Reuters, Renaissance Capital estimates
64
vk.com/id446425943
Impala Platinum – BUY
Renaissance Capital
6 February 2019
Metals & Mining
Figure 98: Impala Platinum, ZARmn (unless otherwise noted)
Impala Platinum |
IMPJ.J |
Target Price, ZAR: |
45 |
Market capitalisation, ZARmn: |
31,729 |
Last Price, ZAR: |
39 |
Enterprise value, ZARmn: |
40,756 |
Potential 12-month return: |
16.1% |
Jun-YE |
2017 |
2018 |
2019E |
2020E |
2021E |
Income statement |
|
|
|
|
|
Revenue |
40,540 |
39,587 |
50,606 |
53,956 |
51,383 |
Underlying EBITDA |
3,622 |
5,884 |
8,743 |
9,933 |
11,658 |
Underlying EBIT |
-474 |
1,684 |
4,957 |
6,192 |
8,331 |
Net interest |
-400 |
-701 |
-614 |
-324 |
-37 |
Taxation |
2,461 |
2,042 |
-1,216 |
-1,643 |
-2,322 |
Minority interest in profit |
122 |
-114 |
-307 |
-352 |
-339 |
Attributable profit |
-7,976 |
-10,907 |
2,820 |
3,873 |
5,632 |
Headline earnings |
-983 |
-1,228 |
2,820 |
3,873 |
5,632 |
HEPS, ZAc |
-137 |
-171 |
392 |
539 |
784 |
Thomson Reuters consensus HEPS, ZAc |
|
|
209 |
290 |
396 |
DPS declared, ZAc |
0 |
0 |
0 |
0 |
0 |
Underlying EBIT |
-1,760 |
-1,083 |
1,576 |
2,126 |
4,245 |
Rustenburg lease |
|||||
EBIT margin |
-6% |
-4% |
5% |
6% |
13% |
Zimplats |
1,169 |
1,911 |
2,069 |
2,613 |
2,775 |
EBIT margin |
17% |
26% |
25% |
28% |
29% |
Marula |
-627 |
-6 |
220 |
172 |
-5 |
EBIT margin |
-39% |
0% |
8% |
6% |
0% |
Mimosa |
2 |
320 |
235 |
346 |
386 |
EBIT margin |
0% |
16% |
11% |
15% |
16% |
Two Rivers |
460 |
419 |
684 |
753 |
735 |
EBIT margin |
24% |
23% |
32% |
32% |
31% |
Other |
282 |
123 |
173 |
182 |
196 |
EBIT |
-474 |
1,684 |
4,957 |
6,192 |
8,331 |
Income statement ratios |
|
|
|
|
|
EBITDA margin |
9% |
15% |
17% |
18% |
23% |
EBIT margin |
-1% |
4% |
10% |
11% |
16% |
HEPS growth |
-1242% |
-25% |
329% |
37% |
45% |
Dividend payout ratio |
0% |
0% |
0% |
0% |
0% |
Input assumptions |
|
|
|
|
|
Platinum, $/oz |
988 |
940 |
820 |
970 |
1,134 |
Palladium, $/oz |
738 |
977 |
1,151 |
1,152 |
1,050 |
Rhodium, $/oz |
821 |
1,634 |
2,440 |
2,271 |
2,098 |
USD/ZAR |
13.60 |
12.85 |
14.25 |
14.25 |
14.09 |
Production volumes, koz |
|
|
|
|
|
Mined platinum |
1,121 |
1,048 |
1,159 |
1,144 |
1,004 |
Third party platinum |
244 |
241 |
180 |
180 |
180 |
Joint venture platinum |
165 |
180 |
145 |
149 |
149 |
Gross refined platinum |
1,530 |
1,468 |
1,484 |
1,473 |
1,333 |
Volume growth |
6.4% |
-4.0% |
1.1% |
-0.7% |
-9.5% |
3PGM breakeven price, $/oz |
|
|
|
|
|
Rustenburg lease breakeven |
1,071 |
1,183 |
1,066 |
1,123 |
982 |
Zimplats breakeven |
653 |
783 |
765 |
781 |
807 |
Marula breakeven |
1,201 |
970 |
962 |
1,053 |
1,158 |
Mimosa breakeven |
888 |
896 |
934 |
956 |
978 |
Two Rivers breakeven |
677 |
797 |
717 |
758 |
807 |
Group (mined production) breakeven |
895 |
959 |
902 |
941 |
876 |
Contribution to FY19E proportionately consolidated underlying EBITDA |
|
|
|||
Two Rivers |
|
|
|
|
|
10% |
|
|
|
Rustenburg Lease |
|
Mimosa |
|
|
|
||
6% |
|
|
|
46% |
|
IRS 1%
Zimplats
37%
Jun-YE |
|
|
|
|
2019E |
2020E |
2021E |
|
2017 |
2018 |
|
||||
Balance sheet |
|
|
|
|
|
|
|
Net operating assets |
|
51,832 |
45,914 |
|
44,722 |
45,490 |
46,964 |
Investments |
|
-929 |
326 |
|
333 |
339 |
346 |
Equity |
|
46,807 |
37,213 |
|
40,033 |
43,906 |
49,538 |
Minority interest |
|
2,425 |
2,380 |
|
2,380 |
2,380 |
2,380 |
Net debt (including finance leases) |
|
1,671 |
6,647 |
|
2,642 |
-457 |
-4,608 |
Balance sheet ratios |
|
|
|
|
|
|
|
Gearing (net debt/(net debt+equity)) |
|
3.4% |
15.2% |
|
6.2% |
-1.1% |
-10.3% |
Net debt to EBITDA |
|
0.5x |
1.1x |
|
0.3x |
0.0x |
-0.4x |
RoCE |
|
-0.8% |
3.2% |
|
10.5% |
13.1% |
17.3% |
RoIC (after tax) |
|
-8.5% |
-5.9% |
|
7.6% |
9.5% |
12.5% |
RoE |
|
-1.9% |
-2.9% |
|
7.3% |
9.2% |
12.1% |
Cash flow statement |
|
|
|
|
|
|
|
Operating cash flow |
|
-1,247 |
-1,256 |
|
9,436 |
7,810 |
8,031 |
Capex (net of disposals) |
|
-3,798 |
-5,106 |
|
-4,675 |
-4,119 |
-3,506 |
Other |
|
3,856 |
3,305 |
|
0 |
0 |
0 |
FCF |
|
-1,189 |
-3,057 |
|
4,761 |
3,690 |
4,525 |
Equity shareholders' cash |
|
846 |
-4,976 |
|
4,005 |
3,099 |
4,152 |
Dividends and share buy backs |
|
0 |
0 |
|
0 |
0 |
0 |
Movement in net debt |
|
846 |
-4,976 |
|
4,005 |
3,099 |
4,152 |
Cash flow ratios |
|
|
|
|
|
|
|
Working capital turnover, days |
|
58 |
81 |
|
49 |
48 |
60 |
FCF yield |
|
-2.9% |
-9.8% |
|
14.5% |
12.4% |
17.7% |
Equity shareholders' yield |
|
2.3% |
-22.3% |
|
14.4% |
11.1% |
14.9% |
Capex/EBITDA |
|
104.9% |
86.8% |
|
53.5% |
41.5% |
30.1% |
Cash conversion |
|
-0.9x |
4.1x |
|
1.4x |
0.8x |
0.7x |
Valuation |
|
|
|
|
|
|
|
SoTP DCF fair value and calculation of target price |
|
|
|
ZARmn |
ZAR/sh |
||
Rustenburg lease |
|
|
|
|
19,948 |
27.8 |
|
Zimplats (effective interest = 87%) |
|
|
|
|
14,936 |
20.8 |
|
Marula (effective interest = 73%) |
|
|
|
|
-282 |
-0.4 |
|
Afplats (effective interest = 74%) |
|
|
|
|
0 |
0.0 |
|
IRS (third party only) |
|
|
|
|
207 |
0.3 |
|
Mimosa (effective interest = 50%) |
|
|
|
|
1,717 |
2.4 |
|
Two Rivers (effective interest = 46%) |
|
|
|
|
4,848 |
6.7 |
|
Chrome operations |
|
|
|
|
408 |
0.6 |
|
Enterprise value |
|
|
|
|
41,780 |
58.1 |
|
Investments as at 30 June 2018 |
|
|
|
|
326 |
0.5 |
|
Net debt as at 30 June 2018 |
|
|
|
|
-6,647 |
-9.4 |
|
Cash used in share buy-backs during 2019E |
|
|
|
|
0 |
0.0 |
|
Convertible debt conversion cost at ZAR50/share |
|
|
|
-1,585 |
-2.4 |
||
Anticipated indigenization discount of Zimplats and Mimosa |
|
-849 |
-1.4 |
||||
Equity value |
|
|
|
|
33,025 |
45.4 |
|
Rounded to |
|
|
|
|
|
45.0 |
|
Current share price on 1/2/2019 |
|
|
|
|
|
38.8 |
|
Expected share price return |
|
|
|
|
|
16.1% |
|
Plus: expected dividend yield |
|
|
|
|
|
0.0% |
|
Total implied one-year return |
|
|
|
|
|
16.1% |
|
Share price range, ZAR: |
|
|
|
|
|
|
|
12-month high |
40 |
12-month low |
|
16 |
|||
Price move since high |
-2.5% |
Price move since low |
|
148.2% |
|||
Calculation of WACC |
|
|
|
|
|
|
|
WACC |
15.4% |
Cost of debt |
|
|
10.0% |
||
Risk-free rate |
9.0% |
Tax rate |
|
|
28% |
||
Equity risk premium |
6.0% |
After-tax cost of debt |
|
7.2% |
|||
Beta |
1.30 |
Debt weighting |
|
15% |
|||
Cost of equity |
16.8% |
Terminal growth rate |
|
0.0% |
|||
Valuation ratios |
|
|
|
|
|
|
|
Jun-YE |
|
2017 |
2018 |
|
2019E |
2020E |
2021E |
P/E multiple |
|
-36.6x |
-18.2x |
|
9.9x |
7.2x |
4.9x |
Dividend yield |
|
0.0% |
0.0% |
|
0.0% |
0.0% |
0.0% |
EV/EBITDA |
|
11.3x |
5.3x |
|
3.8x |
3.0x |
2.2x |
P/B |
|
0.8x |
0.6x |
|
0.7x |
0.6x |
0.6x |
NAV per share, ZAR |
|
64 |
52 |
|
56 |
61 |
69 |
Source: Bloomberg, Thomson Reuters, Renaissance Capital estimates
65