

vk.com/id446425943
Polymetal – HOLD
Renaissance Capital
6 February 2019
Metals & Mining
Figure 94: Polymetal, $mn (unless otherwise noted)
|
|
|
|
|
|
|
|
|
|
|
|
|
|
|
|
|
|
||
Polymetal |
|
|
|
|
|
POLYP.L |
|
|
|
|
|
Target price, GBP: |
|
|
8.60 |
||||
Market capitalisation, $mn: |
|
|
|
5,287 |
|
|
|
|
|
|
Share price, GBP: |
|
|
8.61 |
|||||
Enterprise value, $mn: |
|
|
|
6,707 |
|
|
|
|
|
|
Potential 12-month return: |
|
6.5% |
||||||
|
|
|
|
|
|
|
|
|
|
|
|
|
|
|
|
|
|
||
Dec-YE |
|
|
|
|
2016 |
2017 |
|
2018E |
2019E |
2020E |
Dec-YE |
2016 |
2017 |
|
2018E |
2019E |
2020E |
||
Income statement |
|
|
|
|
|
|
|
|
|
|
Balance sheet |
|
|
|
|
|
|
||
Revenue |
|
|
|
|
1,583 |
1,815 |
|
1,920 |
2,148 |
2,181 |
|
Net operating assets |
2,424 |
2,828 |
|
3,080 |
3,217 |
3,448 |
|
EBITDA |
|
|
|
|
759 |
745 |
|
808 |
1,094 |
1,105 |
|
Investments, net of rehab provision |
-113 |
-101 |
|
-99 |
-99 |
-99 |
|
EBIT |
|
|
|
|
|
604 |
531 |
|
624 |
920 |
925 |
|
Equity |
981 |
1,307 |
|
1,563 |
1,965 |
2,280 |
Net interest |
|
|
|
-17 |
-67 |
|
-60 |
-59 |
-51 |
|
Minority interest |
0 |
0 |
|
0 |
0 |
0 |
||
Taxation |
|
|
|
|
-169 |
-89 |
|
-107 |
-172 |
-175 |
|
Net debt |
1,330 |
1,420 |
|
1,418 |
1,153 |
1,070 |
|
Minority interest in profit |
|
|
0 |
0 |
|
0 |
0 |
0 |
|
|
|
|
|
|
|
|
|||
Net profit for the year |
|
|
395 |
354 |
|
464 |
688 |
699 |
|
Balance sheet ratios |
|
|
|
|
|
|
|||
Underlying earnings |
|
|
382 |
376 |
|
444 |
688 |
699 |
|
Gearing (net debt/(net debt+equity)) |
57.6% |
52.1% |
|
47.6% |
37.0% |
31.9% |
|||
Underlying EPS, USc |
|
|
90 |
88 |
|
98 |
147 |
149 |
|
Net debt to EBITDA |
1.8x |
1.9x |
|
1.8x |
1.1x |
1.0x |
|||
|
|
|
|
RoCE |
28.1% |
20.0% |
|
20.9% |
28.7% |
27.3% |
|||||||||
Consensus EPS, USc |
|
|
|
|
|
88 |
108 |
121 |
|
RoIC (after tax) |
21.2% |
15.9% |
|
18.1% |
23.0% |
22.0% |
|||
DPS declared, USc |
|
|
42 |
44 |
|
49 |
74 |
75 |
|
RoE |
52.1% |
32.9% |
|
30.9% |
39.0% |
33.0% |
|||
Consensus DPS, USc |
|
|
|
|
|
43 |
52 |
61 |
|
Cash flow statement |
|
|
|
|
|
|
|||
|
|
|
|
|
|
|
|
|
|
|
|
|
|
|
|
|
|
|
|
Adjusted EBIT |
|
|
|
|
|
|
|
|
|
|
Operating cash flow |
490 |
574 |
|
711 |
919 |
929 |
||
Voro |
|
|
|
|
|
113 |
99 |
|
87 |
71 |
70 |
|
Capex (net of disposals) |
-288 |
-432 |
|
-365 |
-380 |
-420 |
EBIT margin |
|
|
|
72% |
63% |
|
65% |
66% |
65% |
|
Other cash flows |
-116 |
-29 |
|
-87 |
60 |
0 |
||
Okhotsk operations |
|
|
|
89 |
159 |
|
181 |
134 |
130 |
|
Free cash flow |
86 |
114 |
|
259 |
599 |
509 |
||
EBIT margin |
|
|
|
50% |
57% |
|
63% |
65% |
64% |
|
Equity shareholders' cash |
126 |
48 |
|
208 |
552 |
468 |
||
Dukat |
|
|
|
|
|
283 |
179 |
|
144 |
181 |
199 |
|
Dividends and share buy-backs |
-158 |
-138 |
|
-206 |
-286 |
-385 |
EBIT margin |
|
|
|
57% |
44% |
|
40% |
47% |
49% |
|
Surplus (deficit) cash |
-32 |
-90 |
|
2 |
265 |
83 |
||
Omolon |
|
|
|
|
116 |
121 |
|
104 |
134 |
132 |
|
Cash flow ratios |
|
|
|
|
|
|
|
EBIT margin |
|
|
|
56% |
45% |
|
45% |
51% |
51% |
|
|
|
|
|
|
|
|||
Varvara |
|
|
|
|
36 |
67 |
|
79 |
103 |
94 |
|
Working capital turnover, days |
115 |
109 |
|
106 |
94 |
92 |
|
EBIT margin |
|
|
|
36% |
44% |
|
43% |
49% |
45% |
|
FCF yield |
1.4% |
1.7% |
|
4.4% |
9.3% |
8.0% |
||
Amursk-Albazino |
|
|
|
167 |
157 |
|
192 |
196 |
188 |
|
Equity shareholders' yield |
2.6% |
0.9% |
|
4.6% |
10.4% |
8.9% |
||
EBIT margin |
|
|
|
57% |
45% |
|
47% |
52% |
51% |
|
Capex/EBITDA |
37.9% |
58.0% |
|
45.2% |
34.7% |
38.0% |
||
Other |
|
|
|
|
|
-200 |
-251 |
|
-162 |
101 |
113 |
|
Cash conversion |
0.3x |
0.1x |
|
0.5x |
0.8x |
0.7x |
Adjusted EBIT |
|
|
|
604 |
531 |
|
624 |
920 |
925 |
|
Valuation |
|
|
|
|
|
|
||
|
|
|
|
|
|
|
|
|
|
|
|
|
|
|
|
|
$mn |
|
|
Income statement ratios |
|
|
|
|
|
|
|
|
|
SoTP DCF fair value and calculation of target price |
|
|
|
GBP/sh |
|||||
EBITDA margin |
|
|
|
72% |
63% |
|
65% |
66% |
65% |
|
Voro |
|
|
|
|
335 |
0.55 |
||
EBIT margin |
|
|
|
38% |
29% |
|
33% |
43% |
42% |
|
Okhotsk operations |
|
|
|
|
619 |
1.03 |
||
Underlying EPS Growth |
|
|
28% |
-2% |
|
11% |
50% |
1% |
|
Dukat |
|
|
|
|
1,005 |
1.66 |
|||
Dividend payout ratio |
|
|
47% |
50% |
|
50% |
50% |
50% |
|
Omolon |
|
|
|
|
635 |
1.05 |
|||
Input assumptions |
|
|
|
|
|
|
|
|
|
|
Varvara |
|
|
|
|
905 |
1.50 |
||
|
|
|
|
|
|
|
|
|
|
Amursk-Albazino |
|
|
|
|
707 |
1.17 |
|||
Gold, $/oz |
|
|
|
|
1,248 |
1,258 |
|
1,269 |
1,350 |
1,338 |
|
Armenia |
|
|
|
|
-4 |
-0.01 |
|
Silver, $/oz |
|
|
|
17.1 |
17.1 |
|
15.7 |
16.7 |
17.8 |
|
Mayskoye |
|
|
|
|
237 |
0.39 |
||
$/RUB |
|
|
|
|
|
67.0 |
58.3 |
|
62.8 |
67.0 |
68.0 |
|
Kyzyl |
|
|
|
|
2,123 |
3.52 |
$/KZT |
|
|
|
|
|
342 |
326 |
|
345 |
363 |
353 |
|
Nezhda |
|
|
|
|
833 |
1.38 |
Gold breakeven price, $/oz |
|
|
748 |
861 |
|
851 |
780 |
762 |
|
Corporate and other |
|
|
|
|
-780 |
-1.29 |
|||
Gold equivalent production volumes, koz |
|
|
|
|
|
|
|
Operating value |
|
|
|
|
6,614 |
10.95 |
|||||
|
|
|
|
|
|
|
Financial instruments and rehab provision as at 31 December 2017 |
|
-101 |
-0.17 |
|||||||||
Voro |
lumes |
|
|
|
129 |
120 |
|
107 |
80 |
80 |
|
Enterprise value |
|
|
|
|
6,513 |
10.78 |
|
Okhotsk operations |
lumes |
|
|
131 |
186 |
|
237 |
152 |
152 |
|
Net debt as at 31 December 2017 |
|
|
|
|
-1,420 |
-2.45 |
||
Dukat |
lumes |
|
|
|
369 |
322 |
|
307 |
304 |
304 |
|
Minority interest |
|
|
|
|
0 |
0.00 |
|
Omolon |
lumes |
|
|
|
170 |
202 |
|
194 |
195 |
195 |
|
Prognoz valued at 70% of acquisition price |
|
|
|
|
151 |
0.25 |
|
Varvara |
lumes |
|
|
|
85 |
130 |
|
142 |
157 |
157 |
|
Cash raised in rights issue during 2018E |
|
|
|
|
0 |
0.00 |
|
Amursk-Albazino |
lumes |
|
|
244 |
268 |
|
308 |
278 |
278 |
|
Equity value |
|
|
|
|
5,244 |
8.58 |
||
Armenia lumes |
|
|
|
26 |
50 |
|
51 |
8 |
0 |
|
|
|
|
|
|
|
|
||
|
|
Rounded to |
|
|
|
|
|
8.60 |
|||||||||||
Mayskoye |
lumes |
|
|
|
116 |
124 |
|
117 |
135 |
135 |
|
Share price on 1/2/2019 |
|
|
|
|
|
8.61 |
|
Kyzyl lumes |
|
|
|
0 |
0 |
|
96 |
300 |
330 |
|
Expected share price return |
|
|
|
|
|
-0.1% |
||
Total volumes |
|
|
|
1,268 |
1,401 |
|
1,560 |
1,610 |
1,631 |
|
Plus: expected dividend yield |
|
|
|
|
|
6.6% |
||
Volume growth |
|
|
|
0% |
11% |
|
11% |
3% |
1% |
|
Total implied one-year return |
|
|
|
|
|
6.5% |
||
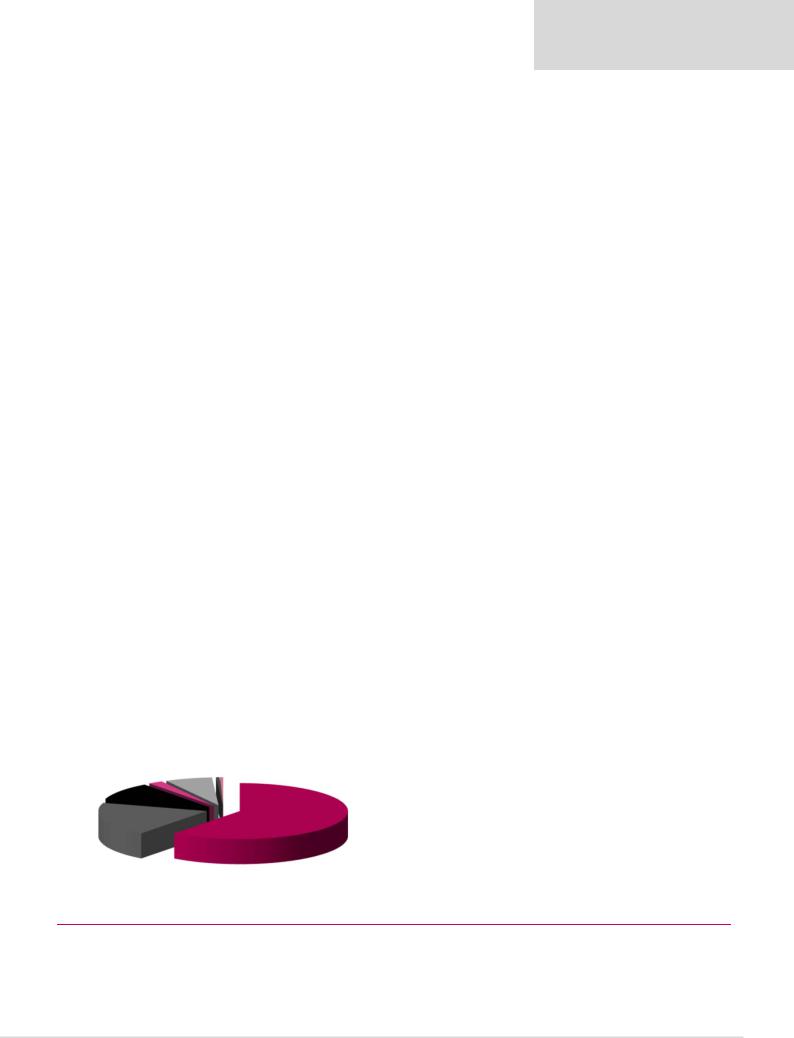
Contribution to FY18E adjusted EBITDA |
|
|
|
|
|
|
|
Share price range, GBP: |
|
|
|
|
|
|
|||||
|
|
|
|
|
|
|
|
|
|
|
|
|
|||||||
|
|
|
|
|
|
|
|
|
|
|
|
|
12-month high on 4-1-2019 |
8.77 12-month low on 10-4-2018 |
5.78 |
||||
|
|
|
|
|
|
|
Voro |
|
|
|
|
Price move since high |
-1.9% |
Price move since low |
|
49.0% |
|||
|
|
|
Mayskoye |
|
Kyzyl |
|
|
|
|
|
|
|
|
|
|
|
|||
|
|
Armenia |
5% |
4% |
10% |
|
|
|
|
Calculation of WACC |
|
|
|
|
|
|
|||
|
|
2% |
|
|
|
|
|
|
|
|
|
WACC |
8.2% |
Cost of debt |
|
|
5.0% |
||
Amursk-Albazino |
|
|
|
|
|
|
|
|
Okhotsk |
Risk-free rate |
4.0% |
Tax rate |
|
|
20% |
||||
22% |
|
|
|
|
|
|
|
|
|
Equity risk premium |
6.0% After-tax cost of debt |
|
1.2% |
||||||
|
|
|
|
|
|
|
|
|
|
|
20% |
|
Beta |
1.00 |
Debt weighting |
|
30% |
||
|
|
|
|
|
|
|
|
|
|
|
|
|
Cost of equity |
10.0% |
Terminal growth rate |
|
2.0% |
||
|
|
|
|
|
|
|
|
|
|
|
|
|
Valuation ratios |
|
|
|
|
|
|
|
|
|
|
|
|
|
|
|
|
|
|
|
Dec-YE, $mn |
2016 |
2017 |
|
2018E |
2019E |
2020E |
|
|
Varvara |
|
|
|
|
|
|
|
Dukat |
|
|
P/E multiple |
12.5x |
13.6x |
|
9.8x |
7.7x |
7.6x |
|
|
|
|
|
|
|
|
|
|
|
Dividend yield |
3.7% |
3.7% |
|
5.1% |
6.6% |
6.7% |
||
|
|
9% |
|
|
Omolon |
|
|
|
16% |
|
|
|
|||||||
|
|
|
|
|
12% |
|
|
|
|
|
|
EV/EBITDA |
8.1x |
8.8x |
|
7.4x |
5.9x |
5.8x |
|
|
|
|
|
|
|
|
|
|
|
|
|
|
P/B |
4.9x |
3.9x |
|
2.9x |
2.7x |
2.3x |
|
|
|
|
|
|
|
|
|
|
|
|
|
NAV per share, $ |
2.3 |
3.0 |
|
3.3 |
4.2 |
4.9 |
Source: Bloomberg, Thomson Reuters, Renaissance Capital estimates
61
vk.com/id446425943
PJSC Polyus – BUY
Renaissance Capital
6 February 2019
Metals & Mining
Figure 95: Polyus Gold, $mn (unless otherwise noted) |
|
|
|
|
|
|
|
|
|
|
||||
PJSC Polyus (MOEX) |
|
PLZL.MM |
|
|
|
|
|
Target price, RUB: |
|
|
6,300 |
|||
Market capitalisation, $mn: |
|
11,287 |
|
|
|
|
|
Share price, RUB: |
|
|
5,522 |
|||
Enterprise value, $mn: |
|
14,456 |
|
|
|
|
|
Potential 12-month return: |
|
20.1% |
||||
|
|
|
|
|
|
|
|
|
|
|
|
|
|
|
Dec-YE |
|
|
2016 |
2017 |
2018E |
2019E |
2020E |
Dec-YE |
2016 |
2017 |
2018E |
2019E |
2020E |
|
Income statement |
|
|
|
|
|
|
Balance sheet |
|
|
|
|
|
||
Revenue |
|
|
2,458 |
2,721 |
2,867 |
3,748 |
3,706 |
|
Net operating assets |
3,254 |
4,406 |
4,547 |
4,843 |
5,085 |
Adjusted EBITDA |
1,536 |
1,702 |
1,855 |
2,513 |
2,457 |
|
Investments, net of rehab provision |
-427 |
-673 |
-767 |
-767 |
-767 |
||
Adjusted EBIT |
1,363 |
1,485 |
1,527 |
2,188 |
2,123 |
|
Equity |
-508 |
564 |
420 |
1,349 |
2,144 |
||
Net interest |
|
410 |
76 |
-676 |
-194 |
-177 |
|
Minority interest |
94 |
92 |
86 |
86 |
86 |
|
Taxation |
|
|
-326 |
-290 |
-105 |
-399 |
-389 |
|
Net debt |
3,241 |
3,077 |
3,275 |
2,641 |
2,088 |
Minority interest in profit |
-25 |
-1 |
-10 |
0 |
0 |
|
|
|
|
|
|
|
||
Net profit for the year |
1,420 |
1,240 |
773 |
1,593 |
1,557 |
|
Balance sheet ratios |
|
|
|
|
|
||
Adjusted earnings |
952 |
1,015 |
1,314 |
1,596 |
1,557 |
|
Gearing (net debt/(net debt+equity)) |
118.6% |
84.5% |
88.6% |
66.2% |
49.3% |
||
Adjusted EPS, USc |
676 |
789 |
994 |
1,206 |
1,176 |
|
Net debt to EBITDA |
2.1x |
1.8x |
1.8x |
1.1x |
0.9x |
||
|
RoCE |
47.1% |
37.5% |
33.2% |
45.8% |
42.0% |
||||||||
Consensus EPS, USc |
|
|
964 |
1,040 |
1,120 |
|
RoIC (after tax) |
40.6% |
31.0% |
25.1% |
36.7% |
33.7% |
||
DPS declared, USc |
0 |
405 |
425 |
501 |
576 |
|
RoE |
129.7% |
3625.0% |
267.3% |
180.4% |
89.1% |
||
Consensus DPS, USc |
|
|
428 |
502 |
553 |
|
Cash flow statement |
|
|
|
|
|
||
|
|
|
|
|
|
|
|
|
|
|
|
|
|
|
Adjusted EBITDA |
|
|
|
|
|
|
Operating cash flow |
1,386 |
1,483 |
1,447 |
2,050 |
2,020 |
||
Olimpiada |
|
|
753 |
953 |
1,119 |
1,275 |
1,286 |
|
Capex (net of disposals) |
-466 |
-804 |
-815 |
-595 |
-565 |
EBITDA margin |
63% |
66% |
71% |
73% |
72% |
|
Other cash flows |
-1,036 |
-245 |
192 |
-3 |
0 |
||
Blagodatnoye |
|
417 |
414 |
361 |
440 |
459 |
|
Free cash flow |
-116 |
434 |
825 |
1,452 |
1,456 |
|
EBITDA margin |
72% |
71% |
67% |
71% |
69% |
|
Equity shareholders' cash |
714 |
738 |
377 |
1,297 |
1,315 |
||
Verninskoye |
|
146 |
149 |
187 |
184 |
179 |
|
Dividends and share buy-backs |
-3,591 |
-574 |
-575 |
-663 |
-762 |
|
EBITDA margin |
62% |
57% |
63% |
65% |
64% |
|
Surplus (deficit) cash |
-2,877 |
164 |
-198 |
634 |
552 |
||
Alluvials |
|
|
90 |
54 |
40 |
55 |
49 |
|
Cash flow ratios |
|
|
|
|
|
EBITDA margin |
40% |
28% |
24% |
31% |
29% |
|
|
|
|
|
|
|||
Kuranakh |
|
|
107 |
109 |
130 |
139 |
134 |
|
Working capital turnover, days |
23 |
20 |
31 |
26 |
28 |
EBITDA margin |
53% |
50% |
52% |
56% |
54% |
|
FCF yield |
-1.0% |
3.3% |
5.7% |
10.4% |
10.9% |
||
Natalka |
|
|
0 |
0 |
9 |
419 |
351 |
|
Equity shareholders' yield |
8.7% |
7.3% |
3.4% |
11.6% |
11.8% |
EBITDA margin |
- |
- |
32% |
62% |
61% |
|
Capex/EBITDA |
30.3% |
47.2% |
43.9% |
23.7% |
23.0% |
||
Other |
|
|
-150 |
-194 |
-319 |
-325 |
-334 |
|
Cash conversion |
0.8x |
0.7x |
0.3x |
0.8x |
0.8x |
Adjusted EBITDA |
1,363 |
1,485 |
1,527 |
2,188 |
2,123 |
|
Valuation |
|
|
|
LSE |
MOEX |
||
|
|
|
|
|
|
|
|
|
|
|
|
|||
Income statement ratios |
|
|
|
|
|
|
SoTP DCF fair value and calculation of target price |
|
$mn |
$/share |
RUB/sh |
|||
EBITDA margin |
62% |
63% |
65% |
67% |
66% |
|
Olimpiada |
|
|
9,380 |
35.4 |
4,749 |
||
EBIT margin |
|
55% |
55% |
53% |
58% |
57% |
|
Blagodatnoye |
|
|
3,159 |
11.9 |
1,599 |
|
Adjusted EPS Growth |
38% |
17% |
26% |
21% |
-2% |
|
Verninskoye |
|
|
1,308 |
4.9 |
662 |
||
Dividend payout ratio |
0% |
51% |
43% |
42% |
49% |
|
Alluvials |
|
|
112 |
0.4 |
57 |
||
Input assumptions |
|
|
|
|
|
|
Kuranakh |
|
|
882 |
3.3 |
446 |
||
|
|
|
|
|
|
Natalka |
|
|
3,007 |
11.4 |
1,522 |
|||
Gold, $/oz |
|
|
1,248 |
1,258 |
1,269 |
1,350 |
1,338 |
|
Sukhoi Log |
|
|
-40 |
-0.2 |
-20 |
$/RUB |
|
|
67.0 |
58.3 |
62.8 |
67.0 |
68.0 |
|
Other |
|
|
-1,292 |
-4.9 |
-655 |
Gold breakeven price, $/oz |
715 |
830 |
908 |
931 |
1,021 |
|
Operating value |
|
|
16,516 |
62.4 |
8,360 |
||
|
|
|
|
|
|
|
|
|
Financial instruments and rehab provision as at 31 December 201 |
-673 |
-2.5 |
-351 |
||
Gold production volumes, koz |
|
|
|
|
|
|
Enterprise value |
|
|
15,843 |
59.9 |
8,010 |
||
Olimpiada lumes |
984 |
1,177 |
1,322 |
1,313 |
1,354 |
|
Net debt as at 31 December 2017 |
|
|
-3,077 |
-11.6 |
-1,571 |
||
Blagodatnoye |
lumes |
457 |
457 |
409 |
462 |
493 |
|
Minority interest |
|
|
-92 |
-0.3 |
-50 |
|
Verninskoye lumes |
186 |
206 |
232 |
210 |
210 |
|
Convertible debt cost at conversion price |
|
|
-58 |
-0.2 |
-40 |
||
Alluvials |
lumes |
169 |
146 |
135 |
131 |
127 |
|
Cash raised in rights issue during 2018E |
|
|
0 |
0.0 |
0 |
|
Kuranakh |
lumes |
160 |
171 |
199 |
185 |
185 |
|
Equity value |
|
|
12,616 |
47.7 |
6,349 |
|
Natalka |
lumes |
6 |
3 |
133 |
498 |
429 |
|
|
|
|
|
|
|
|
Rounded to |
|
|
|
48.0 |
6,300 |
|||||||||
Sukhoi Log |
lumes |
0 |
0 |
0 |
0 |
0 |
|
Share price on 1/2/2019 |
|
|
|
42.5 |
5,522 |
|
Total volumes |
1,960 |
2,160 |
2,429 |
2,800 |
2,799 |
|
Expected share price return |
|
|
|
12.9% |
14.1% |
||
Volume growth |
11% |
10% |
12% |
15% |
0% |
|
Plus: expected dividend yield |
|
|
|
6.0% |
6.0% |
||
|
|
|
|
|
|
|
|
|
Total implied one-year return |
|
|
|
19.0% |
20.1% |
Contribution to FY18E adjusted EBITDA
|
|
Kuranakh |
NatalkaOther |
|
Alluvials |
7% |
1% 1% |
Verninskoye |
2% |
|
Olimpiada |
|
|
||
10% |
|
|
60% |
Blagodatnoye |
|
|
|
19% |
|
|
|
Share price range, RUB |
|
|
|
|
|
|
12-month high on 31-1-2019 |
5,678 |
12-month low on 9-4-2018 |
3,208 |
|||
Price move since high |
-2.8% |
Price move since low |
|
72.1% |
||
Calculation of WACC |
|
|
|
|
|
|
WACC |
8.7% |
Cost of debt |
|
|
7.0% |
|
Risk-free rate |
4.0% |
Tax rate |
|
|
20% |
|
Equity risk premium |
6.0% |
After-tax cost of debt |
|
1.7% |
||
Beta |
1.00 |
Debt weighting |
|
30% |
||
Cost of equity |
10.0% |
Terminal growth rate |
|
2.0% |
||
Valuation ratios |
|
|
|
|
|
|
Dec-YE, $mn |
2016 |
2017 |
|
2018E |
2019E |
2020E |
P/E multiple |
9.4x |
9.7x |
|
8.5x |
7.0x |
7.2x |
Dividend yield |
0.0% |
5.3% |
|
5.0% |
5.9% |
6.8% |
EV/EBITDA |
7.5x |
7.8x |
|
7.8x |
5.5x |
5.4x |
P/B |
-16.2x |
17.9x |
|
26.6x |
8.3x |
5.2x |
NAV per share, $ |
-3.9 |
4.3 |
|
3.2 |
10.2 |
16.2 |
Source: Bloomberg, Thomson Reuters, Renaissance Capital estimates
62

vk.com/id446425943
Sibanye-Stillwater – HOLD
Renaissance Capital
6 February 2019
Metals & Mining
Figure 96: Sibanye-Stillwater, $mn (unless otherwise noted) |
|
|
|
|
|
|
|
|
|
|
|
|||||||
Sibanye-Stillwater |
|
|
|
SGLJ.J |
|
|
|
|
|
Target price, ZAR: |
|
|
11.1 |
|||||
Market capitalisation, $mn: |
|
|
2,070 |
|
|
|
|
|
|
Share price, ZAR: |
|
|
12.1 |
|||||
Enterprise value, $mn: |
|
|
4,104 |
|
|
|
|
|
|
Potential 12-month return: |
|
-8.1% |
||||||
|
|
|
|
|
|
|
|
|
|
|
|
|
|
|
|
|
|
|
Dec-YE |
|
|
|
|
2016 |
2017 |
|
2018E |
2019E |
2020E |
Dec-YE |
2016 |
2017 |
|
2018E |
2019E |
2020E |
|
Income statement |
|
|
|
|
|
|
|
|
|
Balance sheet |
|
|
|
|
|
|
||
Revenue |
|
|
|
2,128 |
3,449 |
|
3,745 |
4,342 |
4,465 |
|
Net operating assets |
1,938 |
4,316 |
|
3,716 |
3,882 |
3,969 |
|
EBITDA |
|
|
|
|
717 |
680 |
|
705 |
1,190 |
1,152 |
|
Investments, net of rehab provision |
-134 |
-466 |
|
-390 |
-390 |
-390 |
EBIT |
|
|
|
|
442 |
251 |
|
233 |
703 |
635 |
|
Equity |
1,220 |
1,942 |
|
1,901 |
2,248 |
2,554 |
Other items |
|
|
|
-79 |
-47 |
|
-54 |
-88 |
-105 |
|
Minority interest |
0 |
0 |
|
1 |
4 |
6 |
|
Net interest |
|
|
|
-94 |
-254 |
|
-100 |
-149 |
-126 |
|
Net debt |
585 |
1,908 |
|
1,424 |
1,239 |
1,018 |
|
Taxation |
|
|
|
-77 |
221 |
|
-23 |
-130 |
-113 |
|
Balance sheet ratios |
|
|
|
|
|
|
|
Minority interest in profit |
|
29 |
-0 |
|
-6 |
-14 |
-12 |
|
|
|
|
|
|
|
||||
Net profit for the year |
|
263 |
-333 |
|
49 |
348 |
306 |
|
Gearing (net debt/(net debt+equity)) |
32.4% |
49.6% |
|
42.8% |
35.5% |
28.5% |
|||
Headline earnings |
|
|
171 |
-17 |
|
51 |
348 |
306 |
|
Net debt to EBITDA |
0.8x |
2.8x |
|
2.0x |
1.0x |
0.9x |
||
Headline EPS, ZAR |
|
1.62 |
-0.12 |
|
0.29 |
2.02 |
1.74 |
|
RoCE |
23.7% |
6.8% |
|
4.9% |
15.4% |
13.5% |
|||
|
|
|
RoIC (after tax) |
23.3% |
22.2% |
|
3.3% |
11.8% |
10.6% |
|||||||||
Consensus HEPS, ZAR |
|
|
|
|
0.30 |
1.23 |
1.55 |
|
RoE |
15.7% |
-1.1% |
|
2.6% |
16.8% |
12.7% |
|||
DPS declared, ZAR |
|
1.45 |
0.00 |
|
0.00 |
0.00 |
0.24 |
|
Cash flow statement |
|
|
|
|
|
|
|||
|
|
|
|
|
|
|
|
|
|
|
|
|
|
|
|
|
|
|
Underlying EBIT |
|
|
|
|
|
|
|
|
|
Operating cash flow |
573 |
1,120 |
|
1,134 |
941 |
1,010 |
||
Driefontein |
|
|
|
192 |
54 |
|
-59 |
73 |
77 |
|
Capex (net of disposals) |
-283 |
-458 |
|
-528 |
-548 |
-584 |
|
EBIT margin |
|
|
|
30% |
9% |
|
-14% |
14% |
14% |
|
Other cash flows |
-633 |
-3,074 |
|
31 |
-88 |
-105 |
|
Kloof |
|
|
|
|
181 |
123 |
|
76 |
177 |
124 |
|
Free cash flow |
-342 |
-2,412 |
|
637 |
304 |
321 |
EBIT margin |
|
|
|
30% |
19% |
|
12% |
25% |
20% |
|
Equity shareholders' cash |
-276 |
-2,262 |
|
484 |
185 |
221 |
|
Beatrix |
|
|
|
|
89 |
16 |
|
14 |
51 |
31 |
|
Dividends and share buy-backs |
-110 |
939 |
|
0 |
0 |
0 |
EBIT margin |
|
|
|
22% |
4% |
|
4% |
14% |
9% |
|
Surplus (deficit) cash |
-386 |
-1,324 |
|
484 |
185 |
221 |
|
Rustenburg |
T |
|
|
1 |
45 |
|
83 |
106 |
99 |
|
Cash flow ratios |
|
|
|
|
|
|
|
EBIT margin |
|
|
|
1% |
6% |
|
10% |
11% |
9% |
|
|
|
|
|
|
|
||
Stillwater |
|
|
|
0 |
54 |
|
133 |
249 |
258 |
|
Working capital turnover, days |
15 |
27 |
|
-23 |
-11 |
-8 |
|
EBIT margin |
|
|
|
- |
8% |
|
11% |
18% |
17% |
|
FCF yield |
-13.6% |
-50.6% |
|
20.0% |
9.2% |
10.4% |
|
Other |
|
|
|
|
-22 |
-40 |
|
-13 |
47 |
46 |
|
Equity shareholders' yield |
-14.3% |
-79.2% |
|
27.6% |
9.0% |
10.7% |
Adjusted EBIT |
|
|
442 |
251 |
|
233 |
703 |
635 |
|
Capex/EBITDA |
39.4% |
67.4% |
|
74.8% |
46.1% |
50.7% |
||
Income statement ratios |
|
|
|
|
|
|
|
|
Cash conversion |
-1.6x |
134.7x |
|
9.6x |
0.5x |
0.7x |
|||
|
|
|
|
|
|
|
|
Valuation |
|
|
|
|
|
|
||||
EBITDA margin |
|
|
34% |
20% |
|
19% |
27% |
26% |
|
|
|
|
|
$mn |
|
|||
EBIT margin |
|
|
|
21% |
7% |
|
6% |
16% |
14% |
|
SoTP DCF fair value |
|
|
|
|
ZAR/sh |
||
HEPS Growth |
|
|
119% |
-107% |
|
342% |
597% |
-14% |
|
Driefontein |
|
|
|
|
304 |
1.9 |
||
Dividend payout ratio |
|
57% |
0% |
|
- |
0% |
14% |
|
Kloof |
|
|
|
|
761 |
4.8 |
|||
Input assumptions |
|
|
|
|
|
|
|
|
|
Beatrix |
|
|
|
|
109 |
0.7 |
||
|
|
|
|
|
|
|
|
|
Cooke |
|
|
|
|
-292 |
-1.8 |
|||
Gold, $/oz |
|
|
|
1,248 |
1,258 |
|
1,269 |
1,350 |
1,338 |
|
Burnstone |
|
|
|
|
107 |
0.7 |
|
Platinum, $/oz |
|
|
988 |
950 |
|
880 |
870 |
1,070 |
|
Rustenburg |
|
|
|
|
931 |
5.9 |
||
Palladium, $/oz |
|
|
614 |
871 |
|
1,030 |
1,216 |
1,088 |
|
Kroondal |
|
|
|
|
202 |
1.3 |
||
ZAR/$ |
|
|
|
|
14.70 |
13.31 |
|
13.24 |
14.31 |
14.14 |
|
Stillwater |
|
|
|
|
2,931 |
18.5 |
Gold breakeven price, $/oz |
|
976 |
1,161 |
|
1,288 |
1,177 |
1,231 |
|
Equity accounted income |
|
|
|
|
263 |
1.7 |
|||
PGM breakeven price, $/oz |
|
776 |
1,049 |
|
1,189 |
1,226 |
1,250 |
|
Corporate and other |
|
|
|
|
-1,026 |
-6.5 |
|||
Mined volumes, koz |
|
|
|
|
|
|
|
|
Operating value |
|
|
|
|
4,290 |
27.1 |
|||
|
|
|
|
|
|
|
|
Financial instruments and rehab provision as at 31 December 2017 |
|
-466 |
-2.9 |
|||||||
Driefontein lumes |
|
|
516 |
485 |
|
331 |
400 |
420 |
|
Enterprise value |
|
|
|
|
3,823 |
24.1 |
||
Kloof |
lumes |
|
|
488 |
529 |
|
514 |
523 |
460 |
|
Net debt as at 31 December 2017 |
|
|
|
|
-1,908 |
-12.0 |
|
Beatrix |
lumes |
|
|
323 |
292 |
|
274 |
266 |
266 |
|
Minority interest |
|
|
|
|
-126 |
-1.1 |
|
Cooke |
lumes |
|
|
181 |
100 |
|
31 |
28 |
0 |
|
19.9% stake in Aldebaran |
|
|
|
|
8 |
0.1 |
|
Gold |
lumes |
|
|
1,508 |
1,407 |
|
1,174 |
1,324 |
1,293 |
|
Cash raised in rights issue during 2018E |
|
|
|
|
0 |
0.0 |
|
Rustenburg |
lumes |
|
138 |
810 |
|
769 |
785 |
810 |
|
Equity value |
|
|
|
|
1,798 |
11.1 |
||
Kroondal lumes |
|
|
178 |
241 |
|
245 |
240 |
220 |
|
|
|
|
|
|
|
|
||
|
|
Rounded to |
|
|
|
|
|
11.1 |
||||||||||
Mimosa |
lumes |
|
|
91 |
124 |
|
122 |
120 |
120 |
|
Share price on 3/2/2019 |
|
|
|
|
|
12.1 |
|
Stillwater lumes |
|
|
0 |
355 |
|
587 |
700 |
800 |
|
Expected share price return |
|
|
|
|
|
-8.3% |
||
PGM's 4E |
lumes |
|
|
421 |
1,550 |
|
1,741 |
1,863 |
1,968 |
|
Plus: expected dividend yield |
|
|
|
|
|
0.2% |
|
Attributable Cu eq volume growth |
24% |
50% |
|
-2% |
9% |
2% |
|
Total implied one-year return |
|
|
|
|
|
-8.1% |
||||
Contribution to FY18E proportionately consolidated underlying EBITDA |
|
|
|
Share price range, ZAR: |
|
|
|
|
|
|
||||||||
|
|
|
|
|
|
|
|
|
|
|
|
12-month high on 2-2-2018 |
14 |
12-month low on 19-7-2018 |
7 |
|||
|
|
|
|
|
|
|
|
|
|
|
|
Price move since high |
-10.7% Price move since low |
|
77.4% |
|||
|
|
|
|
|
Driefontein |
|
|
|
|
Calculation of WACC |
|
|
|
|
|
|
||
|
Stillwater |
|
3% |
|
|
|
Kloof |
|
|
|
|
|
|
|
|
|||
|
|
|
|
|
|
|
|
WACC |
9.6% |
Cost of debt |
|
|
5.0% |
|||||
|
|
|
|
|
|
21% |
|
|
|
|
||||||||
|
|
37% |
|
|
|
|
|
|
|
|
Risk-free rate |
4.0% |
Tax rate |
|
|
28% |
||
|
|
|
|
|
|
|
|
|
|
|
|
|
||||||
|
|
|
|
|
|
|
|
|
|
|
|
|
|
|||||
|
|
|
|
|
|
|
|
|
|
|
|
Equity risk premium |
5.5% After-tax cost of debt |
|
0.7% |
|||
|
|
|
|
|
|
|
|
|
|
|
|
Beta |
1.30 |
Debt weighting |
|
20% |
||
|
|
|
|
|
|
|
|
|
|
|
|
Cost of equity |
11.2% |
Terminal growth rate |
|
2.0% |
||
|
|
|
|
|
|
|
|
|
|
Beatrix |
Valuation ratios |
|
|
|
|
|
|
|
|
|
|
|
|
|
|
|
|
|
7% |
|
|
|
|
|
|
|
|
|
|
|
|
|
|
|
|
|
|
|
Dec-YE, $mn |
2016 |
2017 |
|
2018E |
2019E |
2020E |
|
|
Plat Mile |
|
|
|
|
|
|
|
Cooke |
|
||||||||
|
0% |
Mimosa |
|
|
Rustenburg |
|
DRD Gold |
-4% |
|
P/E multiple |
26.1x |
-131.8x |
|
35.8x |
5.9x |
6.7x |
||
|
|
|
|
|
|
|
|
Dividend yield |
4.7% |
0.0% |
|
0.0% |
0.0% |
1.9% |
||||
|
|
|
6% |
Kroondal |
|
|
|
|
|
|||||||||
|
|
|
|
16% |
|
|
0% |
|
|
EV/EBITDA |
3.5x |
7.0x |
|
4.5x |
2.8x |
2.7x |
||
|
|
|
|
6% |
|
|
|
|
|
|
|
|
||||||
|
|
|
|
|
|
|
|
|
|
|
P/B |
1.6x |
1.5x |
|
0.9x |
0.9x |
0.8x |
|
|
|
|
|
|
|
|
|
|
|
|
|
|
||||||
|
|
|
|
|
|
|
|
|
|
|
|
NAV per share, $ |
1.3 |
0.9 |
|
0.8 |
1.0 |
1.1 |
|
|
|
|
|
|
|
|
|
|
|
|
NAV per share, ZAR |
19 |
12 |
|
11 |
14 |
16 |
Source: Bloomberg, Thomson Reuters, Renaissance Capital estimates
63