

vk.com/id446425943
Harmony Gold – SELL
Renaissance Capital
6 February 2019
Metals & Mining
Figure 93: Harmony Gold, ZARmn (unless otherwise noted)
Harmony |
HARJ.J |
Target price, ZAR: |
21 |
Market capitalisation, ZARmn: |
14,581 |
Share price, ZAR: |
27 |
Enterprise value, ZARmn: |
19,489 |
Potential 12-month return: |
-18.5% |
Jun-YE |
|
|
|
2017 |
2018 |
2019E |
2020E |
2021E |
Income statement |
|
|
|
|
|
|
||
Revenue |
|
|
19,264 |
20,358 |
26,675 |
27,616 |
25,701 |
|
Underlying EBITDA |
|
4,452 |
5,356 |
8,641 |
9,646 |
7,543 |
||
Underlying EBIT |
|
1,933 |
2,786 |
5,618 |
6,667 |
4,571 |
||
Other items |
|
|
-2,292 |
-6,862 |
-1,271 |
-1,383 |
-1,363 |
|
Net interest |
|
|
233 |
-669 |
-468 |
-335 |
-147 |
|
Taxation |
|
|
|
510 |
234 |
-1,018 |
-1,443 |
-918 |
Net profit for the year |
362 |
-4,473 |
2,861 |
3,506 |
2,143 |
|||
Headline earnings |
|
1,306 |
763 |
2,861 |
3,506 |
2,143 |
||
Headline EPS, ZAR |
|
2.98 |
1.71 |
5.72 |
7.01 |
4.28 |
||
Thomson Reuters consensus HEPS, ZAR |
|
|
3.48 |
4.91 |
3.37 |
|||
DPS declared, ZAR |
|
0.85 |
0.35 |
0.82 |
1.05 |
0.65 |
||
Production EBIT |
|
1,768 |
2,432 |
3,585 |
4,866 |
2,995 |
||
South Africa underground |
||||||||
EBIT margin |
|
|
11% |
14% |
18% |
22% |
15% |
|
South Africa Surface |
|
174 |
235 |
284 |
347 |
200 |
||
EBIT margin |
|
|
10% |
12% |
13% |
18% |
11% |
|
Hidden Valley |
|
-9 |
119 |
1,288 |
1,442 |
1,377 |
||
EBIT margin |
|
|
-1% |
29% |
35% |
41% |
41% |
|
Group production EBIT |
1,933 |
2,786 |
5,618 |
6,667 |
4,571 |
|||
Income statement ratios |
|
|
|
|
|
|||
EBITDA margin |
|
23% |
26% |
32% |
35% |
29% |
||
EBIT margin |
|
|
10% |
14% |
21% |
24% |
18% |
|
HEPS Growth |
|
35% |
-43% |
235% |
23% |
-39% |
||
Dividend payout ratio |
29% |
20% |
14% |
15% |
15% |
|||
Input assumptions |
|
|
|
|
|
|
||
Gold, $/oz |
|
|
1,257 |
1,298 |
1,273 |
1,369 |
1,309 |
|
$/ZAR |
|
|
|
13.60 |
12.85 |
14.25 |
14.25 |
14.09 |
Calculated breakeven price, $/oz |
|
|
|
|
|
|||
South Africa breakeven |
1,097 |
1,117 |
1,061 |
1,086 |
1,111 |
|||
International breakeven |
1,168 |
1,105 |
897 |
828 |
667 |
|||
Group breakeven |
|
1,193 |
1,208 |
1,084 |
1,120 |
1,123 |
||
Gold production volumes, koz |
|
|
|
|
|
|||
Kusasalethu |
lumes |
141 |
142 |
156 |
156 |
156 |
||
Doornkop |
lumes |
|
86 |
110 |
107 |
88 |
88 |
|
Tshepong/Phakisa lumes |
284 |
302 |
287 |
290 |
290 |
|||
Masimong |
lumes |
|
82 |
84 |
73 |
74 |
74 |
|
Target 1 |
lumes |
|
86 |
92 |
87 |
100 |
100 |
|
Bambanani |
lumes |
|
88 |
91 |
82 |
84 |
84 |
|
Joel lumes |
|
72 |
53 |
50 |
72 |
72 |
||
Unisel |
lumes |
|
51 |
41 |
32 |
21 |
0 |
|
Moab |
lumes |
|
0 |
106 |
248 |
250 |
250 |
|
Surface |
lumes |
|
102 |
115 |
124 |
100 |
100 |
|
South Africa Total |
lumes |
993 |
1,136 |
1,244 |
1,235 |
1,214 |
||
Hidden Valley lumes |
84 |
26 |
202 |
180 |
180 |
|||
International total |
lumes |
84 |
26 |
202 |
180 |
180 |
||
Total production |
lumes |
1,076 |
1,161 |
1,445 |
1,415 |
1,394 |
||
Attributable Cu eq volumes, kt |
214 |
230 |
287 |
281 |
277 |
|||
Volume growth |
|
-0.5% |
7.9% |
24.5% |
-2.1% |
-1.5% |
||
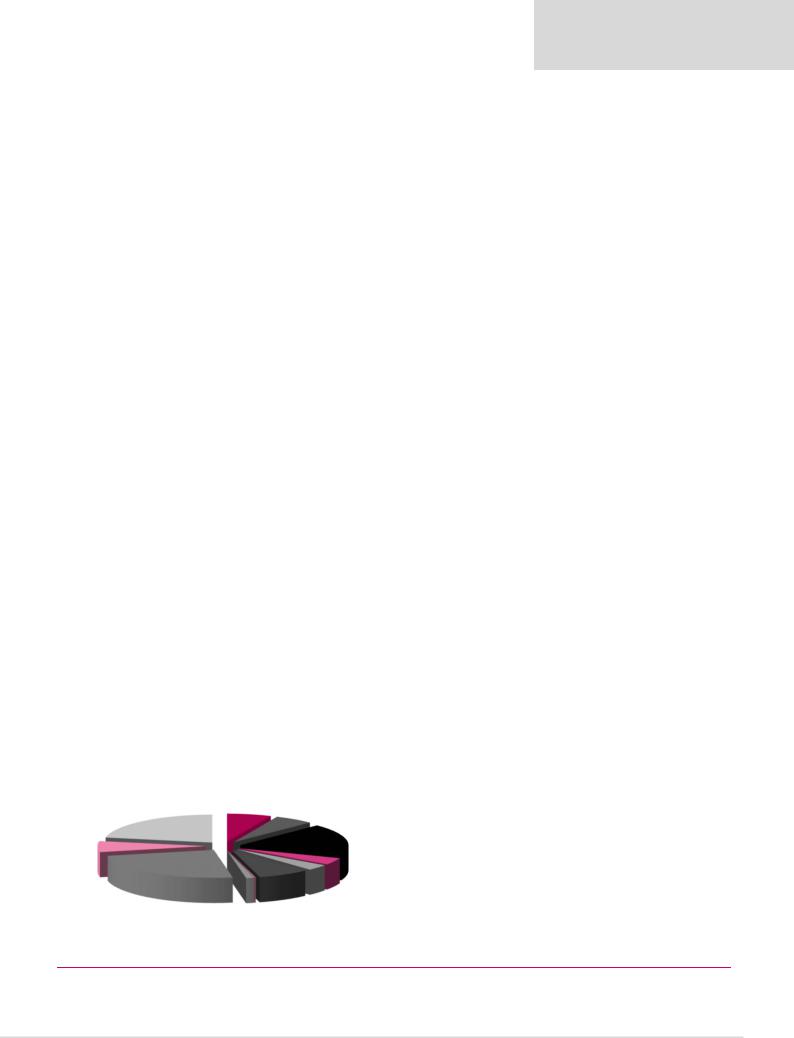
Contribution to FY19E mining EBITDA |
|
|
|
|
|
Kusasalethu |
|
||
Hidden Valley |
|
7% |
Doornkop |
|
|
|
6% |
|
|
22% |
|
|
|
|
|
|
|
Tshepong/Phakisa |
|
|
|
|
|
|
|
|
|
|
18% |
Surface |
|
|
|
|
6% |
|
|
|
Masimong |
|
|
|
|
|
|
|
|
|
4% |
Moab |
|
|
Bambanani |
Target 1 |
Unisel |
Joel |
3% |
||
25% |
8% |
|
||
|
1% |
0% |
|
|
Jun-YE |
2017 |
2018 |
|
2019E |
2020E |
2021E |
Balance sheet |
|
|
|
|
|
|
Net operating assets |
28,225 |
29,794 |
|
31,772 |
32,825 |
33,118 |
Investments, net of rehab provision |
1,953 |
496 |
|
496 |
496 |
496 |
Equity |
29,291 |
25,382 |
|
28,286 |
31,493 |
33,436 |
Minority interest |
0 |
0 |
|
0 |
0 |
0 |
Net debt |
887 |
4,908 |
|
3,982 |
1,827 |
178 |
Balance sheet ratios |
|
|
|
|
|
|
Gearing (net debt/(net debt+equity)) |
2.9% |
16.2% |
|
12.3% |
5.5% |
0.5% |
Net debt to EBITDA |
0.2x |
0.9x |
|
0.5x |
0.2x |
0.0x |
RoCE |
6.3% |
8.9% |
|
17.0% |
19.2% |
12.8% |
RoIC (after tax) |
8.8% |
7.3% |
|
14.3% |
15.5% |
10.5% |
RoE |
4.5% |
2.8% |
|
10.7% |
11.7% |
6.6% |
Cash flow statement |
|
|
|
|
|
|
Operating cash flow |
5,224 |
4,811 |
|
7,637 |
8,382 |
6,803 |
Capex (net of disposals) |
-3,887 |
-4,571 |
|
-5,146 |
-4,304 |
-3,485 |
Other cash flows |
317 |
-5,930 |
|
-1,053 |
-1,165 |
-1,144 |
Free cash flow |
1,654 |
-5,690 |
|
1,438 |
2,913 |
2,174 |
Equity shareholders' cash |
635 |
-4,714 |
|
1,101 |
2,671 |
2,068 |
Dividends and share buy-backs |
-439 |
693 |
|
-175 |
-516 |
-419 |
Surplus (deficit) cash |
196 |
-4,021 |
|
926 |
2,155 |
1,649 |
Cash flow ratios |
3 |
4 |
|
5 |
4 |
3 |
Working capital turnover, days |
|
|||||
FCF yield |
9.3% |
-34.1% |
|
8.2% |
19.0% |
15.9% |
Equity shareholders' yield |
3.7% |
-40.0% |
|
8.2% |
19.8% |
15.4% |
Capex/EBITDA |
87.3% |
85.3% |
|
59.6% |
44.6% |
46.2% |
Cash conversion |
0.5x |
-6.2x |
|
0.4x |
0.8x |
1.0x |
Valuation |
|
|
|
|
|
|
SoTP DCF fair value and calculation of target price |
|
|
|
ZARmn |
ZAR/sh |
|
Kusasalethu |
|
|
|
|
545 |
1.1 |
Doornkop |
|
|
|
|
727 |
1.5 |
Tshepong/Phakisa |
|
|
|
|
4,304 |
8.6 |
Masimong |
|
|
|
|
448 |
0.9 |
Target 1 |
|
|
|
|
330 |
0.7 |
Bambanani |
|
|
|
|
1,675 |
3.3 |
Joel |
|
|
|
|
382 |
0.8 |
Unisel |
|
|
|
|
73 |
0.1 |
Moab |
|
|
|
|
5,698 |
11.4 |
Surface |
|
|
|
|
2,224 |
4.4 |
Hidden Valley |
|
|
|
|
2,268 |
4.5 |
Other |
|
|
|
|
-6,528 |
-13.0 |
Operating value |
|
|
|
|
12,147 |
24.3 |
Financial instruments and rehab provision as at 30 June 2018 |
|
|
|
496 |
1.0 |
|
Enterprise value |
|
|
|
|
12,643 |
25.3 |
Net debt as at 30 June 2018 |
|
|
|
|
-4,908 |
-9.8 |
Minority interest |
|
|
|
|
0 |
0.0 |
50% Golpu value assuming it trades at avg. replacement cost |
|
|
|
2,814 |
5.6 |
|
Cash used in share buy-backs during 2019E |
|
|
|
|
0 |
0.0 |
Equity value |
|
|
|
|
10,549 |
21.1 |
Rounded to |
|
|
|
|
|
21.0 |
Share price on 1/2/2019 |
|
|
|
|
|
26.9 |
Expected share price return |
|
|
|
|
|
-22.0% |
Plus: expected dividend yield |
|
|
|
|
|
3.6% |
Total implied one-year return |
|
|
|
|
|
-18.5% |
Share price range, ZAR: |
|
|
|
|
|
|
12-month high on 16-10-2018 |
32 |
12-month low on 7-2-2018 |
|
19 |
||
Price move since high |
-14.5% |
Price move since low |
|
41.3% |
||
Calculation of WACC |
|
|
|
|
|
|
WACC |
13.0% |
Cost of debt |
|
|
10.0% |
|
Risk-free rate |
9.0% |
Tax rate |
|
|
28% |
|
Equity risk premium |
5.0% |
After-tax cost of debt |
|
1.1% |
||
Beta |
1.00 |
Debt weighting |
|
|
15% |
|
Cost of equity |
14.0% |
Terminal growth rate |
|
6.0% |
||
Valuation ratios |
|
|
|
|
|
|
Dec-YE, $mn |
2017 |
2018 |
|
2019E |
2020E |
2021E |
P/E multiple |
12.9x |
13.8x |
|
4.7x |
3.8x |
6.3x |
Dividend yield |
2.2% |
1.5% |
|
3.0% |
3.9% |
2.4% |
EV/EBITDA |
4.0x |
3.1x |
|
2.0x |
1.6x |
1.8x |
P/B |
0.6x |
0.5x |
|
0.5x |
0.4x |
0.4x |
NAV per share, ZAR |
66.6 |
50.7 |
|
56.5 |
63.0 |
66.8 |
Source: Bloomberg, Thomson Reuters, Renaissance Capital estimates
60