

vk.com/id446425943
NorNickel – BUY
Renaissance Capital
6 February 2019
Metals & Mining
Figure 86: NorNickel, $mn (unless otherwise noted)
NorNickel |
|
GMKN.MM |
|
|
|
Market capitalisation, $mn: |
|
32,778 |
|
|
|
Enterprise value, $mn: |
|
41,310 |
|
|
|
|
|
|
|
|
|
Dec-YE |
2016 |
2017 |
2018E |
2019E |
2020E |
Income statement |
|
|
|
|
|
Revenue |
8,259 |
9,146 |
11,346 |
10,865 |
11,714 |
EBITDA |
3,898 |
3,995 |
5,924 |
5,649 |
6,169 |
EBIT |
3,280 |
3,123 |
5,193 |
4,851 |
5,296 |
Net interest |
-339 |
-458 |
-374 |
-372 |
-461 |
Taxation |
-745 |
-721 |
-957 |
-1,075 |
-1,160 |
Minority interest in profit |
5 |
6 |
-6 |
-103 |
-156 |
Net profit for the year |
2,535 |
2,129 |
3,403 |
3,302 |
3,519 |
Underlying earnings |
2,535 |
2,129 |
3,403 |
3,302 |
3,519 |
Underlying EPS, $ |
1.62 |
1.35 |
2.15 |
2.09 |
2.22 |
Thomson Reuters consensus EPS, $ |
|
|
2.39 |
2.55 |
2.70 |
DPS declared, $ |
1.08 |
1.17 |
2.16 |
2.14 |
2.25 |
Thomson Reuters consensus DPS, $ |
|
######## |
2.08 |
2.17 |
2.50 |
EBIT by division |
|
|
|
|
|
|
|
|
|
|
|
Russia (GMK & KGMK) |
3,524 |
4,299 |
5,904 |
5,451 |
5,706 |
EBIT margin |
55% |
58% |
67% |
65% |
66% |
NN Harjavalta |
17 |
59 |
32 |
-47 |
73 |
EBIT margin |
2% |
7% |
3% |
-5% |
7% |
Other metallurgical |
-11 |
-126 |
68 |
257 |
390 |
EBIT margin |
-157% |
-371% |
24% |
40% |
45% |
Other non-metallurgical |
96 |
91 |
-12 |
5 |
5 |
EBIT margin |
9% |
11% |
-1% |
1% |
1% |
Other |
-285 |
-973 |
-793 |
-815 |
-879 |
Income statement ratios |
|
|
|
|
|
EBITDA margin |
47% |
44% |
52% |
52% |
53% |
EBIT margin |
40% |
34% |
46% |
45% |
45% |
EPS growth |
47% |
-17% |
60% |
-3% |
7% |
Dividend payout ratio |
67% |
87% |
100% |
103% |
101% |
Dividend as % of EBITDA |
44% |
46% |
58% |
60% |
58% |
Input assumptions |
|
|
|
|
|
Nickel, $/t |
9,599 |
10,404 |
13,130 |
11,530 |
14,285 |
Copper, $/t |
4,867 |
6,170 |
6,532 |
6,000 |
6,367 |
Palladium, $/oz |
614 |
871 |
1,030 |
1,216 |
1,088 |
Platinum, $/oz |
988 |
950 |
880 |
870 |
1,070 |
RUB/$ |
67 |
58 |
63 |
67 |
68 |
Unit costs per nickel eq tonne, $ |
6,109 |
8,163 |
7,560 |
7,245 |
7,611 |
Sustaining capex per nickel eq tonne, $ |
814 |
1,187 |
897 |
2,361 |
2,396 |
Production volumes* |
236 |
217 |
219 |
214 |
214 |
Nickel, kt |
|||||
Copper, kt |
360 |
401 |
474 |
481 |
494 |
Palladium, koz |
2,618 |
2,780 |
2,728 |
2,684 |
2,684 |
Platinum, koz |
644 |
670 |
653 |
648 |
648 |
Attributable Cu eq volumes, kt |
1,412 |
1,442 |
1,507 |
1,496 |
1,509 |
Volume growth |
-6% |
2% |
5% |
-1% |
1% |
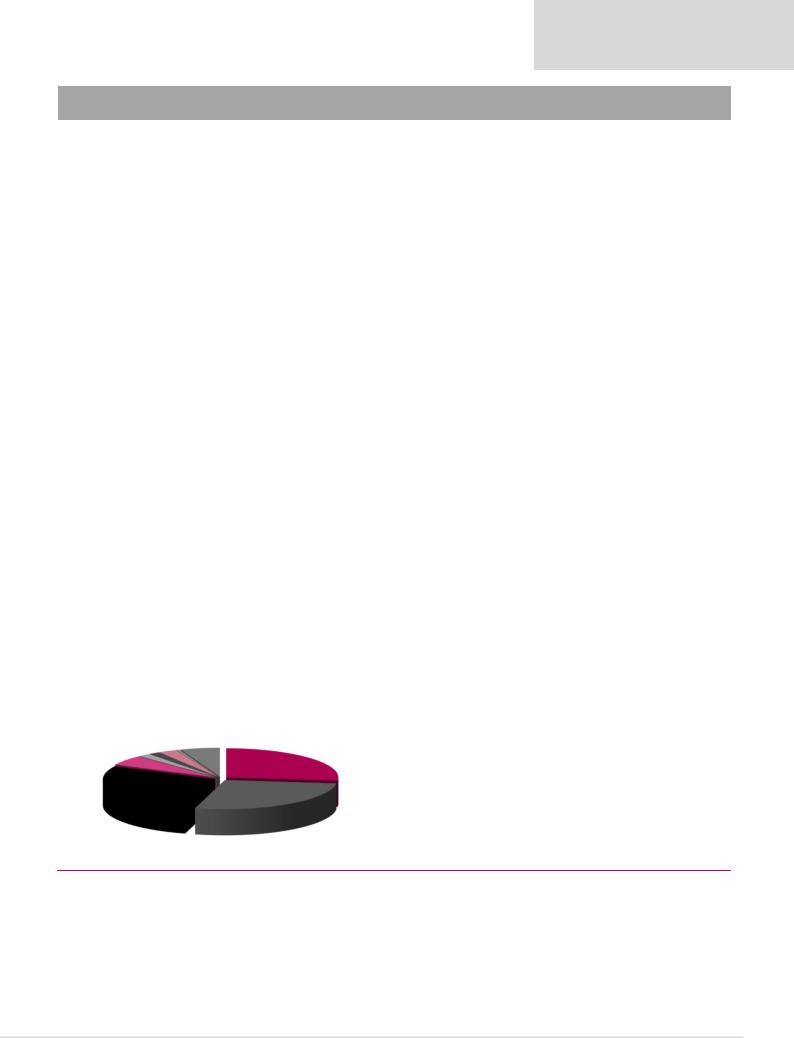
Contribution to 2018E revenue per commodity
|
Target Price, $: |
|
|
24.0 |
|
|
Share price, $: |
|
|
20.8 |
|
|
Potential 12-month return: |
|
26.0% |
||
|
|
|
|
|
|
Dec-YE |
2016 |
2017 |
2018E |
2019E |
2020E |
Balance sheet |
|
|
|
|
|
Net operating assets |
10,299 |
13,581 |
12,337 |
13,836 |
15,431 |
Financial instruments |
198 |
267 |
259 |
259 |
259 |
Equity |
4,986 |
4,333 |
3,876 |
3,794 |
3,758 |
Minority interest |
74 |
331 |
309 |
411 |
567 |
Net debt |
4,530 |
8,201 |
7,466 |
8,896 |
10,323 |
Balance sheet ratios |
|
|
|
|
|
Gearing (net debt/(net debt+equity)) |
47.6% |
65.4% |
65.8% |
70.1% |
73.3% |
Net debt to EBITDA |
1.2x |
2.1x |
1.3x |
1.6x |
1.7x |
RoCE |
37.0% |
28.1% |
40.1% |
37.1% |
36.2% |
RoIC (after tax) |
31.1% |
21.5% |
31.9% |
28.7% |
28.0% |
RoE |
64.0% |
45.7% |
82.9% |
86.1% |
93.2% |
Cash flow statement |
|
|
|
|
|
Operating cash flow |
3,737 |
1,339 |
6,060 |
4,551 |
4,897 |
Capex |
-1,714 |
-2,002 |
-1,650 |
-2,300 |
-2,400 |
Other FCF |
-930 |
431 |
29 |
0 |
0 |
FCF |
1,093 |
-232 |
4,439 |
2,251 |
2,497 |
Equity shareholders' cash |
770 |
-667 |
4,148 |
1,954 |
2,128 |
Dividends and share buy backs |
-1,088 |
-3,004 |
-3,448 |
-3,384 |
-3,555 |
Surplus (deficit) cash |
-318 |
-3,671 |
699 |
-1,430 |
-1,427 |
Cash flow ratios |
|
|
|
|
|
Working capital days |
24 |
96 |
39 |
40 |
40 |
Cash Conversion |
0.3x |
-0.3x |
1.2x |
0.6x |
0.6x |
FCF yield |
4.0% |
-0.7% |
12.2% |
5.3% |
5.7% |
Equity shareholders' yield |
3.4% |
-2.6% |
14.5% |
5.9% |
6.5% |
Capex/EBITDA |
44.0% |
50.1% |
27.9% |
40.7% |
38.9% |
Valuation |
|
|
|
$mn |
$/sh |
SoTP DCF valuation and calculation of target price |
|
|
|||
Russia (GMK & KGMK) |
|
|
|
52,031 |
32.9 |
Finland |
|
|
|
832 |
0.5 |
Other metallurgical |
|
|
|
4,756 |
3.0 |
Other non-metallurgical |
|
|
|
30 |
0.0 |
Other |
|
|
|
-11,140 |
-7.0 |
Total enterprise value |
|
|
|
46,508 |
29.4 |
Net debt as at 31 December 2017 |
|
|
|
-8,201 |
-5.2 |
Cash used in share buy-backs |
|
|
|
- |
- |
Other investments |
|
|
|
267 |
0.2 |
Minority interest |
|
|
|
-331 |
-0.2 |
Equity value as at 4/2/2019 |
|
|
|
38,243 |
24.2 |
Rounded to |
|
|
|
|
24.0 |
Share price on 1/2/2019 |
|
|
|
|
20.8 |
Expected share price return |
|
|
|
|
15.6% |
Plus: expected dividend yield |
|
|
|
|
10.4% |
Total implied one-year return |
|
|
|
|
26.0% |
Share price range, $: |
|
|
|
|
|
12-month high on 26/2/2018 |
21.3 |
12-month low on 10/4/2018 |
14.6 |
||
Price move since high |
-2.7% Price move since low |
|
42.5% |
||
Gold |
|
Cobalt |
Silver |
Semi-products and other |
|
2% |
Rhodium |
0% |
|||
3% |
6% |
||||
|
1% |
|
|||
Platinum |
|
|
|
Nickel |
|
6% |
|
|
|
27% |
Palladium
28%
Copper
27%
Calculation of discount rate |
|
|
|
|
|
|
WACC |
9.4% |
Cost of debt |
|
|
5.0% |
|
Risk-free rate |
4.0% |
Tax rate |
|
|
24% |
|
Equity risk premium |
6.0% |
After-tax cost of debt |
|
3.8% |
||
Beta |
1.30 |
Debt weighting |
|
30% |
||
Cost of equity |
11.8% Terminal growth rate |
|
2.5% |
|||
Valuation ratios |
|
|
|
|
|
|
Dec-YE |
2016 |
2017 |
|
2018E |
2019E |
2020E |
P/E multiple |
8.8x |
12.0x |
|
8.4x |
10.0x |
9.3x |
Dividend yield |
7.6% |
7.2% |
|
12.0% |
10.3% |
10.8% |
EV/EBITDA |
6.9x |
8.6x |
|
6.1x |
7.5x |
7.1x |
P/B |
4.5x |
5.9x |
|
7.4x |
8.7x |
8.7x |
NAV per share, $ |
3.2 |
2.7 |
|
2.4 |
2.4 |
2.4 |
* from Russian own feed
Source: Bloomberg, Thomson Reuters, Company data, Renaissance Capital estimates
53