


vk.com/id446425943
Rusal – BUY
Figure 88: Rusal, $mn (unless otherwise noted)
Rusal |
|
0486.HK |
|
|
|
Market capitalisation, $mn: |
|
6,351 |
|
|
|
Enterprise value, $mn: |
|
13,999 |
|
|
|
|
|
|
|
|
|
Dec-YE |
2016 |
2017 |
2018E |
2019E |
2020E |
Income statement |
|
|
|
|
|
Revenue |
7,983 |
9,969 |
10,136 |
9,588 |
10,694 |
Underlying EBITDA |
1,489 |
2,120 |
2,240 |
1,671 |
2,209 |
Underlying EBIT |
1,024 |
1,607 |
1,738 |
1,154 |
1,634 |
EBIT |
1,068 |
1,523 |
1,572 |
1,154 |
1,634 |
Net interest |
-860 |
-855 |
-534 |
-626 |
-576 |
Equity accounted income |
848 |
620 |
1,049 |
918 |
979 |
Taxation |
-175 |
-66 |
-170 |
-90 |
-180 |
Other |
298 |
0 |
0 |
0 |
0 |
Net profit for the year |
1,179 |
1,222 |
1,917 |
1,357 |
1,857 |
Underlying earnings |
1,179 |
1,222 |
1,917 |
1,357 |
1,857 |
Underlying EPS, USc |
7.76 |
8.04 |
12.62 |
8.93 |
12.22 |
Thomson Reuters consensus EPS, USc |
|
|
12.49 |
12.91 |
13.69 |
DPS declared, USc |
1.65 |
1.97 |
2.61 |
2.15 |
2.63 |
Income statement ratios |
|
0.036471 |
|
|
|
|
|
|
|
|
|
EBITDA margin |
19% |
21% |
22% |
17% |
21% |
EBIT margin |
13% |
15% |
16% |
12% |
15% |
EPS growth |
111% |
4% |
57% |
-29% |
37% |
Dividend payout ratio |
21% |
24% |
21% |
24% |
22% |
Input assumptions |
|
|
|
|
|
Aluminium, $/t |
1,604 |
1,968 |
2,110 |
1,953 |
2,166 |
Alumina, $/t |
283 |
376 |
485 |
391 |
412 |
RUB/$ |
67 |
58 |
63 |
67 |
68 |
Estimated aluminium breakeven price, $/t |
1,341 |
1,588 |
1,658 |
1,629 |
1,719 |
Production volumes, kt |
|
|
|
|
|
Aluminium |
|
|
|
|
|
Russia Aluminium |
3,562 |
3,584 |
3,622 |
3,632 |
3,670 |
Other |
161 |
144 |
148 |
147 |
147 |
Total |
3,723 |
3,728 |
3,770 |
3,779 |
3,818 |
Alumina |
|
|
|
|
|
Ireland |
1,967 |
1,938 |
1,925 |
1,970 |
1,970 |
Jamaica |
608 |
582 |
601 |
615 |
615 |
Ukraine |
1,510 |
1,675 |
1,693 |
1,733 |
1,733 |
Russia |
2,730 |
2,821 |
2,844 |
2,911 |
2,911 |
Australia (JV) |
760 |
755 |
754 |
772 |
772 |
Total |
7,528 |
7,772 |
7,816 |
8,000 |
8,000 |
Bauxite |
|
|
|
|
|
Jamaica |
2,123 |
1,954 |
2,235 |
2,462 |
2,462 |
Russia |
5,432 |
5,524 |
6,274 |
6,909 |
6,909 |
Guinea |
3,539 |
3,123 |
3,751 |
4,700 |
6,000 |
Guyana |
1,094 |
1,044 |
1,538 |
1,693 |
1,693 |
Total |
12,187 |
11,646 |
13,794 |
15,764 |
17,064 |
Nepheline |
4,432 |
4,333 |
4,629 |
4,720 |
4,720 |
Aluminium foil and packaging |
85 |
101 |
101 |
101 |
101 |
Sales volumes |
|
|
|
|
|
Aluminium, kt |
3,818 |
3,955 |
3,650 |
3,779 |
3,818 |
Value added products, % of total |
44% |
47% |
46% |
46% |
50% |
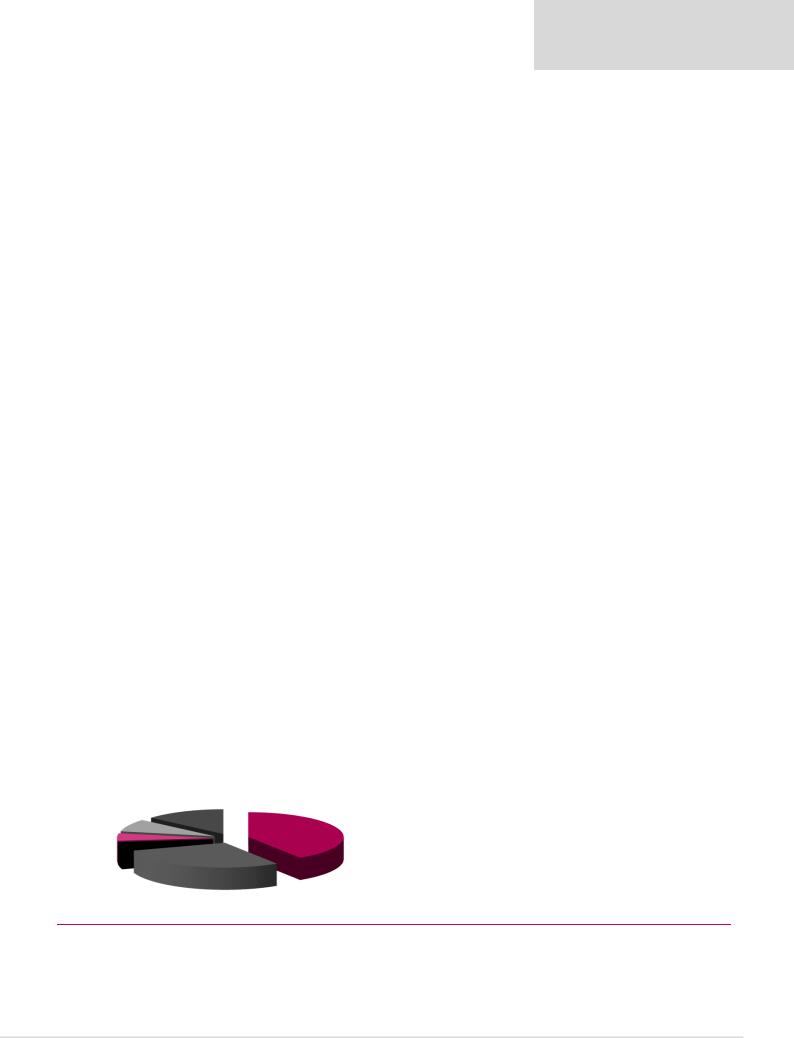
Contribution to enterprise value of $19bn
Norilsk Nickel
44%
Aluminium
56%
Renaissance Capital
6 February 2019
Metals & Mining
|
Target Price, HKD: |
|
|
6.0 |
||
|
Share price, HKD: |
|
|
3.3 |
||
|
Potential 12-month return: |
|
88.2% |
|||
|
|
|
|
|
|
|
Dec-YE |
2016 |
2017 |
|
2018E |
2019E |
2020E |
Balance sheet |
|
|
|
|
|
|
Net operating assets |
11,377 |
12,139 |
|
12,303 |
12,287 |
12,548 |
Financial instruments |
32 |
-50 |
|
-36 |
-36 |
-36 |
Equity |
2,988 |
4,441 |
|
5,285 |
6,315 |
7,772 |
Minority interest |
0 |
0 |
|
0 |
0 |
0 |
Net debt |
8,421 |
7,648 |
|
6,982 |
5,937 |
4,740 |
Balance sheet ratios |
|
|
|
|
|
|
Gearing (net debt/(net debt+equity)) |
73.8% |
63.3% |
|
56.9% |
48.5% |
37.9% |
Net debt/(EBITDA+dividends from associat |
4.7x |
2.4x |
|
2.2x |
2.3x |
1.5x |
RoCE |
8.8% |
12.6% |
|
13.3% |
8.8% |
12.3% |
RoIC (after tax) |
5.7% |
10.3% |
|
10.8% |
7.5% |
10.3% |
RoE |
56.3% |
32.9% |
|
39.4% |
23.4% |
26.4% |
Cash flow statement |
|
|
|
|
|
|
Operating cash flow |
1,331 |
2,869 |
|
2,365 |
2,754 |
2,786 |
Capex |
-575 |
-842 |
|
-770 |
-850 |
-700 |
Other FCF |
508 |
-311 |
|
-65 |
0 |
0 |
FCF |
1,264 |
1,717 |
|
1,530 |
1,904 |
2,086 |
Equity shareholders' cash |
201 |
1,072 |
|
1,062 |
1,372 |
1,597 |
Dividends and share buy backs |
-250 |
-299 |
|
-396 |
-327 |
-400 |
Surplus (deficit) cash |
-49 |
773 |
|
666 |
1,045 |
1,197 |
Cash flow ratios |
|
|
|
|
|
|
Working capital days |
77 |
64 |
|
81 |
74 |
72 |
Cash conversion |
0.2x |
0.9x |
|
0.6x |
1.0x |
0.9x |
FCF yield |
9.3% |
10.4% |
|
12.0% |
15.5% |
18.8% |
Equity shareholders' yield |
3.8% |
12.2% |
|
18.4% |
21.6% |
25.1% |
Capex/(EBITDA+Norilsk dividends) |
32.3% |
26.0% |
|
24.3% |
32.5% |
21.9% |
Valuation |
|
|
|
|
$mn |
|
SoTP DCF valuation and calculation of target price |
|
|
|
HKD/sh |
||
Aluminium |
|
|
|
|
10,901 |
5.6 |
Norilsk Nickel |
|
|
|
|
8,493 |
4.4 |
Total enterprise value |
|
|
|
|
19,394 |
10.0 |
Net debt as at 31 December 2017 |
|
|
|
|
-7,648 |
-3.9 |
Cash used in share buy-backs |
|
|
|
|
0 |
0.0 |
Other investments |
|
|
|
|
-50 |
-0.0 |
Minority interest |
|
|
|
|
0 |
0.0 |
Equity value as at 4/2/2019 |
|
|
|
|
11,696 |
6.0 |
TP |
|
|
|
|
|
6.0 |
Share price on 1/2/2019 |
|
|
|
|
|
3.3 |
Expected share price return |
|
|
|
|
|
82.9% |
Plus: expected dividend yield |
|
|
|
|
|
5.3% |
Total implied one-year return |
|
|
|
|
|
88.2% |
Share price range, HKD: |
|
|
|
|
|
|
12-month high on 5/2/2018 |
6.0 |
12-month low on 17/4/2018 |
1.3 |
|||
Price move since high |
-45.5% Price move since low |
|
150.4% |
|||
Calculation of discount rate |
|
|
|
|
|
|
WACC |
12.5% |
Cost of debt |
|
|
6.0% |
|
Risk-free rate |
4.0% |
Tax rate |
|
|
15% |
|
Equity risk premium |
8.0% After-tax cost of debt |
|
5.1% |
|||
Beta |
1.30 |
Debt weighting |
|
20% |
||
Cost of equity |
14.4% |
Terminal growth rate |
|
2.0% |
||
Valuation ratios |
|
|
|
|
|
|
Dec-YE |
2016 |
2017 |
|
2018E |
2019E |
2020E |
P/E multiple |
4.4x |
7.2x |
|
3.0x |
4.7x |
3.4x |
Dividend yield |
4.8% |
3.4% |
|
6.9% |
5.1% |
6.3% |
EV/(EBITDA+Equity income) |
5.8x |
6.0x |
|
3.9x |
4.7x |
3.5x |
P/B |
1.8x |
2.0x |
|
1.1x |
1.0x |
0.8x |
NAV per share, USc |
19.7 |
29.2 |
|
34.8 |
41.6 |
51.2 |
NAV per share, HKD |
1.5 |
2.3 |
|
2.7 |
3.3 |
4.0 |
Source: Bloomberg, Thomson Reuters, Company data, Renaissance Capital estimates
55
vk.com/id446425943
South32 – HOLD
Renaissance Capital
6 February 2019
Metals & Mining
Figure 89: South32, $mn (unless otherwise noted) |
|
|
|
|
|
|
|
|
|
|
|
|
|||
South32 (Pro forma historic financials) |
|
S32J.J |
|
|
|
|
|
TP, ZAR: |
|
|
|
|
37.0 |
||
Market capitalisation, $mn: |
|
|
|
12,674 |
|
|
|
|
|
Share price, ZAR: |
|
|
33.9 |
||
Enterprise value, $mn: |
|
|
|
10,359 |
|
|
|
|
|
Potential 12-month return: |
|
15.7% |
|||
|
|
|
|
|
|
|
|
|
|
|
|
|
|
|
|
Jun-YE |
|
|
2017 |
2018 |
2019E |
2020E |
2021E |
Jun-YE |
2017 |
2018 |
|
2019E |
2020E |
2021E |
|
Income statement |
|
|
|
|
|
|
|
|
Balance sheet |
|
|
|
|
|
|
Revenue |
|
|
6,950 |
7,549 |
7,342 |
7,641 |
7,853 |
|
Net operating assets |
8,027 |
7,977 |
|
9,031 |
8,916 |
8,934 |
Underlying EBITDA |
|
|
2,411 |
2,516 |
2,348 |
2,173 |
2,167 |
|
Rehab provision net of investments |
568 |
691 |
|
705 |
719 |
734 |
Underlying EBIT |
|
|
1,648 |
1,774 |
1,588 |
1,384 |
1,385 |
|
Equity |
10,236 |
10,710 |
|
10,655 |
10,845 |
11,031 |
Net interest |
|
|
-171 |
-100 |
-96 |
-93 |
-80 |
|
Minority interest |
-1 |
-1 |
|
-1 |
-1 |
-1 |
Taxation |
|
|
-393 |
-287 |
-366 |
-306 |
-316 |
|
Net debt (cash) |
-1,640 |
-2,041 |
|
-919 |
-1,209 |
-1,362 |
Minority interest in profit |
|
|
0 |
0 |
0 |
0 |
0 |
|
|
|
|
|
|
|
|
Attributable profit |
|
|
1,231 |
1,332 |
1,125 |
985 |
989 |
|
Balance sheet ratios |
|
|
|
|
|
|
Underlying earnings |
|
|
1,146 |
1,327 |
1,125 |
985 |
989 |
|
Gearing (net debt/(net debt+equity)) |
-19.1% |
-23.5% |
|
-9.4% |
-12.5% |
-14.1% |
Underlying EPS, USc |
|
|
21.6 |
25.7 |
22.3 |
19.9 |
19.9 |
|
Net debt to EBITDA |
-0.7x |
-0.8x |
|
-0.4x |
-0.6x |
-0.6x |
|
|
|
RoCE |
15.7% |
17.3% |
|
14.6% |
12.2% |
12.3% |
||||||
Thomson Reuters consensus, USc |
|
|
|
24.2 |
24.3 |
23.1 |
|
RoIC (after tax) |
15.1% |
15.5% |
|
12.5% |
8.9% |
9.2% |
|
DPS declared, USc |
|
|
10.0 |
13.5 |
17.8 |
15.9 |
15.9 |
|
RoE |
12.5% |
12.7% |
|
10.5% |
9.2% |
9.0% |
Underlying EBIT |
|
|
|
|
|
|
|
|
Cash flow statement |
|
|
|
|
|
|
Aluminium |
|
|
520 |
870 |
838 |
797 |
811 |
|
Operating cash flow |
2,350 |
2,015 |
|
2,278 |
1,753 |
1,793 |
EBIT margin |
|
|
16% |
21% |
21% |
19% |
19% |
|
Capex (net of disposals) |
-316 |
-430 |
|
-2,142 |
-588 |
-767 |
Manganese |
|
|
577 |
837 |
738 |
461 |
421 |
|
Other cash flow |
162 |
-29 |
|
0 |
0 |
0 |
EBIT margin |
|
|
46% |
52% |
46% |
34% |
30% |
|
FCF |
2,196 |
1,556 |
|
136 |
1,165 |
1,026 |
Nickel |
|
|
-16 |
120 |
-7 |
30 |
51 |
|
Equity shareholders' cash |
1,783 |
1,363 |
|
58 |
1,086 |
956 |
EBIT margin |
|
|
-4% |
21% |
-1% |
6% |
9% |
|
Dividends and share buy backs |
-455 |
-962 |
|
-1,180 |
-795 |
-803 |
Cannington |
|
|
308 |
183 |
82 |
136 |
168 |
|
Excess cash |
1,328 |
401 |
|
-1,122 |
290 |
153 |
EBIT margin |
|
|
40% |
31% |
16% |
25% |
28% |
|
Cash flow ratios |
|
|
|
|
|
|
Energy Coal South Africa |
|
|
212 |
276 |
183 |
195 |
178 |
|
|
|
|
|
|
|
|
EBIT margin |
|
|
19% |
20% |
15% |
14% |
13% |
|
Working capital days |
38 |
46 |
|
40 |
41 |
41 |
Illawarra Metallurgical Coal |
|
|
358 |
-62 |
200 |
78 |
52 |
|
Capex/EBITDA |
15.1% |
21.2% |
|
110.5% |
30.9% |
40.0% |
EBIT margin |
|
|
32% |
-9% |
19% |
8% |
5% |
|
FCF yield |
26.4% |
13.7% |
|
1.2% |
10.2% |
9.1% |
Other |
|
|
-311 |
-450 |
-447 |
-313 |
-296 |
|
Equity shareholders' yield |
17.9% |
10.2% |
|
0.5% |
8.6% |
7.5% |
Underlying EBIT |
|
|
1,648 |
1,774 |
1,588 |
1,384 |
1,385 |
|
Cash conversion |
1.6x |
1.0x |
|
0.1x |
1.1x |
1.0x |
Income statement ratios |
|
|
|
|
|
|
|
|
Capital returns/market cap |
4.6% |
7.2% |
|
9.3% |
6.3% |
6.3% |
|
|
|
|
|
|
|
|
Valuation |
|
|
|
|
|
|
|
EBITDA margin |
|
|
35% |
33% |
32% |
28% |
28% |
|
|
|
|
|
|
|
|
EBIT margin |
|
|
24% |
23% |
22% |
18% |
18% |
|
Calculation of TP |
|
|
|
|
$mn |
ZAR/sh |
EPS growth |
|
|
731% |
19% |
-13% |
-11% |
0% |
|
Aluminium |
|
|
|
|
6,831 |
19.6 |
Dividend payout ratio |
|
|
46% |
53% |
80% |
80% |
80% |
|
Manganese |
|
|
|
|
1,802 |
5.2 |
Input assumptions |
|
|
|
|
|
|
|
|
Nickel |
|
|
|
|
450 |
1.3 |
|
|
|
|
|
|
|
|
Cannington |
|
|
|
|
682 |
2.0 |
|
Aluminium, $/t |
|
|
1,772 |
2,133 |
1,946 |
2,071 |
2,228 |
|
Hermosa |
|
|
|
|
324 |
0.9 |
Manganese ore (44%, CIF China), $/mtu |
|
5.72 |
6.79 |
6.32 |
5.24 |
5.41 |
|
Energy Coal South Africa |
|
|
|
|
511 |
1.5 |
|
Silver, $/oz |
|
|
18 |
17 |
15 |
18 |
18 |
|
Illawarra Metallurgical Coal |
|
|
|
|
671 |
1.9 |
Hard coking coal, $/t |
|
|
190 |
200 |
196 |
166 |
157 |
|
Corporate and other |
|
|
|
|
-791 |
-2.3 |
$/AUD |
|
|
0.75 |
0.78 |
0.72 |
0.75 |
0.80 |
|
Enterprise value as at 4-2-2019 |
|
|
|
|
10,480 |
30.1 |
Required breakeven price |
|
|
|
|
|
|
|
|
Investments as at 30 June 2018 |
|
|
|
|
691 |
2.0 |
|
|
|
|
|
|
|
|
Cash used in share buy-backs during 2019E |
|
|
|
-379 |
-1.1 |
||
Aluminium, $/t |
|
|
1,389 |
1,747 |
1,648 |
1,651 |
1,687 |
|
Net cash (debt) as at 30 June 2018 |
|
|
|
|
2,041 |
5.9 |
Manganese ore, $/dmtu |
|
|
2.36 |
2.96 |
3.14 |
3.07 |
3.25 |
|
Equity value as at 2-9-2016 |
|
|
|
|
12,833 |
36.8 |
Silver, $/oz |
|
|
-2.34 |
1.90 |
8.02 |
5.68 |
3.54 |
|
|
|
|
|
|
|
|
|
|
Rounded to |
|
|
|
|
|
37.0 |
|||||||
Metallurgical coal, $/t |
|
|
117 |
208 |
142 |
139 |
135 |
|
Share price on 1/2/2019 |
|
|
|
|
|
33.9 |
Sales volumes (South32's share) |
|
|
|
|
|
|
|
Expected share price return |
|
|
|
|
|
9.0% |
|
|
|
|
|
|
|
|
Plus: expected dividend yield |
|
|
|
|
|
6.7% |
||
Aluminium, kt |
|
|
986 |
985 |
983 |
988 |
988 |
|
Total implied one-year return |
|
|
|
|
|
15.7% |
Silver, mn oz |
|
|
16 |
12 |
12 |
12 |
12 |
|
|
|
|
|
|
|
|
Metallurgical coal, mnt |
|
|
6.0 |
2.9 |
5.1 |
5.8 |
6.0 |
|
Share price range, ZAR: |
|
|
|
|
|
|
Manganese ore (Samancor total), mnt |
|
8.5 |
9.0 |
8.6 |
9.0 |
9.0 |
|
12-month high on 4/10/2018 |
45 |
12-month low on 22/2/2018 |
28 |
||||
Attributable Cu eq volumes, kt |
|
1,282 |
1,217 |
1,231 |
1,284 |
1,286 |
|
Price move since high |
-24.2% |
Price move since low |
|
22.5% |
|||
Volume growth |
|
|
-6.7% |
-5.1% |
1.2% |
4.3% |
0.1% |
|
Calculation of discount rate |
|
|
|
|
|
|
|
|
|
|
|
|
|
|
|
|
|
|
|
|
|
|
Contribution to FY19E underlying EBITDA |
|
|
|
|
|
|
WACC |
10.3% |
Cost of debt |
|
|
4.0% |
|||
|
Illawarra |
|
|
|
|
|
|
Risk-free rate |
4.0% |
Tax rate |
|
|
30% |
||
|
|
|
|
|
|
|
Equity risk premium |
5.5% |
After-tax cost of debt |
|
2.8% |
||||
|
Metallurgical Coal |
|
|
|
Aluminium |
|
|
Beta |
1.30 |
Debt weighting |
|
10% |
|||
Cannington |
14% |
|
|
|
|
|
|
|
|||||||
|
|
|
|
|
|
Cost of equity |
11.2% |
Terminal growth rate |
|
2.0% |
|||||
|
|
|
|
|
41% |
|
|
|
|||||||
Energy Coal South 5% |
|
|
|
|
|
|
|
|
Valuation ratios |
|
|
|
|
|
|
Africa |
|
|
|
|
|
|
|
|
|
|
|
|
|
|
|
8% |
|
|
|
|
|
|
|
|
Jun-YE |
2017 |
2018 |
|
2019E |
2020E |
2021E |
|
|
|
|
|
|
|
|
|
P/E multiple |
8.8x |
10.2x |
|
11.4x |
12.8x |
12.8x |
Nickel |
|
|
|
|
|
|
|
|
Dividend yield |
5.2% |
5.2% |
|
7.0% |
6.2% |
6.2% |
3% |
|
|
|
|
|
|
|
|
Capital returns/market cap |
4.6% |
7.2% |
|
9.3% |
6.3% |
6.3% |
|
|
|
|
|
|
|
|
|
EV/EBITDA |
3.4x |
4.5x |
|
5.0x |
5.3x |
5.2x |
|
Manganese |
|
|
|
|
|
|
P/B |
1.0x |
1.3x |
|
1.2x |
1.2x |
1.1x |
|
|
|
|
|
|
|
|
NAV per share, $ |
2.0 |
2.1 |
|
2.1 |
2.2 |
2.2 |
||
|
29% |
|
|
|
|
|
|
|
NAV per share, ZAR |
27 |
27 |
|
31 |
31 |
31 |
|
|
|
|
|
|
|
|
|
|
||||||
Source: Bloomberg, Thomson Reuters, Company data, Renaissance Capital estimates
56