

vk.com/id446425943
Acron – HOLD
Renaissance Capital
6 February 2019
Metals & Mining
Figure 102: Acron, RUBmn (unless otherwise noted)
|
|
|
|
|
|
|
|
|
|
|
|
|
|
Acron |
|
AKRN.MM |
|
|
|
|
|
Target price, RUB: |
|
|
4,600 |
||
Market capitalisation, RUBmn: |
|
189,569 |
|
|
|
|
|
Share price, RUB: |
|
|
4,670 |
||
Enterprise value, RUBmn: |
|
270,446 |
|
|
|
|
|
Potential 12-month return: |
|
5.4% |
|||
|
|
|
|
|
|
|
|
|
|
|
|
|
|
Dec-YE |
2016 |
2017 |
2018E |
2019E |
2020E |
Dec-YE |
2016 |
2017 |
|
2018E |
2019E |
2020E |
|
Income statement |
|
|
|
|
|
|
Balance sheet |
|
|
|
|
|
|
Revenue |
89,359 |
94,342 |
109,410 |
121,593 |
135,403 |
|
Net operating assets |
142,971 |
154,536 |
|
155,994 |
162,006 |
170,645 |
EBITDA |
29,856 |
29,817 |
38,228 |
44,623 |
50,511 |
|
Investments, net of rehab provision |
-3,266 |
-3,359 |
|
-2,394 |
-2,394 |
-2,394 |
Underlying EBIT |
23,761 |
21,860 |
28,936 |
34,642 |
39,589 |
|
Equity |
67,156 |
70,300 |
|
58,296 |
67,526 |
80,069 |
Other items |
-2,863 |
-683 |
-72 |
0 |
0 |
|
Minority interest |
20,566 |
20,656 |
|
20,668 |
20,904 |
21,180 |
Net interest |
3,814 |
-3,752 |
-8,156 |
-5,130 |
-5,190 |
|
Net debt |
51,983 |
60,221 |
|
74,636 |
71,182 |
67,003 |
Taxation |
-5,962 |
-3,500 |
-4,327 |
-5,902 |
-6,880 |
|
Balance sheet ratios |
|
|
|
|
|
|
Minority interest in profit |
630 |
-828 |
-718 |
-1,180 |
-1,376 |
|
|
|
|
|
|
|
|
Net profit for the year |
26,155 |
13,432 |
13,748 |
22,429 |
26,143 |
|
Gearing (net debt/(net debt+equity)) |
43.6% |
46.1% |
|
56.1% |
51.3% |
45.6% |
Basic EPS, RUB |
656 |
339 |
350 |
571 |
666 |
|
Net debt to EBITDA |
1.7x |
2.0x |
|
2.0x |
1.6x |
1.3x |
|
RoCE |
15.0% |
14.2% |
|
18.0% |
20.9% |
22.9% |
||||||
Thomson Reuters consensus EPS, RUB |
|
|
394 |
484 |
534 |
|
RoIC (after tax) |
13.1% |
11.1% |
|
14.7% |
16.9% |
18.5% |
DPS declared, RUB |
335 |
330 |
337 |
336 |
346 |
|
RoE |
34.4% |
19.5% |
|
21.4% |
35.7% |
35.4% |
Thomson Reuters consensus DPS, RUB |
|
|
312 |
325 |
352 |
|
Cash flow statement |
|
|
|
|
|
|
Income statement ratios |
|
|
|
|
|
|
|
|
|
|
|
|
|
|
|
|
|
|
|
Operating cash flow |
28,116 |
23,004 |
|
27,836 |
37,856 |
40,212 |
|
EBITDA margin |
33% |
32% |
35% |
37% |
37% |
|
Capex (net of disposals) |
-12,128 |
-11,299 |
|
-14,531 |
-16,155 |
-17,180 |
EBIT margin |
27% |
23% |
26% |
28% |
29% |
|
Other cash flows |
-5,812 |
-2,534 |
|
-6,305 |
0 |
0 |
EPS Growth |
79% |
-48% |
3% |
63% |
17% |
|
Free cash flow |
10,176 |
9,171 |
|
7,000 |
21,701 |
23,033 |
Dividend payout ratio (previous year) |
91% |
50% |
99% |
96% |
61% |
|
Equity shareholders' cash |
15,127 |
6,144 |
|
-774 |
16,653 |
17,780 |
Input assumptions |
|
|
|
|
|
|
Dividends and share buy-backs |
-13,787 |
-14,382 |
|
-13,641 |
-13,200 |
-13,600 |
67 |
58 |
63 |
67 |
68 |
|
Surplus (deficit) cash |
1,340 |
-8,238 |
|
-14,415 |
3,453 |
4,180 |
|
RUB/$ |
|
Cash flow ratios |
|
|
|
|
|
|
|||||
Black sea 16-16-16, $/t |
324 |
321 |
318 |
340 |
347 |
|
|
|
|
|
|
|
|
Black sea ammonia, $/t |
235 |
271 |
293 |
303 |
322 |
|
Working capital turnover, days |
45 |
54 |
|
64 |
58 |
59 |
Baltic sea Urea granular, $/t |
202 |
220 |
251 |
263 |
269 |
|
FCF yield |
4.8% |
4.2% |
|
2.6% |
7.9% |
8.5% |
MOP Potash FOB Saskatchewan, $/t |
228 |
230 |
261 |
289 |
283 |
|
Equity shareholders' yield |
10.7% |
4.5% |
|
-0.4% |
9.1% |
9.7% |
Sales volumes, kt |
|
|
|
|
|
|
Capex/EBITDA |
40.6% |
37.9% |
|
38.0% |
36.2% |
34.0% |
339 |
260 |
270 |
414 |
584 |
|
Cash conversion |
0.6x |
0.5x |
|
-0.1x |
0.7x |
0.7x |
|
Apetite |
|
Valuation |
|
|
|
|
|
|
|||||
Ammonia |
269 |
556 |
418 |
322 |
475 |
|
|
|
|
|
|
|
|
Ammonium nitrate |
1,527 |
1,233 |
1,387 |
1,224 |
1,224 |
|
DCF fair value and calculation of target price |
|
|
|
RUBmn |
RUB/sh |
|
Urea |
299 |
450 |
413 |
592 |
654 |
|
Operating value |
|
|
|
|
254,859 |
6,484 |
Urea-ammonium nitrate |
935 |
1,036 |
1,312 |
1,400 |
1,400 |
|
Financial instruments and rehab provision as at 31 December 2017 |
|
-3,359 |
-85 |
|||
NPK |
1,953 |
2,076 |
2,284 |
2,112 |
2,112 |
|
Enterprise value |
|
|
|
|
251,500 |
6,399 |
Bulk blends |
107 |
685 |
222 |
400 |
400 |
|
Net debt as at 31 December 2017 |
|
|
|
|
-60,221 |
-1,532 |
Industrial products |
923 |
984 |
1,031 |
1,025 |
1,025 |
|
Minority interest |
|
|
|
|
-20,656 |
-546 |
Total merchant sales |
6,352 |
7,279 |
7,336 |
7,488 |
7,874 |
|
Cash used in share buy-backs during 2018E |
|
|
|
-369 |
-9 |
|
Volume growth |
13.4% |
14.6% |
0.8% |
2.1% |
5.2% |
|
Market value of investment in Grupa Azoty |
|
|
|
|
12,837 |
327 |
|
|
|
|
|
|
|
Equity value |
|
|
|
|
183,091 |
4,638 |
|
|
|
|
|
|
|
Rounded to |
|
|
|
|
|
4,600 |
|
|
|
|
|
|
|
Share price on 1/2/2019 |
|
|
|
|
|
4,670 |
|
|
|
|
|
|
|
Expected share price return |
|
|
|
|
|
-1.5% |
|
|
|
|
|
|
|
Plus: expected dividend yield |
|
|
|
|
|
6.9% |
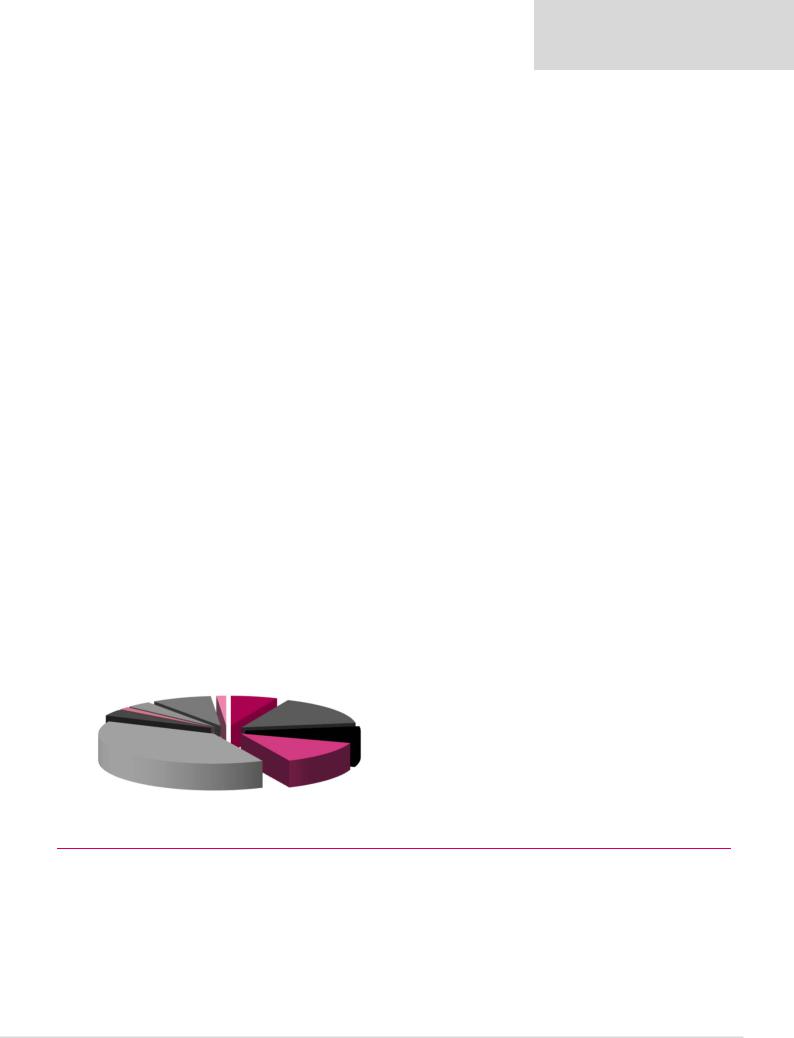
Contribution to FY18E revenue |
|
|
|
|
|
|
Total implied one-year return |
|
|
|
|
|
5.4% |
|
|
|
|
|
|
|
|
|
|
|
|
|
|
Trading |
Logistics and other |
Ammonia |
|
Phosrock 4% |
Industrial products |
1% |
|
8% |
|
7% |
|
1% |
|
|
AN |
Bulk blends |
|
|
|
3% |
|
|
16% |
Urea
8%
NPK |
UAN |
|
13% |
||
39% |
||
|
Share price range, RUB: |
4,817 |
|
|
|
|
3,715 |
12-month high on 20-9-2018 |
12-month low on 10-4-2018 |
|||||
Price move since high |
-3.1% |
Price move since low |
|
25.7% |
||
Calculation of WACC |
|
|
|
|
|
|
WACC |
13.0% |
Cost of debt |
|
|
7.0% |
|
Risk-free rate |
7.0% |
Tax rate |
|
|
20% |
|
Equity risk premium |
6.0% |
After-tax cost of debt |
|
1.1% |
||
Beta |
1.30 |
Debt weighting |
|
20% |
||
Cost of equity |
14.8% |
Terminal growth rate |
|
4.0% |
||
Valuation ratios |
|
|
|
|
|
|
Dec-YE, RUBmn |
2016 |
2017 |
|
2018E |
2019E |
2020E |
P/E multiple |
5.4x |
10.1x |
|
8.7x |
8.2x |
7.0x |
Dividend yield |
9.5% |
9.6% |
|
7.7% |
7.2% |
7.4% |
EV/EBITDA |
7.1x |
7.2x |
|
7.0x |
6.2x |
5.4x |
P/B |
2.1x |
1.9x |
|
3.0x |
2.7x |
2.3x |
NAV per share, RUB |
1,687 |
1,785 |
|
1,483 |
1,718 |
2,037 |
NAV per share, USc |
2,518 |
3,060 |
|
2,363 |
2,564 |
2,996 |
Source: Bloomberg, Thomson Reuters, Company data, Renaissance Capital estimates
69