


vk.com/id446425943
Reporting trends: 2H18E vs 2H17
We forecast the following sector trends compared with 2H17:
▪Production to remain flat as miners continue to favour value over volume.
▪Growth in underlying earnings, as margins recover owing to higher commodity prices, weaker producer currencies and continued cost-containment efforts.
▪Capex to increase by 32% ($6.1bn which excludes BHP’s and Rio Tinto’s proceeds on asset disposals) as miners start to spend on replacement projects.
▪Net debt to decline by 17% ($18.8bn) due to strong FCF generation.
▪Dividends declared to increase by 50% ($8bn) now that balance sheets are comfortable and cash generation remains strong.
Renaissance Capital
6 February 2019
Metals & Mining
Figure 6: 2H18E vs 2H17, $mn
|
Underlying earnings, $mn |
Dividends, $mn |
Cu. Eq production, kt |
Capex, $mn |
|
Net debt, $mn |
|||||||||
|
2H18E |
2H17 |
% ch |
2H18E |
2H17 |
% ch |
2H18E |
2H17 |
% ch |
2H18E |
2H17 |
% ch |
2H18E |
2H17 |
% ch |
Diversified miners |
|
|
|
|
|
|
|
|
|
|
|
|
|
|
|
African Rainbow Minerals |
193 |
146 |
33% |
94 |
36 |
165% |
142 |
151 |
-6% |
117 |
94 |
25% |
-121 |
82 |
-247% |
Alrosa |
657 |
512 |
28% |
1,247 |
0 |
- |
676 |
661 |
2% |
299 |
237 |
26% |
727 |
1,466 |
-50% |
Anglo American |
1,754 |
1,736 |
1% |
702 |
689 |
2% |
1,391 |
1,492 |
-7% |
1,048 |
1,419 |
-26% |
3,090 |
4,501 |
-31% |
Assore |
197 |
181 |
9% |
138 |
104 |
32% |
112 |
110 |
1% |
10 |
12 |
-22% |
-705 |
-492 |
-43% |
BHP |
3,926 |
4,097 |
-4% |
8,113 |
2,928 |
177% |
2,940 |
3,101 |
-5% |
3,972 |
2,583 |
54% |
10,316 |
15,411 |
-33% |
Exxaro |
318 |
-92 |
447% |
106 |
310 |
-66% |
249 |
277 |
-10% |
333 |
-260 |
228% |
288 |
293 |
-1% |
Fortescue |
544 |
681 |
-20% |
308 |
267 |
15% |
814 |
832 |
-2% |
270 |
413 |
-35% |
2,921 |
3,289 |
-11% |
Glencore |
3,024 |
3,161 |
-4% |
4,148 |
2,853 |
45% |
2,628 |
2,281 |
15% |
5,624 |
2,555 |
120% |
36,203 |
32,898 |
10% |
Kumba Iron Ore |
472 |
382 |
23% |
520 |
360 |
44% |
182 |
195 |
-7% |
167 |
149 |
12% |
-954 |
-1,035 |
8% |
Norilsk Nickel |
1,728 |
1,211 |
43% |
1,857 |
674 |
176% |
767 |
751 |
2% |
1,114 |
1,291 |
-14% |
7,466 |
8,201 |
-9% |
Rio Tinto |
4,263 |
4,686 |
-9% |
2,502 |
3,158 |
-21% |
3,090 |
3,149 |
-2% |
3,566 |
2,938 |
21% |
1,151 |
3,845 |
-70% |
Rusal |
965 |
752 |
28% |
396 |
299 |
33% |
741 |
773 |
-4% |
353 |
521 |
-32% |
7,093 |
7,648 |
-7% |
South32 |
611 |
544 |
12% |
485 |
378 |
28% |
598 |
591 |
1% |
1,741 |
199 |
775% |
-1,101 |
-1,431 |
23% |
Vale |
4,264 |
4,141 |
3% |
0 |
1,469 |
-100% |
2,824 |
2,765 |
2% |
1,886 |
2,001 |
-6% |
8,778 |
18,161 |
-52% |
Total – diversifieds |
22,915 |
22,139 |
4% |
20,617 |
13,525 |
52% |
17,153 |
17,127 |
0% |
20,501 |
14,152 |
45% |
75,152 |
92,837 |
-19% |
Platinum miners |
|
|
|
|
|
|
|
|
|
|
|
|
|
|
|
Anglo American Platinum |
342 |
234 |
46% |
103 |
70 |
47% |
303 |
296 |
3% |
254 |
229 |
11% |
-57 |
137 |
-142% |
Impala |
75 |
-11 |
771% |
0 |
0 |
- |
201 |
197 |
2% |
165 |
160 |
3% |
246 |
382 |
-36% |
Northam |
-1 |
-21 |
95% |
0 |
0 |
- |
75 |
41 |
85% |
65 |
190 |
-66% |
884 |
785 |
13% |
Royal Bafokeng Platinum |
4 |
10 |
-63% |
0 |
0 |
- |
26 |
28 |
-8% |
126 |
98 |
28% |
71 |
-30 |
339% |
Total – platinum |
420 |
212 |
98% |
103 |
70 |
47% |
605 |
562 |
8% |
610 |
677 |
-10% |
1,144 |
1,273 |
-10% |
Gold miners |
|
|
|
|
|
|
|
|
|
|
|
|
|
|
|
AngloGold Ashanti |
140 |
102 |
37% |
31 |
21 |
46% |
351 |
398 |
-12% |
436 |
499 |
-13% |
1,759 |
2,001 |
-12% |
Gold Fields |
73 |
63 |
16% |
22 |
30 |
-28% |
190 |
221 |
-14% |
402 |
447 |
-10% |
1,523 |
1,303 |
17% |
Harmony |
91 |
74 |
23% |
12 |
12 |
7% |
143 |
109 |
32% |
180 |
191 |
-6% |
317 |
113 |
181% |
Polymetal |
289 |
259 |
12% |
150 |
129 |
16% |
191 |
179 |
7% |
180 |
261 |
-31% |
1,418 |
1,420 |
0% |
Polyus |
634 |
540 |
17% |
262 |
183 |
43% |
262 |
242 |
8% |
414 |
484 |
-15% |
3,275 |
3,077 |
6% |
Sibanye-Stillwater |
41 |
40 |
3% |
0 |
0 |
- |
278 |
303 |
-8% |
280 |
270 |
3% |
1,424 |
1,908 |
-25% |
Total – gold |
1,268 |
1,077 |
18% |
478 |
375 |
27% |
1,415 |
1,452 |
-3% |
1,892 |
2,152 |
-12% |
9,716 |
9,822 |
-1% |
Total precious metals |
1,688 |
1,290 |
31% |
580 |
445 |
30% |
2,020 |
2,014 |
0% |
2,502 |
2,829 |
-12% |
10,860 |
11,095 |
-2% |
|
|
|
|
|
|
|
|
|
|
|
|
|
|
|
|
Steel companies |
|
|
|
|
|
|
|
|
|
|
|
|
|
|
|
ArcelorMittal |
-45 |
-80 |
43% |
0 |
0 |
- |
170 |
164 |
3% |
30 |
54 |
-45% |
161 |
253 |
-36% |
Evraz |
881 |
646 |
36% |
705 |
428 |
65% |
766 |
745 |
3% |
332 |
308 |
8% |
3,645 |
3,925 |
-7% |
MMK |
650 |
654 |
-1% |
665 |
377 |
76% |
525 |
537 |
-2% |
404 |
380 |
6% |
-302 |
-12 |
-2418% |
NLMK |
1,148 |
788 |
46% |
1,133 |
851 |
33% |
809 |
831 |
-3% |
370 |
397 |
-7% |
1,015 |
923 |
10% |
Total – steel |
2,635 |
2,008 |
31% |
2,504 |
1,656 |
51% |
2,269 |
2,277 |
0% |
1,136 |
1,139 |
0% |
4,519 |
5,089 |
-11% |
Fertiliser companies |
|
|
|
|
|
|
|
|
|
|
|
|
|
|
|
Acron |
208 |
188 |
11% |
24 |
157 |
-85% |
145 |
152 |
-5% |
126 |
95 |
32% |
1,129 |
1,026 |
10% |
PhosAgro |
363 |
161 |
125% |
76 |
33 |
130% |
253 |
242 |
4% |
280 |
358 |
-22% |
1,817 |
2,044 |
-11% |
Total – fertilisers |
571 |
349 |
64% |
100 |
190 |
-47% |
397 |
394 |
1% |
406 |
454 |
-11% |
2,946 |
3,071 |
-4% |
Total metals & mining |
27,809 |
25,786 |
8% |
23,801 |
15,817 |
50% |
21,840 |
21,812 |
0% |
24,544 |
18,574 |
32% |
93,476 |
112,091 |
-17% |
Source: Company data, Renaissance Capital estimates
8
vk.com/id446425943
Renaissance Capital
6 February 2019
Metals & Mining
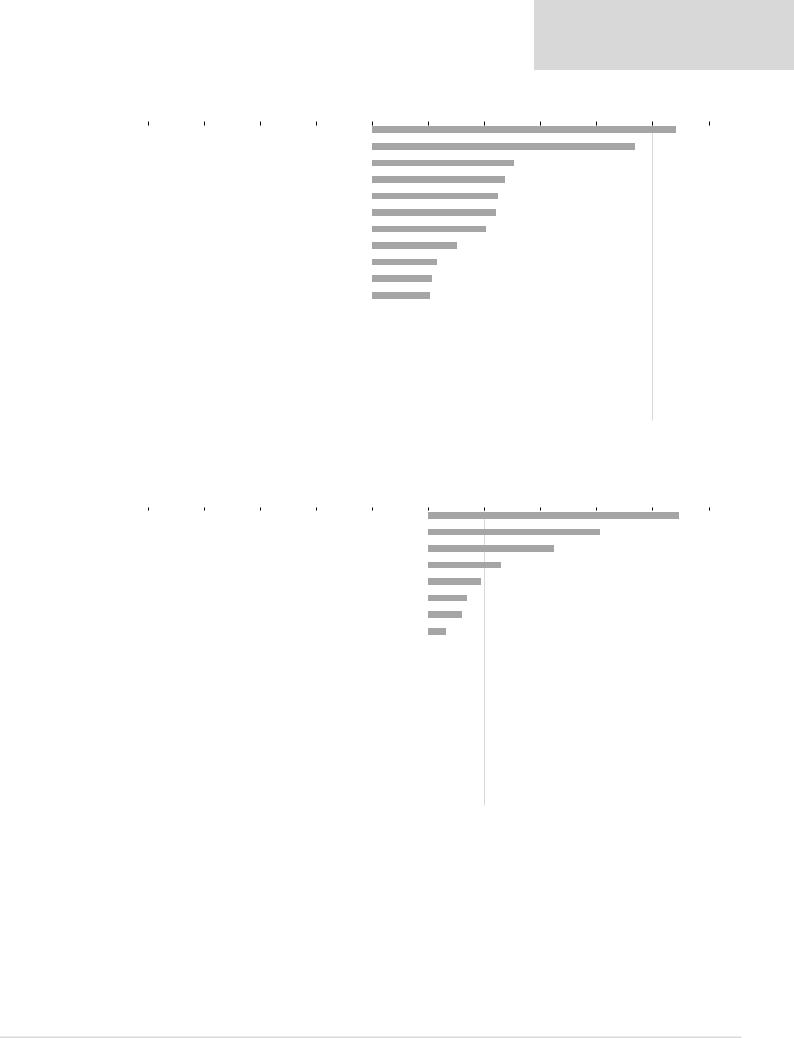
Figure 7: Commodity price and currency moves, YoY |
|
|
|
|
|
|
|
|
|
|
|
|
|
|
|
|
|
|
|
|
|
|
|
|
||||||||||
-20% |
-15% |
-10% |
|
-5% |
|
|
|
0% |
5% |
10% |
15% |
20% |
25% |
30% |
||||||||||||||||||||
Brent crude |
|
|
|
|
|
|
|
|
|
|
|
|
|
|
|
|
|
|
|
|
|
|
|
|
|
|
|
|
|
|
|
|
|
|
|
|
|
|
|
|
|
|
|
|
|
|
|
|
|
|
|
|
|
|
|
|
|
|
|
|
|
|
|
|
|
|
27% |
|
|
Freight charges |
|
|
|
|
|
|
|
|
|
|
|
|
|
|
|
|
|
|
|
|
|
|
|
|
|
|
|
|
|
|
23% |
|
|
|
RUB/$ |
|
|
|
|
|
|
|
|
|
|
|
|
|
|
|
|
|
|
|
|
|
|
|
|
|
|
13% |
|
|
|
|
|
|
|
Nickel |
|
|
|
|
|
|
|
|
|
|
|
|
|
|
|
|
|
|
|
|
|
|
|
|
|
|
12% |
|
|
|
|
|
|
|
Thermal coal |
|
|
|
|
|
|
|
|
|
|
|
|
|
|
|
|
|
|
|
|
|
|
|
|
|
|
11% |
|
|
|
|
|
|
|
Palladium |
|
|
|
|
|
|
|
|
|
|
|
|
|
|
|
|
|
|
|
|
|
|
|
|
|
|
11% |
|
|
|
|
|
|
|
Manganese ore |
|
|
|
|
|
|
|
|
|
|
|
|
|
|
|
|
|
|
|
|
|
|
|
|
|
|
10% |
|
|
|
|
|
|
|
AUD/$ |
|
|
|
|
|
|
|
|
|
|
|
|
|
|
|
|
|
|
|
|
|
|
|
|
8% |
|
|
|
|
|
|
|
|
|
$/ZAR |
|
|
|
|
|
|
|
|
|
|
|
|
|
|
|
|
|
|
|
|
|
|
|
|
6% |
|
|
|
|
|
|
|
|
|
Hard coking coal |
|
|
|
|
|
|
|
|
|
|
|
|
|
|
|
|
|
|
|
|
|
|
|
|
5% |
|
|
|
|
|
|
|
|
|
Diamonds |
|
|
|
|
|
|
|
|
|
|
|
|
|
|
|
|
|
|
|
|
|
|
|
|
5% |
|
|
|
|
|
|
|
|
|
Aluminium |
|
|
|
|
|
|
|
|
|
|
|
|
|
-2% |
|
|
|
|
|
|
|
|
|
|
|
|
|
|
|
|
|
|
||
|
|
|
|
|
|
|
|
|
|
|
|
|
|
|
|
|
|
|
|
|
|
|
|
|
|
|
|
|
|
|||||
|
|
|
|
|
|
|
|
|
|
|
|
|
|
|
|
|
|
|
|
|
|
|
|
|
|
|
|
|
|
|||||
Iron ore |
|
|
|
|
|
|
|
|
|
|
|
|
|
-3% |
|
|
|
|
|
|
|
|
|
|
|
|
|
|
|
|
|
|
||
|
|
|
|
|
|
|
|
|
|
|
|
|
|
|
|
|
|
|
|
|
|
|
|
|
|
|
|
|
|
|
||||
|
|
|
|
|
|
|
|
|
|
|
|
|
|
|
|
|
|
|
|
|
|
|
|
|
|
|
|
|
|
|
||||
Gold |
|
|
|
|
|
|
|
|
|
|
-4% |
|
|
|
|
|
|
|
|
|
|
|
|
|
|
|
|
|
|
|
|
|
||
|
|
|
|
|
|
|
|
|
|
|
|
|
|
|
|
|
|
|
|
|
|
|
|
|
|
|
|
|
|
|
||||
|
|
|
|
|
|
|
|
|
|
|
|
|
|
|
|
|
|
|
|
|
|
|
|
|
|
|
|
|
|
|
||||
Copper |
|
|
|
|
|
|
|
|
-7% |
|
|
|
|
|
|
|
|
|
|
|
|
|
|
|
|
|
|
|
|
|
|
|
|
|
|
|
|
|
|
|
|
|
|
|
|
|
|
|
|
|
|
|
|
|
|
|
|
|
|
|
|
|
|
|
|
|
|||
Platinum |
|
- |
13% |
|
|
|
|
|
|
|
|
|
|
|
|
|
|
|
|
|
|
|
|
|
|
|
|
|
|
|
|
|||
|
|
|
|
|
|
|
|
|
|
|
|
|
|
|
|
|
|
|
|
|
|
|
|
|
|
|
|
|
||||||
Lead |
|
-16% |
|
|
|
|
|
|
|
|
|
|
|
|
|
|
|
|
|
|
|
|
|
|
|
|
|
|
|
|
|
|
|
|
|
|
|
|
|
|
|
|
|
|
|
|
|
|
|
|
|
|
|
|
|
|
|
|
|
|
|
|
|
|
|
||||
Zinc |
-17% |
|
|
|
|
|
|
|
|
|
|
|
|
|
|
|
|
|
|
|
|
|
|
|
|
|
|
|
|
|
|
|
|
|
|
|
|
|
|
|
|
|
|
|
|
|
|
|
|
|
|
|
|
|
|
|
|
|
|
|
|
|
|
|
|
|
|||
|
|
|
|
|
|
|
|
|
|
|
|
|
|
|
|
|
|
|
|
|
|
|
|
|
|
|
|
|
|
|
|
|
Source: Bloomberg |
|
Figure 8: Commodity price moves, HoH |
|
|
|
|
|
|
|
|
|
|
|
|
|
|
|
|
|
|
|
|
|
|
|
|
|
|
|
|
||||||
-25% |
-20% |
-15% |
|
-10% |
|
|
|
-5% |
0% |
5% |
10% |
15% |
20% |
25% |
||||||||||||||||||||
Freight charges |
|
|
|
|
|
|
|
|
|
|
|
|
|
|
|
|
|
|
|
|
|
|
|
|
|
|
|
|
|
|
|
|
|
|
|
|
|
|
|
|
|
|
|
|
|
|
|
|
|
|
|
|
|
|
|
|
|
|
|
|
|
|
|
|
|
|
22% |
|
|
$/ZAR |
|
|
|
|
|
|
|
|
|
|
|
|
|
|
|
|
|
|
|
|
|
|
|
|
|
|
|
|
|
|
15% |
|
|
|
RUB/$ |
|
|
|
|
|
|
|
|
|
|
|
|
|
|
|
|
|
|
|
|
|
|
|
|
|
|
|
|
11% |
|
|
|
|
|
AUD/$ |
|
|
|
|
|
|
|
|
|
|
|
|
|
|
|
|
|
|
|
|
|
|
|
|
|
|
6% |
|
|
|
|
|
|
|
Palladium |
|
|
|
|
|
|
|
|
|
|
|
|
|
|
|
|
|
|
|
|
|
|
|
|
|
5% |
|
|
|
|
|
|
|
|
Diamonds |
|
|
|
|
|
|
|
|
|
|
|
|
|
|
|
|
|
|
|
|
|
|
|
|
3% |
|
|
|
|
|
|
|
|
|
Thermal coal |
|
|
|
|
|
|
|
|
|
|
|
|
|
|
|
|
|
|
|
|
|
|
|
|
3% |
|
|
|
|
|
|
|
|
|
Brent crude |
|
|
|
|
|
|
|
|
|
|
|
|
|
|
|
|
|
|
|
|
|
|
|
|
2% |
|
|
|
|
|
|
|
|
|
Hard coking coal |
|
|
|
|
|
|
|
|
|
|
|
|
|
|
|
|
|
|
|
|
-1% |
|
|
|
|
|
|
|
|
|
|
|
|
|
|
|
|
|
|
|
|
|
|
|
|
|
|
|
|
|
|
|
|
|
|
|
|
|
|
|
|
|
|
|
|
|
|||
|
|
|
|
|
|
|
|
|
|
|
|
|
|
|
|
|
|
|
|
|
|
|
|
|
|
|
|
|
|
|
|
|||
Iron ore |
|
|
|
|
|
|
|
|
|
|
|
|
|
|
|
|
|
|
|
|
-1% |
|
|
|
|
|
|
|
|
|
|
|
|
|
|
|
|
|
|
|
|
|
|
|
|
|
|
|
|
|
|
|
|
|
|
|
|
|
|
|
|
|
|
|
|
|
|
||
|
|
|
|
|
|
|
|
|
|
|
|
|
|
|
|
|
|
|
|
|
|
|
|
|
|
|
|
|
|
|
|
|
||
Manganese ore |
|
|
|
|
|
|
|
|
|
|
|
|
|
-6% |
|
|
|
|
|
|
|
|
|
|
|
|
|
|
|
|
||||
|
|
|
|
|
|
|
|
|
|
|
|
|
|
|
|
|
|
|
|
|
|
|
|
|
|
|
|
|
||||||
Gold |
|
|
|
|
|
|
|
|
|
|
|
|
|
-7% |
|
|
|
|
|
|
|
|
|
|
|
|
|
|
|
|
|
|
||
|
|
|
|
|
|
|
|
|
|
|
|
|
|
|
|
|
|
|
|
|
|
|
|
|
|
|
|
|
|
|
||||
Aluminium |
|
|
|
|
|
|
|
|
|
|
-9% |
|
|
|
|
|
|
|
|
|
|
|
|
|
|
|
|
|
|
|
|
|
||
|
|
|
|
|
|
|
|
|
|
|
|
|
|
|
|
|
|
|
|
|
|
|
|
|
|
|
|
|
|
|
||||
Nickel |
|
|
|
|
|
|
|
|
-11% |
|
|
|
|
|
|
|
|
|
|
|
|
|
|
|
|
|
|
|
|
|
|
|
||
|
|
|
|
|
|
|
|
|
|
|
|
|
|
|
|
|
|
|
|
|
|
|
|
|
|
|
|
|
|
|||||
Copper |
|
|
|
|
|
|
|
|
-11% |
|
|
|
|
|
|
|
|
|
|
|
|
|
|
|
|
|
|
|
|
|
|
|
|
|
|
|
|
|
|
|
|
|
|
|
|
|
|
|
|
|
|
|
|
|
|
|
|
|
|
|
|
|
|
|
|
|
|||
Platinum |
|
|
|
|
|
|
- |
13% |
|
|
|
|
|
|
|
|
|
|
|
|
|
|
|
|
|
|
|
|
|
|
|
|
|
|
|
|
|
|
|
|
|
|
|
|
|
|
|
|
|
|
|
|
|
|
|
|
|
|
|
|
|
|
|
|
|
||||
Lead |
|
|
|
-17% |
|
|
|
|
|
|
|
|
|
|
|
|
|
|
|
|
|
|
|
|
|
|
|
|
|
|
|
|
||
|
|
|
|
|
|
|
|
|
|
|
|
|
|
|
|
|
|
|
|
|
|
|
|
|
|
|
|
|
|
|
|
|
||
Zinc |
|
-21% |
|
|
|
|
|
|
|
|
|
|
|
|
|
|
|
|
|
|
|
|
|
|
|
|
|
|
|
|
|
|
|
|
|
|
|
|
|
|
|
|
|
|
|
|
|
|
|
|
|
|
|
|
|
|
|
|
|
|
|
|
|
|
|
|
|||
Source: Bloomberg
9