

vk.com/id446425943
Investment summary
Renaissance Capital
6 February 2019
Metals & Mining
Neutral investment stance on diversified miners
We have a neutral outlook on the metals & mining sector following strong share-price recoveries since 2016’s lows. We believe a cyclical slowdown in commodity demand could weigh on near-term prices.
We believe a potential pullback in metals & mining company share prices could present a medium-term buying opportunity, given our view that sector capex has been cut to a level that could result in supply deficits over the medium term. This could support rising commodity prices and sector returns. We believe management teams continue to focus on value-creation through productivity, cost-containment and capital efficiency rather than volume growth, which is often value-destructive.
Many miners are highly FCF-generative, despite our view that commodity prices are only around mid-cycle levels and supported by industry costs. We believe most commodity prices have not yet recovered to a level that would incentivise greenfield projects.
Given that share prices are still below 2008 levels, despite strong FCF, we calculate attractive FCF yields for many miners.
Attractive FCF yields
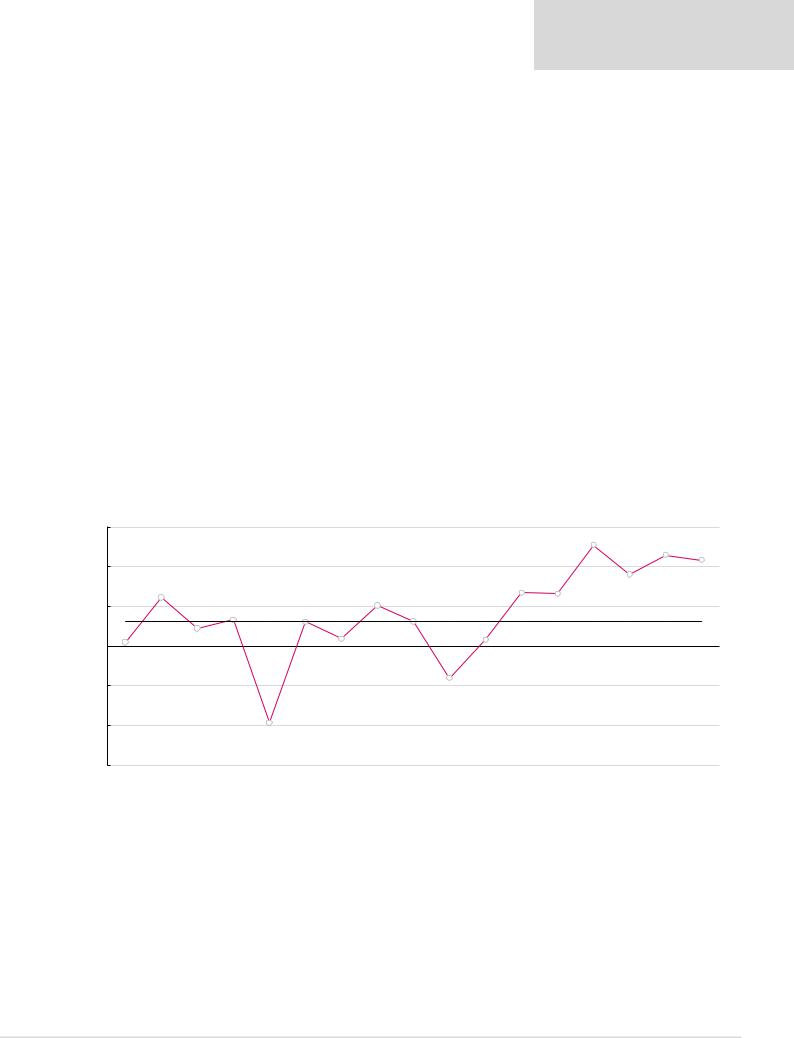
We calculate that the sector generated higher FCF yields over the past three years than anything achieved in the previous decade. Spot FCF is still at attractive levels, in our view, compared with the previous decade.
A share-price pullback could present a medium-term buying opportunity
Figure 1: Market cap-weighted FCF yield*, % per calendar year ($ terms)
15% |
|
|
|
|
|
|
|
|
|
|
|
|
13% |
|
|
|
|
|
|
|
|
|
|
|
|
|
|
|
|
|
11% |
|
|
|
|
|
|
|
|
|
|
|
|
|
|
|
|
|
11% |
|
|
|
|
|
|
|
|
|
|
|
|
|
|
|
|
|
|
10% |
|
|
|
|
|
|
|
|
|
|
|
|
|
|
|
|
|
6% |
|
|
|
|
|
|
|
|
|
7% |
|
|
|
|
|
|
|
|
|
|
|
5% |
|
|
|
|
|
|
9% |
|
|
|
|
|
|
|
|
|
|
|
|
|
|
|
|
|
|
||
5% |
|
|
3% |
|
3% |
|
|
3% |
|
|
|
7% |
Average, 2003-2017, 3.1% |
|||
|
|
|
|
|
|
|
|
|
||||||||
0% |
|
2% |
|
|
|
1% |
|
|
|
1% |
|
|
|
|
|
|
0% |
|
|
|
|
|
|
|
|
|
|
|
|
|
|
||
|
|
|
|
|
|
|
|
|
|
|
|
|
|
|
|
|
-5% |
|
|
|
|
|
|
|
|
-4% |
|
|
|
|
|
|
|
|
|
|
|
|
|
|
|
|
|
|
|
|
|
|
|
|
-10% |
|
|
|
|
|
|
|
|
|
|
|
|
|
|
|
|
|
|
|
|
-10% |
|
|
|
|
|
|
|
|
|
|
|
|
-15% |
|
|
|
|
|
|
|
|
|
|
|
|
|
|
2018E |
|
2003 |
2004 |
2005 |
2006 |
2007 |
2008 |
2009 |
2010 |
2011 |
2012 |
2013 |
2014 |
2015 |
2016 |
2017 |
Spot |
|
Note: Priced at market close on 1 February 2019.
*FCF yield is determined using equity shareholders' cash flow.
Source: Company data, Thomson Reuters Datastream, Renaissance Capital estimates
Following several years of strong cash generation, we think most balance sheets are now comfortable. We believe the sector-wide adoption of payout-ratio-based dividend policies, rather than ‘progressive dividends’, is likely to result in better capital allocation and attractive dividend yields.
We believe continued capital discipline, deleveraging and attractive dividend-paying potential could support share prices.
Attractive dividend yields likely now that balance sheets are comfortable
3

vk.com/id446425943
Earnings momentum remains positive and we calculate further upside risk to consensus earnings forecasts if spot commodity prices prevail. The biggest risks we see are a cyclical downturn in commodity prices and poor capital allocation. The key upside risks to our cashflow forecasts and valuations are stronger-than-forecast commodity prices or weaker-than- forecast producer currencies.
Renaissance Capital
6 February 2019
Metals & Mining
Positive earnings momentum
Cautious on PGM sector following margin recovery
Earnings momentum remains positive for platinum group metals (PGM) miners as commodity prices have recovered strongly. However, we see potential downside risk, as we calculate the spot PGM basket price is trading above cost support for the first time in seven years, making it more vulnerable to escalating fears of a global slowdown. Despite the recovery in sector margins, we still struggle to calculate much value in the sector and believe poor capital allocation risk could be increasing, given improving returns, healthy balance sheets, the sector’s lack of commitment towards dividends and the industry’s historical willingness to invest at value-destructive returns in the hope that PGM prices recover strongly in the medium-to-long term.
Positive earnings momentum could wane in a global economic slowdown
Preference for high-margin, capital-efficient gold miners
We maintain our preference for the Russian gold miners over their SA peers as we believe they are better positioned to create long-term value, with a track record of valueaccretive growth through prudent capital allocation and a commitment to returning cash flows to shareholders. SA gold miners, in our view, are hampered by their uncompetitive costs and capital inefficiency, which result in lower returns and increase the risk of valuedestruction if they try to maintain or grow production volumes. However, over the near term, we believe increasing geopolitical uncertainty and escalating fears of a global slowdown could continue to increase investment demand for gold as a safe-haven asset, providing some support for the price. In a rising gold-price environment, we believe the more operationally and financially geared SA-listed gold miners could outperform on positive earnings momentum.
Russian gold miners better positioned to create long-term growth relative to their South African peers
Steel companies offer attractive FCF yields
Our steel price forecasts are derived from input costs plus normalised margins, which results in what we view as attractive operating profits for the Russian steel companies under our coverage. We believe depressed capex levels – below historical averages – aid near-term cash generation. We believe the steel companies’ balance sheets are comfortable at current levels. We think the combination of supportive FCF generation and comfortable balance sheets could translate into supportive near-term dividends.
Key downside risks to our investment stance are: 1) US sanctions against Russian steel makers or the impact of sanctions on the Russian economy; 2) steel import duties and tariffs in export markets against Russian steel makers; 3) reduced cash generation, weighed down by company project investment activities and by potential governmentimposed investment projects; and 4) earnings momentum has turned negative for the steel producers we cover, which we believe could weigh on share-price performance.
We forecast supportive FCF generation and near-term dividend yields
4

vk.com/id446425943
Renaissance Capital
6 February 2019
Metals & Mining
Revisions to our forecasts; no TPs and ratings changes
We revise our earnings forecasts as we incorporate recently reported financial and production results and guidance changes.
Figure 2 shows the companies under our coverage ranked by potential 12-month returns, based on our TPs.
Figure 2: Summary sector ratings and TPs (ranked by total potential 12M return, including estimated dividends)
Company |
Unit |
12M TP |
Current |
12M target |
12M fwd |
Total 12M |
12M forward |
Rating |
|
price* |
capital return |
dividend yield |
return |
rolling P/E |
|||||
|
|
|
|
||||||
Rusal |
HKD |
6.0 |
3.3 |
82.9% |
5.3% |
88.2% |
4.5x |
BUY |
|
Evraz |
GBp |
640.0 |
507.6 |
26.1% |
14.1% |
40.2% |
6.1x |
BUY |
|
PhosAgro |
$ |
16.0 |
13.5 |
18.8% |
7.7% |
26.5% |
6.5x |
BUY |
|
Norilsk |
$ |
24.0 |
20.8 |
15.6% |
10.4% |
26.0% |
9.8x |
BUY |
|
NLMK |
$ |
27.0 |
24.0 |
12.7% |
12.9% |
25.6% |
8.4x |
BUY |
|
MMK |
$ |
10.1 |
8.6 |
16.7% |
6.8% |
23.4% |
12.4x |
BUY |
|
Alrosa |
RUB |
109.0 |
99.5 |
9.5% |
13.0% |
22.5% |
7.3x |
BUY |
|
Polyus |
RUB |
6,300.0 |
5,521.5 |
14.1% |
6.0% |
20.1% |
7.1x |
BUY |
|
Rio Tinto |
GBP |
48.0 |
42.3 |
13.5% |
6.3% |
19.8% |
9.6x |
BUY |
|
Exxaro |
ZAR |
170.0 |
156.5 |
8.6% |
9.8% |
18.4% |
5.8x |
BUY |
|
ARM |
ZAR |
160.0 |
147.3 |
8.6% |
9.6% |
18.2% |
5.9x |
BUY |
|
Impala Platinum |
ZAR |
45.0 |
38.8 |
16.1% |
0.0% |
16.1% |
8.1x |
BUY |
|
ArcelorMittal SA |
ZAR |
4.0 |
3.5 |
15.9% |
0.0% |
15.9% |
-139.9x |
HOLD |
|
South32 |
ZAR |
37.0 |
33.9 |
9.0% |
6.7% |
15.7% |
11.4x |
HOLD |
|
BHP |
ZAR |
315.0 |
297.3 |
6.0% |
9.2% |
15.2% |
11.7x |
HOLD |
|
Fortescue |
AUD |
6.0 |
5.8 |
2.7% |
8.7% |
11.4% |
7.6x |
BUY |
|
Glencore |
ZAR |
55.0 |
53.1 |
3.7% |
6.7% |
10.3% |
11.6x |
HOLD |
|
Vale |
$ |
13.6 |
12.6 |
8.2% |
0.0% |
8.2% |
6.3x |
HOLD |
|
Polymetal |
GBP |
8.6 |
8.6 |
-0.1% |
6.6% |
6.5% |
7.7x |
HOLD |
|
Acron |
RUB |
4,600.0 |
4,670.0 |
-1.5% |
6.9% |
5.4% |
7.8x |
HOLD |
|
Anglo American |
ZAR |
340.0 |
345.2 |
-1.5% |
6.0% |
4.5% |
8.9x |
HOLD |
|
Assore |
ZAR |
320.0 |
346.8 |
-7.7% |
8.6% |
0.9% |
6.6x |
HOLD |
|
Sibanye - Stillwater |
ZAR |
11.1 |
12.1 |
-8.3% |
0.2% |
-8.1% |
5.6x |
HOLD |
|
Kumba Iron Ore |
ZAR |
270.0 |
340.6 |
-20.7% |
12.3% |
-8.4% |
8.2x |
SELL |
|
RBPlats |
ZAR |
25.0 |
28.8 |
-13.0% |
0.0% |
-13.0% |
8.2x |
SELL |
|
Anglo American Platinum |
ZAR |
540.0 |
636.0 |
-15.1% |
1.9% |
-13.2% |
15.7x |
HOLD |
|
Gold Fields |
ZAR |
43.0 |
53.8 |
-20.0% |
3.2% |
-16.8% |
9.7x |
SELL |
|
Northam |
ZAR |
40.0 |
48.5 |
-17.5% |
0.0% |
-17.5% |
13.1x |
SELL |
|
Harmony |
ZAR |
21.0 |
26.9 |
-22.0% |
3.6% |
-18.5% |
4.1x |
SELL |
|
Lonmin |
ZAR |
7.0 |
9.6 |
-26.8% |
0.0% |
-26.8% |
1.7x |
SELL |
|
AngloGold |
ZAR |
110.0 |
190.0 |
-42.1% |
1.1% |
-41.0% |
8.4x |
SELL |
Note: Priced at market close on 1 February 2019.
Source: Thomson Reuters Datastream, Renaissance Capital estimates
5