

Chen The electron capture detector
.pdfDIATOMIC MOLECULES |
207 |
Figure 9.10 Predicted and experimental relative bond orders for O2( ). The predicted values were taken from [40].
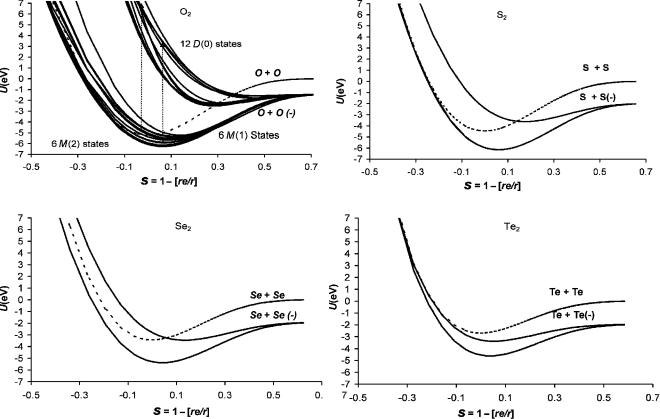
The experimental bond orders for the states of the neutral and negative ions are shown in Figure 9.10. Also shown are the bond orders of the anions predicted by simple MO theory and calculated by Michels. The bond orders of the dissociative states are zero. The predicted bond orders of the excited states can be used to define the 12 D curves relative to the 12 M curves. The bond orders for the M and D states calculated by Michels are all much lower than the values predicted by simple MO theory: 0.75 for the M states and 0.25 for the D states. The experimental bond orders for the M states are all larger than the simple MO value. The D states should have bond orders less than 0.25 but greater than zero to preserve symmetry. In Figure 9.10 we can observe the relative positions of the experimental bond orders for the M states and assumed bond orders for the D states.
The remaining 12 states are Dð0Þ because they all lead to dissociation and all three Herschbach metrics are negative. The Ea are negative, but the potential energy curves have nonzero dissociation energies. Since Ea ¼ EDEA þ D0 0:1 eV, the state with a dissociation energy of 1 eV has an Ea of 2.6(2) eV, and that with a dissociation energy of 0.1 eV, 3.5(1) eV. The observed VEa from electron impact and scattering or dissociative electron attachment on solids or liquids are 0.2, 1, 7.8, up to 11.9 eV [41]. It is important to note that the observed electron impact data can be modeled using only one upper negative-ion state. The gap between the VEa of (8 1) ¼ 7 eV is the approximate splitting of the states at the internuclear distance of the neutral. This gap has been confirmed by dissociative
208 DIATOMIC AND TRIATOMIC MOLECULES AND SULFUR FLUORIDES
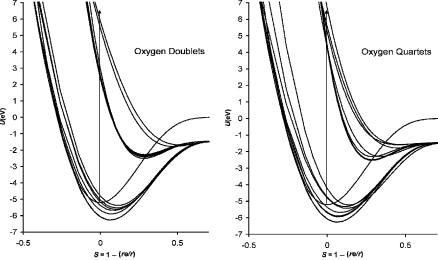
Figure 9.11 Morse potential energy curves for 24 negative-ion states of O2. The parameters used to calculate the curves and assignments are given in Table 9.4 [5].
electron attachment to the excited state of the neutral formed by application of microwave energy. The peak in the O( ) distribution for electron attachment to the excited state of the neutral is shifted by about 1 eV and a second excited state dissociating to the next highest limit is identified approximately 2 eV higher [42].
The 12 D peaks leading to the lowest limit have VEa values in the range of 8 eV to 12 eV. The lowest state in the Franck Condon region is assigned to 2 u, but several states are assigned larger dissociation energies and cross this state at larger internuclear distances to yield the same vertical energy. The published Morse parameters of the 2 u state guide the other curves [43]. The D states are assigned in the same order as the M states, but these curves are highly speculative. If the dissociative electron impact peaks were more definitively assigned the curves could be improved. The curves for all 12 states are illustrated in Figure 9.11. The doublet states are shown on one plot, while the quartet states are shown on another. The spin orbital coupling states that have been identified in both ECD and PES data are not shown. The state designations, Morse parameters, Ea, VEa, and E1 values are given in Table 9.4.
The negative-ion states of S2, Se2, and Te2 have much less data. The Ea of the Group VI molecules have been calculated using CURES-EC. The ground states for the neutrals are all triplet states. The ZINDO method gives the best agreement with experiment for O2 with a s constant of 1.0 and a p constant of 0.15. The ZINDO(7100) and ZINDO(5100) values are 1.08 eV and 0.5 eV, respectively. The higher value corresponds to the AEa. The PM3(7100) and PM3(0000) values are 0.7 eV and 0.4 eV. The PM3(7100) values for the others are S2, 1.7 eV; Se2, 1.9 eV, and Te2, 2.1 eV; these are in agreement with experiment. Several photoelectron spectra have been obtained for S2. The most recent has the highest resolution.
DIATOMIC MOLECULES |
209 |
The relative bond orders for the remaining Group VI homonuclear diatomic molecules are larger than 0.75 and approach 1 for Se2( ) and Te2( ). The Morse parameters for the ground-state anions are very similar to those for O2( ). The 2 u anion states characterized by electronic spectra for the higher members of the Group VI family are M states. These are Mð0Þ states for S2 and Se2, but the curve for Te2 is an Mð2Þ curve because only the EDEa is negative. It also crosses the neutral on the backside. The dimensionless constants are different from those for O2( ). In addition, their relative bond orders are different going from about 0.2 in O2 to 0.6 in Te2. This increase mirrors that for the ground state since the relative bond orders for Se2( ) and Te2( ) are approximately 1, while that for O2( ) is about 0.9. There should be as many states for the isoelectronic ions as for O2( ). The consistency of the dimensionless constants for the ground-state curves, as shown in Table 9.5, supports the isoelectronic principle for the ground state, but the differences in the values for the one excited state do not justify the use of the O2( ) parameters for the other diatomic anions. The parameters for all the curves are given in Table 9.5. Since no other data are available, only two curves will be calculated for each of these anions, as shown in Figure 9.12 [44–47].
9.2.4 Electron Affinities and Morse Potential Energy Curves: Group IA and IB Homonuclear Diatomic Molecules and Anions
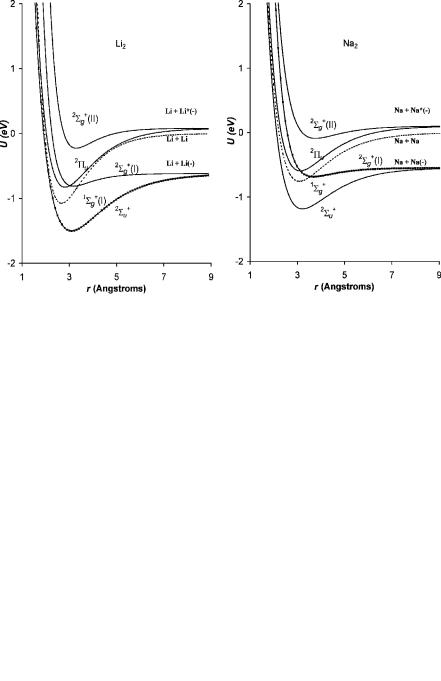
The Morse potentials for the Group IA and IB homonuclear diatomic anions can be constructed for the ground state and one excited state from experimental data. However, there is a low-lying excited state for the alkali metal and coinage metal anions. This gives two dissociation limits so there should be four low-lying states. Theoretical calculations have been carried out for these states in Li2( ) [48]. Adiabatic electron affinities have been measured by photoelectron spectroscopy. The values of the Morse parameters for the neutral have also been measured [48–53]. The Li2( ) ground-state curve is Mð2Þ with positive values for the Ea and VEa. The lower antibonding curve is Dð0Þ. The bonding curve dissociating to the higher limit is Mð0Þ, while the complementary antibonding curve is Dð0Þ [48].
For the higher-atomic-weight IA and IB homonuclear diatomic molecules two ‘‘bonding’’ and two antibonding curves going to two limits can be constructed by analogy to Li2( ). These are shown in Figure 9.13 for Li2 and Na2 and in Figure 9.14 for Cu2 and Au2. The Morse parameters for all the IA and IB homonuclear diatomic molecules and anions and the relative anion bond orders are given in Table 9.6. The anion curves for K2, Rb2, and Ag2 are similar to those for Na2. The ground-state curves for all but Au2 are Mð2Þ since all the EDEA are negative. They all cross on the backside of the neutral. All the bonding curves dissociating to the higher limit are Mð0Þ. All the complementary nonbonding anion curves are Dð0Þ. For all of the first excited-state curves dissociative thermal electron attachment is possible and has been observed in the case of Li2 and Na2. For Li2( )
˚ ¼
the dissociative curve crosses the neutral between 3 and 4 A at v 10 to 13 [53]. The anion curves for Au2 are unique. The two states dissociating to the lowest

210 DIATOMIC AND TRIATOMIC MOLECULES AND SULFUR FLUORIDES
TABLE 9.5 Morse Parameters and Dimensionless Constants for Diatomic Group VA Molecules and Anions
Species |
|
Do (eV) |
re (pm) |
n (cm 1) |
kA |
kB |
kR |
|||
O2 Neutral |
5.11 |
121 |
1,580 |
1.000 |
1.000 |
1.000 |
||||
4 |
|
|
|
u |
|
|
|
|
|
|
O2( |
|
) 4 |
4.6 |
129 |
1,250 |
1.080 |
0.835 |
1.298 |
||
|
g |
|
|
4.4 |
130 |
1,210 |
1.054 |
0.826 |
1.292 |
|
4 |
gþ |
|
|
4.4 |
130 |
1,210 |
1.054 |
0.826 |
1.292 |
|
4 |
u |
|
|
3.9 |
138 |
1,000 |
1.062 |
0.726 |
1.482 |
|
4 |
gþ |
|
|
3.8 |
136 |
1,089 |
1.028 |
0.800 |
1.422 |
|
4 |
u |
|
|
3.7 |
140 |
1,089 |
1.096 |
0.810 |
1.660 |
|
4 |
u |
|
|
1 |
169 |
700 |
0.713 |
0.990 |
2.537 |
|
4 |
g |
|
|
0.8 |
183 |
510 |
0.608 |
0.808 |
2.311 |
|
4 |
gþ |
|
|
0.8 |
170 |
650 |
0.617 |
1.024 |
2.356 |
|
4 |
u |
|
|
0.3 |
220 |
260 |
0.353 |
0.668 |
2.055 |
|
4 |
gþ |
|
|
0.1 |
220 |
190 |
0.189 |
0.825 |
1.664 |
|
4 |
u |
|
|
0.1 |
230 |
180 |
0.205 |
0.780 |
1.972 |
|
2 |
g |
|
|
4.7 |
129 |
1,250 |
1.105 |
0.824 |
1.325 |
|
2 |
g |
|
|
4.35 |
130 |
1,200 |
1.041 |
0.824 |
1.276 |
|
2 |
uþ |
|
|
4.15 |
132 |
1,125 |
1.027 |
0.791 |
1.302 |
|
2 |
uð1=2Þ |
4.07 |
134 |
1,125 |
1.057 |
0.798 |
1.404 |
|||
2 |
||||||||||
|
uð3=2Þ |
4.10 |
134 |
1,125 |
1.062 |
0.796 |
1.409 |
|||
2 |
gþ |
|
|
4.05 |
135 |
1,089 |
1.050 |
0.780 |
1.412 |
|
2 |
u |
|
|
3.85 |
136 |
1,089 |
1.039 |
0.795 |
1.435 |
|
2 |
g |
|
|
1.0 |
169 |
670 |
0.675 |
0.948 |
2.276 |
|
2 |
u |
|
|
0.9 |
169 |
620 |
0.582 |
0.940 |
1.942 |
|
2 |
uþ |
|
|
0.82 |
169 |
610 |
0.558 |
0.951 |
1.890 |
|
2 |
u |
|
|
0.77 |
169 |
592 |
0.525 |
0.952 |
1.780 |
|
2 |
gþ |
|
|
0.3 |
230 |
235 |
0.350 |
0.605 |
2.026 |
|
2 |
u |
|
|
0.2 |
250 |
180 |
0.283 |
0.566 |
1.973 |
|
S2 Neutral |
4.46 |
190 |
726 |
1.000 |
1.000 |
1.000 |
||||
|
|
|
2 |
|
|
|
|
|
|
|
S2( ) 2 |
g |
4.11 |
202 |
601 |
1.128 |
0.858 |
1.367 |
|||
|
|
|
|
u |
1.60 |
230 |
364 |
0.677 |
0.831 |
1.258 |
Se2 Neutral |
3.44 |
217 |
387 |
1.000 |
1.000 |
1.000 |
||||
Se2( ) |
2 |
|
|
|
|
|
|
|||
2 g |
3.43 |
226 |
330 |
1.153 |
0.853 |
1.331 |
||||
|
|
|
|
u |
1.50 |
250 |
217 |
0.730 |
0.845 |
1.210 |
Te2 Neutral |
2.69 |
256 |
247 |
1.000 |
1.000 |
1.000 |
||||
Te2( ) |
2 |
|
|
|
|
|
|
|||
2 g |
2.63 |
266 |
223 |
1.141 |
0.911 |
1.325 |
||||
|
|
|
|
u |
1.40 |
270 |
180 |
0.661 |
1.007 |
0.833 |
limit are Mð3Þ since EDEA is also positive due to the large electron affinity of the gold atom. The other curves dissociating to the higher limit are Mð0Þ and Dð0Þ, respectively.
The internuclear distances for the ground-state anions are 10% larger than the neutral, while the frequencies are 30% lower than the neutrals. The bond dissociation energies are only slightly lower in the anion than in the neutral [49–52]. The bond order varies from 0.8 to 1.0 for the bonding curves, as seen in Table 9.6. The
211
Figure 9.12 Morse potential energy curves for the neutral and negative-ion states of O2, S2, Se2, and Te2. The parameters used to calculate the curves are given in Table 9.5 [5].
212 DIATOMIC AND TRIATOMIC MOLECULES AND SULFUR FLUORIDES
Figure 9.13 Morse potential energy curves for the neutral and negative-ion states of Li2 and Na2. The parameters used to calculate the curves are given in Table 9.6.
Figure 9.14 Morse potential energy curves for the neutral and negative-ion states of Cu2 and Au2. The parameters used to calculate the curves are given in Table 9.6.

DIATOMIC MOLECULES |
213 |
TABLE 9.6 Morse Parameters and Bond Order for Homonuclear Diatomic Group IA and IB Neutral and Anions
Species |
|
|
De (eV) |
re (pm) |
n (cm 1) |
Ea þ E |
Bond Order |
||||||||
Li2 |
|
|
|
|
|
1 |
gþ |
1.054 |
267 |
351 |
|
0.00 |
1.00 |
||
|
|
|
|
|
|
u |
|
|
|
|
|
|
|||
Li2( |
|
|
|
) |
|
2 |
þ |
0.869 |
309 |
232 |
|
0.618 |
0.82 |
||
Li2( ) |
|
2 |
u(I) |
0.182 |
318 |
186 |
|
0.618 |
0.17 |
||||||
Li2( ) |
|
2 |
g(II) |
0.869 |
282 |
280 |
0.080 |
0.84 |
|||||||
|
|
|
|
|
|
|
g |
|
|
|
|
|
|
||
Li2( |
|
|
|
) |
|
2 |
þ |
0.292 |
329 |
230 |
|
0.080 |
0.27 |
||
Na2 |
|
|
|
1 |
gþ |
0.746 |
308 |
159 |
|
0.000 |
1.00 |
||||
|
|
|
|
|
u |
|
|
|
|
|
|
||||
Na2( |
|
|
|
) |
2 |
þ |
0.628 |
322 |
136 |
|
0.548 |
0.84 |
|||
Na2( ) |
2 |
u(I) |
0.130 |
369 |
84 |
|
0.548 |
0.17 |
|||||||
Na2( ) |
2 g(II) |
0.685 |
312 |
147 |
0.100 |
0.92 |
|||||||||
|
|
|
|
|
|
g |
|
|
|
|
|
|
|||
Na2( |
|
|
|
) |
2 þ |
0.184 |
377 |
88 |
|
0.100 |
0.25 |
||||
K2 |
|
|
|
|
|
1 |
gþ |
0.520 |
391 |
92 |
|
0.000 |
1.00 |
||
|
|
|
|
|
|
u |
|
|
|
|
|
|
|||
K2( |
|
|
|
) |
|
|
2 |
þ |
0.512 |
404 |
75 |
|
0.502 |
0.98 |
|
K2( ) |
|
|
2 |
u(I) |
0.091 |
456 |
49 |
|
0.502 |
0.18 |
|||||
K2( ) |
|
|
2 |
g(II) |
0.511 |
397 |
81 |
0.120 |
0.98 |
||||||
|
|
|
|
|
|
|
g |
|
|
|
|
|
|
||
K2( |
|
|
|
) |
|
|
2 |
þ |
0.107 |
470 |
51 |
|
0.120 |
0.21 |
|
Rb2 |
|
|
|
1 |
gþ |
0.490 |
418 |
57 |
|
0.000 |
1.00 |
||||
|
|
|
|
|
u |
|
|
|
|
|
|
||||
Rb2( |
|
|
|
) |
2 |
þ |
0.475 |
440 |
46 |
|
0.486 |
0.96 |
|||
Rb2( ) |
2 |
u(I) |
0.064 |
475 |
31 |
|
0.486 |
0.13 |
|||||||
Rb2( ) |
2 |
g(II) |
0.470 |
428 |
60 |
0.140 |
0.96 |
||||||||
|
|
|
|
|
|
g |
|
|
|
|
|
|
|||
Rb2( |
|
|
|
) |
2 |
þ |
0.085 |
490 |
44 |
|
0.140 |
0.17 |
|||
Cs2 |
|
|
|
|
1 |
gþ |
0.452 |
464 |
42 |
|
0.000 |
1.00 |
|||
|
|
|
|
|
u |
|
|
|
|
|
|
||||
Cs2( |
|
|
|
) |
2 |
þ |
0.437 |
491 |
37 |
|
0.689 |
0.97 |
|||
Cs2( ) |
2 |
u(I) |
0.031 |
525 |
18 |
|
0.689 |
0.07 |
|||||||
Cs2( ) |
2 |
g(II) |
0.455 |
485 |
42 |
0.160 |
1.00 |
||||||||
|
|
|
|
|
|
g |
|
|
|
|
|
|
|||
Cs2( |
|
|
|
) |
2 |
þ |
0.047 |
542 |
25 |
|
0.160 |
0.10 |
|||
Cu2 |
|
|
|
1 |
gþ |
2.020 |
222 |
266 |
|
0.000 |
1.00 |
||||
|
|
|
|
|
u |
|
|
|
|
|
|
||||
Cu2( |
|
|
|
) |
2 |
þ |
1.620 |
234 |
196 |
|
1.235 |
0.80 |
|||
Cu2( ) |
2 |
u(I) |
0.280 |
261 |
125 |
|
1.235 |
0.14 |
|||||||
Cu2( ) |
2 |
g(II) |
1.531 |
236 |
230 |
0.120 |
0.76 |
||||||||
|
|
|
|
|
|
g |
|
|
|
|
|
|
|||
Cu2( |
|
|
|
) |
2 |
þ |
0.168 |
284 |
91 |
|
0.120 |
0.09 |
|||
Ag2 |
|
|
|
1 |
g |
1.650 |
248 |
192 |
|
0.000 |
1.00 |
||||
|
|
|
|
|
u |
|
|
|
|
|
|
||||
Ag2( |
|
|
|
|
) |
2 |
þ |
1.370 |
260 |
145 |
|
1.488 |
0.83 |
||
Ag2( ) |
2 |
u(I) |
0.288 |
279 |
103 |
|
1.488 |
0.18 |
|||||||
Ag2( ) |
2 |
g(II) |
1.350 |
257 |
185 |
0.140 |
0.82 |
||||||||
Ag2( ) |
2 |
g |
0.175 |
293 |
75 |
0.140 |
0.10 |
||||||||
Au2 |
|
|
|
1 |
gþ |
2.290 |
247 |
190 |
|
0.000 |
1.00 |
||||
|
|
|
|
|
u |
|
|
|
|
|
|
||||
Au2( |
|
|
|
|
) |
2 |
þ |
1.920 |
258 |
149 |
|
2.309 |
0.84 |
||
Au2( ) |
2 |
u(I) |
0.434 |
270 |
104 |
|
2.309 |
0.18 |
|||||||
Au2( ) |
2 |
g(II) |
2.010 |
253 |
175 |
0.160 |
0.88 |
||||||||
|
|
|
|
|
|
g |
|
|
|
|
|
|
|||
Au2( |
|
|
|
|
) |
2 |
þ |
0.188 |
298 |
65 |
|
0.160 |
0.08 |
||
214 DIATOMIC AND TRIATOMIC MOLECULES AND SULFUR FLUORIDES
bond orders of the antibonding curves are 0.1 to 0.2. In the anions of the halogens and O2 the bond orders of the excited states vary from 0.025 to 0.11.
9.2.5 Electron Affinities and Morse Potential Energy Curves: NO and NO( )
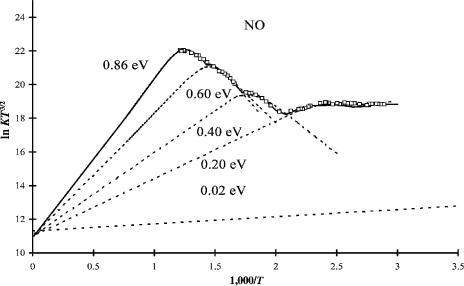
The electron affinities for NO listed in the NIST table cluster around 0.02, 0.6, and 0.85 eV. All are confirmed by more than one technique. In 1971 the ECD response for both O2 and NO were measured as a function of temperature [1–3, 5, 23, 24, 54– 62]. The low-temperature data for O2 gave an Ea that is consistent with the excited state Ea. In 2002 the data for O2 and NO were analyzed in terms of two states. However, the number of predicted states for each is larger. Additional ECD data for O2 indicated more excited states, as discussed above. Therefore, the original data for NO have been reanalyzed in terms of multiple states. Three correspond to the three states observed for the O2 molecule, which is isoelectronic with NO( ). The ground state is the 3 state, AEa ¼ 0:86ð5Þ eV, while the intermediate state occurs at the 1 state, Ea ¼ 0:60ð5Þ eV or 0.40(5) eV. Figure 9.15 is a combined plot of the calculated ECD curves for four valence-state anions of NO. Table 9.7 gives the parameters used to calculate these curves. The ground state and first excited state have a larger A1 value than the two lower states. The Qan of the first excited state is lower than that for the other three, all with an approximate value of 1. The activation energies increase from about zero for the 0.2 eV state to 0.7 eV for the ground state. With these electron affinities and activation energies Morse
Figure 9.15 ECD data for NO plotted as ln KT3/2 versus 1,000/T. The curves drawn through the data are calculated using the parameters given in Table 9.7.
|
|
|
|
DIATOMIC MOLECULES |
215 |
|
TABLE 9.7 ECD Parameters for NO |
|
|
|
|
||
|
|
|
|
|
|
|
Species |
ln (A1) |
E1 (eV) |
Q |
Ea (eV) |
E 1 |
(eV) |
Ground state |
34.3 |
0.70(2) |
0.93 |
0.86(5) |
1.57(3) |
|
A |
34.9 |
0.60(2) |
0.82 |
0.60(5) |
1.21(3) |
|
B |
29.3 |
0.41(2) |
0.86 |
0.40(5) |
0.81(3) |
|
C |
28.0 |
0.02(2) |
0.88 |
0.21(5) |
0.23(3) |
|
D (not observed) |
— |
— |
1.00 |
0.02 |
0.02 |
|
|
|
|
|
|
|
|
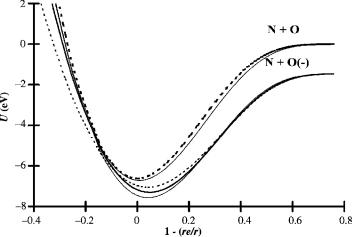
potential energy curves for four Mð2Þ states and a dipole bound state can be calculated. These are illustrated in Figure 9.16. The state with an Ea of 0.02 eV could lead to the N( ) þ O limit or be a dipole bound state. All the Mð2Þ valence-state curves cross on the ‘‘backside’’ of the neutral curve and have an activation energy that corresponds to one of those measured in the ECD. The lowest activation energy will exist for the dipole bound state. When this state is accessed, it could be metastable with respect to transitions to the lower states and the ground state will not be populated. In addition, rapid autodetachment to the neutral might not take place because of the similar geometry in the anion and neutral. Such could be the reason this ion is so frequently observed experimentally. The experimental data for the electron attachment to NO can be rationalized using these curves [54–62].
The CURES-EC for the Ea of the singlet and triplet states of NO( ) are 0.9, 0.5, and 0.3 eV. The triplet ground state of the anion is 0.6 eV lower than that for the singlet state. The PM3(t6100) AEa is 0.90 eV. The PM3(s4100) Ea is 0.5 eV, while the PM3(s6100) Ea is 0.3 eV. The internuclear distances for the anions are about
˚
0.07 A longer than the neutral, whereas the frequencies are about 10% lower in the anions. The Morse curves are consistent with these data. The importance of
Figure 9.16 Morse potential energy curves for the neutral and negative-ion states of NO.
216 DIATOMIC AND TRIATOMIC MOLECULES AND SULFUR FLUORIDES
the negative-ion states of O2 and NO to biological processes will be discussed in Chapter 12.
9.3TRIATOMIC MOLECULES AND ANIONS
The electron affinities of triatomic molecules are important because they are the simplest species with a third geometrical dimension. Those of many of the homonuclear triatomic molecules have already been measured. The Ea of the Group I, III, and VII trimers are larger than those for the monomer and dimer. Those of C, N, and O are particularly important. For C3 the electron affinity is lower than that of the dimer, while for N3 and O3 the opposite is true. The azide radical is the simplest species containing only nitrogen with a positive valence-state electron affinity, 2.76(4) eV, determined by PD and PES. Ozone is an important form of oxygen in the upper atmosphere. Its electron affinity of 2.103(3) eV has been confirmed by nine determinations using three techniques [63–68]. The heteronuclear triatomic molecules SO2 and NO2 are environmental hazards. The electron affinity of SO2 is well established at 1.107(7) eV. The weighted average of nine different values equals the PES value. This includes the first value determined in 1957 by equilibrium bracketing. The Ea of SO2 has been used as a reference point for TCT measurements. The electron affinities of NO2 range from 1.8 eV to 3.9 eV and have been determined by many different techniques. Ten values cluster around the PES value of 2.273(5) eV, including one determined by dissociative electron attachment to CH3NO2 in the ECD. However, three values are reported at 2.5 eV, two at about 3.0 eV, and two at 3.9 eV. In addition, excited-state electron affinities have been postulated for NO2, one at 0.0 eV [1–3, 69–89].
The azide radical is linear, as is its anion. Ozone, sulfur dioxide, and NO2 are bent in the neutral form and in the anion. The neutrals of CO2, CS2, COS, and N2O are linear and the anions bent, as predicted by simple molecular orbital theory. The electron affinities of these species are uncertain [90–102]. In Figure 9.17 the ECD data for these compounds are shown. The diversity in the temperature dependence of the isoelectronic molecules is remarkable. The ECD response of CO2 is unexplained. The temperature dependence for CS2 is typical of nondissociative electron attachment to two states. The low-temperature dependence of COS is unusual, but can be attributed to attachment to two states with a low A1. Dissociative electron attachment and molecular ion formation are observed in the ECD data for N2O. Consequently, only an upper limit to the electron affinity may be obtained [90–93].
Photoelectron spectra and electron impact data are available for N2O and CS2. Figures 9.18 and 9.19 provide the photoelectron spectra for both. The comparison of the PES for these two compounds is striking. The broad peak at the higher energies and the low-energy onset of photodetachment in the spectra of N2O are very different from the vibrational fine structure observed for CS2. The onset for the PES of CS2 occurs at 0.6 eV, but the well-resolved progression has its origin at about 0.9 eV. The peak at 1.6 eV is the vertical detachment energy [94]. The onset in the PES for N2O occurs at 0.0 eV and corresponds to the linear anion. The PES