

Chen The electron capture detector
.pdfELECTRON AFFINITIES DETERMINED USING ECD, NIMS, AND TCT METHODS |
247 |
||||
TABLE 10.6 Evaluated Electron Affinities (in eV) of Hydrocarbons |
|
||||
Using the ECD Method [57] |
|
|
|
|
|
|
|
|
|
|
|
Molecule |
AEa |
NIST |
ECD |
E1=2 |
C-EC |
1,2,4,5-tetraMeBz |
0.07(2) |
0.048 |
0.07(2) |
— |
0.05 |
Styrene |
0.10(5) |
— |
0.10(5) |
0.12(5) |
0.10 |
1,2,3,5-tetraMeBz |
0.10(5) |
0.108 |
0.10(5) |
— |
0.08 |
Benzene, hexamethyl- |
0.12(5) |
0.121 |
0.12(5) |
— |
0.10 |
Biphenyl |
0.13(2) |
0.130 |
0.13(5) |
0.10(3) |
0.14 |
2-Me-naphthalene |
0.14(5) |
0.143 |
0.14(5) |
— |
0.15 |
1-Me-naphthalene |
0.16(5) |
0.147 |
0.16(5) |
— |
0.17 |
Naphthalene |
0.16(2) |
0.200 |
0.16(5) |
0.17(3) |
0.15 |
Diphenylmethane |
0.16(5) |
0.156 |
0.16(5) |
— |
0.18 |
2,6-Di-Me-naphthalene |
0.16(5) |
0.160 |
0.16(5) |
— |
0.15 |
2,3-Di-Me-naphthalene |
0.17(5) |
0.173 |
0.17(5) |
— |
0.18 |
Indene |
0.17(5) |
0.173 |
0.17(5) |
— |
0.18 |
Benzene, pentamethyl- |
0.18(5) |
0.182 |
0.18(5) |
— |
0.17 |
Naphthalene, 2-ethyl |
0.19(5) |
0.195 |
0.19(5) |
— |
0.19 |
1,4-Di-Me-naphthalene |
0.25(5) |
0.247 |
0.25(5) |
— |
0.23 |
Fluorene |
0.28(5) |
0.278 |
0.28(5) |
— |
0.30 |
Triphenylene |
0.29(2) |
0.285 |
0.29(2) |
0.29(3) |
0.27 |
Phenanthrene |
0.30(2) |
0.307 |
0.30(2) |
0.31(3) |
0.31 |
Diphenylethyne |
0.32(5) |
0.321 |
0.32(5) |
— |
0.35 |
Ethylene-1,1 diphenyl |
0.39(5) |
0.390 |
0.39(5) |
— |
0.36 |
Stillbene |
0.39(5) |
0.390 |
0.39(5) |
— |
0.40 |
Chrysene |
0.42(4) |
0.397 |
0.42(4) |
0.42(3) |
0.43 |
Picene |
0.54(3) |
0.542 |
0.50(3) |
0.49(3) |
0.50 |
Benz[e]pyrene |
0.55(3) |
0.534 |
0.55(3) |
0.56(3) |
0.56 |
Benzo[c]phenanthrene |
0.58(1) |
0.545 |
0.58(1) |
0.58(3) |
0.60 |
Pyrene |
0.61(2) |
0.500 |
0.61(2) |
0.63(3) |
0.62 |
Dibenz[a,j]anthracene |
0.67(3) |
0.591 |
0.67(3) |
0.65(3) |
0.70 |
Dibenz[a,c]anthracene |
0.69(5) |
— |
0.69(5) |
0.69(3) |
0.68 |
Anthracene |
0.68(1) |
0.530 |
0.68(1) |
0.72(3) |
0.70 |
Dibenz[a,h]anthracene |
0.69(3) |
0.595 |
0.69(3) |
0.65(3) |
0.66 |
Benz[a]anthracene |
0.72(2) |
0.390 |
0.72(2) |
0.72(3) |
0.74 |
Benz[a]pyrene |
0.80(3) |
0.815 |
0.80(3) |
0.79(3) |
0.80 |
1,3,5,7-c-C8H8 |
0.80(10) |
0.550 |
0.80(10) |
0.83(5) |
0.8 |
Acenaphthylene |
0.80(2) |
0.403 |
0.80(2) |
0.80(10) |
0.8 |
Fluoranthene |
0.82(4) |
0.630 |
0.82(4) |
0.83(3) |
0.81 |
Azulene |
0.84(10) |
0.694 |
0.90(10) |
0.78(5) |
0.78 |
Perylene |
0.973(5) |
0.973 |
0.98(10) |
1.01(3) |
1.00 |
Tetracene |
1.08(4) |
1.067 |
1.08(4) |
1.09(3) |
1.08 |
|
|
|
|
|
|
capture. The exceptions are the chloroacetophenones. Some of these have been used as reference points for calibrating the TCT scale. Others have been measured by both the TCT and ECD methods. The NIST tables list the majority of the Ea for these compounds. However, the NIST Ea are single-state values. In the data for the F-acetophenones structure is observed so the analysis has been revisited. The

248 NEGATIVE IONS OF ORGANIC MOLECULES
TABLE 10.7 Electron Affinities (in eV) of Aromatic Hydrocarbons from Reduction Potentials [56]
Molecule |
(E1=2)a |
mddG |
Group |
C-EC |
MINDO/3b |
EN |
p-Terphenyl |
0.27 |
2.00 |
A |
0.30 |
0.06 |
0.05 |
p-Quarterphenyl |
0.41 |
2.00 |
A |
0.41 |
0.57 |
0.42 |
Tribenzanthracene |
0.61 |
2.00 |
A |
0.62 |
0.61 |
0.60 |
Dibenz[b,g]phenanthrene |
0.78 |
2.00 |
A |
0.78 |
0.76 |
— |
Benz[j]fluoranthene |
1.01 |
2.00 |
A |
1.00 |
1.02 |
— |
Dibenz[b,e]pyrene |
1.10 |
2.00 |
A |
1.08 |
0.93 |
0.93 |
Benz[a]perylene |
1.24 |
2.00 |
A |
1.25 |
1.25 |
1.29 |
Benz[g]chrysene |
0.58 |
1.95 |
A |
0.56 |
0.60 |
— |
Naphtho[2,3,b]pyrene |
0.73 |
1.95 |
A |
0.70 |
0.52 |
0.65 |
Benz[b]fluoranthene |
0.95 |
1.95 |
A |
0.96 |
0.94 |
— |
Dibenz[a,c]tetracene |
1.02 |
1.95 |
A |
1.03 |
0.95 |
1.04 |
Benz[a]tetracene |
1.06 |
1.95 |
A |
1.06 |
1.00 |
1.00 |
Naphtho[2,3,j]fluoranthene |
1.17 |
1.95 |
A |
1.19 |
1.15 |
— |
Benz[a]fluoranthene |
1.25 |
1.95 |
A |
1.27 |
1.23 |
— |
Dibenz[a,c]pentacene |
1.30 |
1.95 |
A |
1.29 |
1.25 |
1.38 |
s-indenofluoranthene |
1.33 |
1.95 |
A |
1.30 |
1.37 |
— |
Dibenz[a,f]fluoranthene |
1.58 |
1.95 |
A |
1.60 |
1.60 |
— |
Dibenz[e]pyrene |
0.59 |
1.90 |
mAF |
0.59 |
0.56 |
0.61 |
Dibenz[c,m]pentaphene |
0.76 |
1.90 |
mAF |
0.77 |
0.78 |
— |
Benz[p]pentaphene |
0.78 |
1.90 |
mAF |
0.77 |
0.75 |
0.80 |
Dibenz[a,e]pyrene |
0.88 |
1.90 |
mAF |
0.86 |
0.85 |
0.89 |
Benz[k]fluoranthene |
0.89 |
1.90 |
mAF |
0.88 |
0.83 |
— |
Naphto[2,3]fluoranthene |
0.90 |
1.90 |
mAF |
0.89 |
0.85 |
— |
Dibenz[a,h]tetracene |
1.03 |
1.90 |
mAF |
1.02 |
0.96 |
1.01 |
Hexaphene |
1.06 |
1.90 |
mAF |
1.05 |
0.97 |
1.08 |
Dibenz[a,n]perylene |
1.28 |
1.90 |
mAF |
1.30 |
1.30 |
1.36 |
Dibenz[a,h]pentacene |
1.43 |
1.90 |
mAF |
1.43 |
1.24 |
1.36 |
Dibenzphenanthrene |
0.58 |
1.90 |
Fþ |
0.58 |
— |
0.53 |
Benz[c]chrysene |
0.60 |
1.85 |
Fþ |
0.60 |
0.50 |
0.50 |
Pentaphene |
0.75 |
1.85 |
Fþ |
0.73 |
0.71 |
0.73 |
Benz[b]chrysene |
0.89 |
1.85 |
Fþ |
0.90 |
0.80 |
0.86 |
Dibenz[def,mno]chrysene |
1.14 |
1.85 |
Fþ |
1.14 |
1.18 |
1.10 |
Dibenz[a,h]pyrene |
1.16 |
1.85 |
Fþ |
1.16 |
1.19 |
1.18 |
Tetrabenz[a,cd, j,lm]perylene |
1.18 |
1.85 |
Fþ |
1.21 |
1.19 |
1.07 |
Benz[a]pentacene |
1.38 |
1.85 |
Fþ |
1.37 |
1.29 |
1.39 |
Dibenz[bc,hl]coronene |
1.41 |
1.85 |
Fþ |
1.38 |
1.39 |
1.50 |
Dibenz[a, j]perylene |
1.45 |
1.85 |
Fþ |
1.44 |
1.46 |
1.50 |
Dinaphtho[a,h]pyrene |
1.55 |
1.85 |
Fþ |
1.53 |
1.52 |
1.58 |
Benzindenofluoranthene |
1.73 |
1.85 |
Fþ |
1.72 |
1.70 |
— |
Dibenz[pg,p]chrysene |
0.79 |
1.80 |
F |
0.77 |
0.78 |
0.80 |
Dibenz[b,pqr]perylene |
0.86 |
1.80 |
F |
0.83 |
0.82 |
0.88 |
Benz[g,h,I]perylene |
0.89 |
1.80 |
F |
0.89 |
0.75 |
0.85 |
Dinaphth[p]pentaphene |
0.91 |
1.80 |
F |
0.90 |
0.80 |
0.86 |
Benznaphthopentacene |
1.03 |
1.80 |
F |
1.01 |
0.96 |
— |
Tribenz[a,e,i]pyrene |
1.03 |
1.80 |
F |
1.02 |
0.96 |
1.01 |

ELECTRON AFFINITIES DETERMINED USING ECD, NIMS, AND TCT METHODS |
249 |
|||||
TABLE 10.7 ðContinuedÞ |
|
|
|
|
|
|
Molecule |
(E1=2)a |
mddG |
Group |
C-EC MINDO/3b |
EN |
|
|
|
|
|
|
|
|
Dibenz[b,k]chrysene |
1.05 |
1.80 |
F |
1.06 |
0.96 |
1.03 |
Dibenz[fq,qr]tetracene |
1.10 |
1.80 |
F |
1.08 |
1.05 |
1.04 |
Naphtho[2,3,e]pyrene |
1.23 |
1.80 |
F |
1.21 |
1.15 |
1.28 |
Pyranthene |
1.32 |
1.80 |
F |
1.32 |
1.38 |
— |
Tetrabenzpentacene |
1.68 |
1.80 |
F |
1.66 |
1.60 |
1.73 |
Tetrabenzpentaphene |
1.70 |
1.80 |
F |
1.68 |
1.67 |
1.78 |
Benztetrabenzpentaphene |
1.90 |
1.80 |
F |
1.89 |
— |
1.94 |
Diindeneotetracene |
2.04 |
1.80 |
F |
2.05 |
2.04 |
— |
Dibenz[cd,lm]perylene |
1.25 |
1.75 |
F |
1.26 |
1.25 |
1.28 |
Benz[x,y,z]heptaphene |
1.28 |
1.75 |
F |
1.29 |
1.16 |
1.28 |
Tetracenotetracene |
1.65 |
1.75 |
F |
1.64 |
1.64 |
1.60 |
structure is apparent in a plot of ECD data for several substituted acetophenones, as shown in Figure 10.9. For the trifluoromethylacetophenones recent TCT Ea can be used in the data analysis to improve the ECD parameters. The Ea of the TCT reference compounds, acetophenone, benzonitrile, methylbenzoate, and benzophenone are supported by reduction potentials.
The electron affinities of acetophenone and benzaldehyde have also been used as internal standards for ECD work. Many of the values of the substituted compounds were determined using acetophenone as an internal standard. Acetophenone was chosen because its temperature dependence was so well established, as shown in Figures 10.8 and 10.9. The value for acetophenone in the NIST table is
Figure 10.9 Plots of ECD data as ln KT3/2 versus 1,000/T for acetophenones that show structure. From [58, 69, 72].

250 NEGATIVE IONS OF ORGANIC MOLECULES
TABLE 10.8 Molecular Electron Affinities (in eV) of Acetophenones and Benzaldehydes Using the ECD Method
Molecule |
AEa |
NIST |
ECD |
C-EC |
Acetophenone |
0.338(2) |
0.334 |
0.338(2) |
0.34 |
Acetophenone-o-F |
0.49(3) |
0.442 |
0.49(3) |
0.45 |
Acetophenone-m-F |
0.58(3) |
0.577 |
0.58(3) |
0.55 |
Acetophenone-p-F |
0.52(5) |
0.395 |
0.52(5) |
0.50 |
Acetophenone-p-Cl |
0.64(5) |
0.585 |
0.64(5) |
0.62 |
Acetophenone-m-Cl |
0.67(5) |
0.616 |
0.67(5) |
0.66 |
Acetophenone-o-CF3 |
0.79(5) |
0.642 |
0.79(5) |
0.83 |
Acetophenone-m-OH |
0.77(2) |
— |
0.77(2) |
0.76 |
Acetophenone-m-CF3 |
0.79(5) |
0.768 |
0.79(5) |
0.80 |
Acetophenone-p-CF3 |
0.89(9) |
0.898 |
0.89(10) |
1.00 |
Acetophenone-p-acetyl |
1.06(9) |
1.062 |
1.06(10) |
1.15 |
Benzaldehyde |
0.457(5) |
0.429 |
0.457(5) |
0.45 |
Benzaldehyde-m-F |
0.67(3) |
0.668 |
0.66(4) |
0.64 |
Benzaldehyde-o-F |
0.66(3) |
0.637 |
0.66(4) |
0.62 |
Benzaldehyde-p-F |
0.57(5) |
0.486 |
0.57(5) |
0.55 |
Benzaldehyde-m-OCH3 |
0.48(4) |
0.429 |
0.48(4) |
0.45 |
Benzaldehyde-m-CH3 |
0.41(2) |
0.408 |
0.43(2) |
0.45 |
Benzaldehyde-p-CH3 |
0.39(2) |
0.373 |
0.39(2) |
0.40 |
Benzaldehyde-2,4,6 triMe |
0.44(4) |
0.442 |
0.44(3) |
0.47 |
Propiophenone |
0.36(2) |
0.351 |
0.36(1) |
0.36 |
|
|
|
|
|
0.334 eV. This is slightly lower than the average of all the determinations for acetophenone, 0.338(2). Likewise, for benzaldehyde the average of multiple determinations is 0.457(5), while the NIST value is 0.429 eV. The NIST ECD values for benzonitrile and methylbenzoate are the evaluated values. The evaluated value for benzophenone is 0.68(5) eV, while the NIST value is 0.620 eV. All these are confirmed by CURES-EC. The values for the para-substituted chloro-, methoxy-, and methyl-substituted benzophenones are confirmed by reduction potentials. For compounds with two CF3 groups on a benzene ring the available CURES-EC parameters give upper limits that are 0.3 eV higher than experiment.
Table 10.8 lists the Ea for the substituted acetophenones and benzaldehydes determined by ECD. For comparison the NIST and CURES-EC values are given. The revised ECD value for o-CF3-acetophenone, 0.79(5) eV, is higher than the earlier 0.643 eV listed in the NIST tables for this same substance. The values for p-F acetophenone and p-F-benzaldehyde are also larger as a result of the assumption of two states. The ECD Ea for diacetyl-benzene and m- and p-CF3-acetophenone are consistent with the TCT Ea.
Table 10.9 gives the Ea for substituted benzophenones and other carbonyl compounds determined using the ECD. Many of the Ea for the benzophenones are not
ELECTRON AFFINITIES DETERMINED USING ECD, NIMS, AND TCT METHODS |
251 |
||||
TABLE 10.9 Molecular Electron Affinities (in eV) of the Anisoles, Benzophenones, |
|||||
Benzonitriles, and Benzoates Using the ECD Method |
|
|
|
||
|
|
|
|
|
|
Molecule |
AEa |
NIST |
ECD |
CURES-EC |
|
|
|
|
|
|
|
Benzophenone |
0.68(5) |
0.620 |
0.68(5) |
|
0.68 |
Benzophenone-4-methoxy |
0.61(5) |
— |
0.61(5) |
|
0.60 |
Benzophenone-4-methyl |
0.64(5) |
— |
0.64(5) |
|
0.64 |
Benzophenone-4-ethyl |
0.64(5) |
— |
0.64(5) |
|
0.64 |
Benzophenone-p-F |
0.70(5) |
0.620 |
0.70(5) |
|
0.70 |
Benzophenone-p-Cl |
0.78(10) |
— |
0.78(10) |
|
0.81 |
Benzophenone-p-Br |
0.90(10) |
— |
0.90(10) |
|
0.88 |
Benzophenone-p-I |
1.10(20) |
— |
1.10(20) |
|
1.10 |
Benzophenone-p-NO2 |
1.50(20) |
— |
1.50(20) |
|
1.50 |
Benzophenone-m-CF3 |
1.00(10) |
1.078 |
1.00(20) |
|
1.20 |
Benzonitrile |
0.26(2) |
0.258 |
0.25(2) |
|
0.26 |
Methyl benzoate |
0.20(5) |
0.180 |
0.20(5) |
|
0.21 |
1-2-Dimethyl phthalate |
0.60(10) |
0.550 |
0.60(10) |
|
0.60 |
1,3-Dimethyl phthalate |
0.60(10) |
0.550 |
0.60(10) |
|
0.61 |
Diethyl phthalate |
0.62(10) |
0.540 |
0.62(10) |
|
0.65 |
Anisole-pentafluoro |
0.55(5) |
0.542 |
0.55(5) |
|
0.58 |
Anisole-tetrafluoro |
0.25(5) |
0.217 |
0.25(5) |
|
0.28 |
|
|
|
|
|
|
listed in the NIST tables. The Ea of methyl benzoate and the esters of benzene di-carboxylic acids have been determined with the ECD. Other derivatives of these compounds have been determined by TCT measurements and scaled to the value for methyl benzoate. The Ea of more than 14 aromatic and aliphatic carbonyl compounds have been determined by both the ECD and TCT methods. These values and Ea for other carbonyl compounds determined by one of these methods are presented in Table 10.10. All the values agree within the stated uncertainties and are confirmed by CURES-EC [63–68].
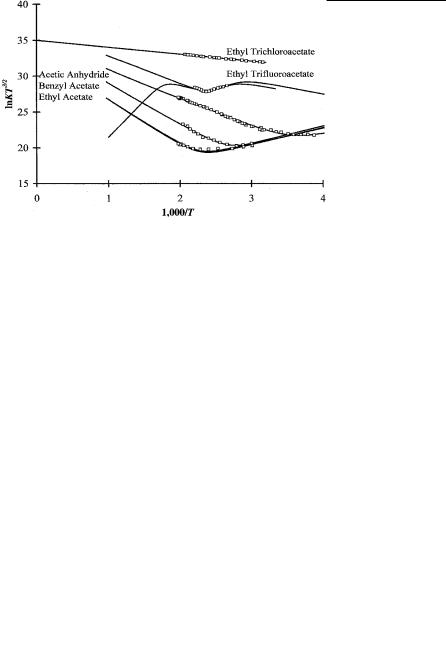
The electron affinity of the acetate radical was determined from the –EDEA obtained from ECD data for ethyl acetate, benzyl acetate, and acetic anhydride. At the same time data were obtained for ethyl trifluoroacetate and ethyl trichloracetate, but were not analyzed or reported. These data are revisited with two states and new bond dissociation energies. This gives another example of how CURESEC can be used to support experimental results [1, 69]. Figure 10.10 is a typical ECD plot of ln KT3/2 versus 1,000/T for these compounds. In Table 10.11 the kinetic and thermodynamic parameters obtained from the data are shown. The values of D Ea (acetate) available in the literature were used in the data reduction procedure, and the rate constant and Qan values are obtained from the ECD data. The A1 values are close to the DeBroglie A1. The Qan values are less than 1.0. The E1 values are less than 0.15 eV. The Ea are thus typical of the ECD, although in the lower range of Ea measured in the ECD for ethyl acetate, benzyl acetate, and acetic
252 NEGATIVE IONS OF ORGANIC MOLECULES
TABLE 10.10 Evaluated Electron Affinities (in eV) of Esters and Carbonyl Compounds
Molecule |
Selected |
NIST |
TCT |
ECD |
C-EC |
|
|
|
|
|
|
Methyl benzoate-p-NO2 |
1.48(9) |
1.461 |
1.48(10) |
— |
1.53 |
Methyl benzoate-m-NO2 |
1.25(9) |
1.227 |
1.25(10) |
— |
1.19 |
Maleic anhydride |
1.44(9) |
1.440 |
1.44(5) |
— |
1.4 |
Phthalic anhydride |
1.25(5) |
1.245 |
1.25(5) |
— |
1.3 |
Methyl benzoate-p-CHO |
1.18(9) |
1.158 |
1.10(10) |
— |
1.15 |
Nitrobenzene-m-OCH3 |
1.04(9) |
1.040 |
1.04(10) |
— |
1.0 |
Nitrobenzene-p-OCH3 |
0.91(9) |
0.911 |
0.91(10) |
— |
0.89 |
Acetophenone-p-COOCH3 |
0.96(9) |
0.963 |
0.96(10) |
1.0(10) |
1.15 |
Acetophenone-p-Cl |
0.64(5) |
0.585 |
0.57(9) |
0.64(5) |
0.62 |
Acetophenone-m-Cl |
0.67(5) |
0.616 |
0.59(9) |
0.67(5) |
0.66 |
Acetophenone-o-CF3 |
0.79(5) |
0.642 |
— |
0.79(5) |
0.83 |
Acetophenone-m-OH |
0.77(2) |
— |
— |
0.77(2) |
0.76 |
Acetophenone-m-CF3 |
0.79(5) |
0.768 |
0.77(9) |
0.79(5) |
0.80 |
Acetophenone-p-CF3 |
0.89(10) |
0.898 |
0.87(8) |
0.89(10) |
1.00 |
Methyl benzoate-p-COOCH3 |
0.82(10) |
0.824 |
0.82(10) |
— |
0.82 |
Methyl benzoate-m-COOCH3 |
0.60(10) |
0.550 |
— |
0.60(10) |
0.58 |
Ethyl trifluoroacetate |
0.8(1) |
— |
— |
0.8(1) |
0.8 |
Biacetyl |
0.70(5) |
0.690 |
0.69(10) |
0.71(3) |
0.70 |
Dimethyl phthalate |
0.60(10) |
0.550 |
— |
0.60(10) |
0.61 |
Methyl benzoate |
0.20(10) |
0.180 |
— |
0.20(10) |
0.21 |
Acetic anhydride |
0.21(5) |
— |
— |
0.21(5) |
0.20 |
Benzyl acetate |
0.20(5) |
— |
— |
0.20(5) |
0.15 |
Ethyl acetate |
0.20(5) |
— |
— |
0.20(5) |
0.20 |
1-Naphthaldehyde |
0.69(5) |
0.681 |
0.68(10) |
0.69(5) |
0.73 |
2-Naphthaldehyde |
0.64(5) |
0.642 |
0.64(10) |
0.65(5) |
0.68 |
Benzophenone |
0.68(5) |
0.620 |
0.68(5) |
0.68(5) |
0.66 |
|
|
|
|
|
|
The values in parentheses are the uncertainties in the last figure.
Figure 10.10 Plots of ECD data as ln KT3/2 versus 1,000/T for acetic anhydride and acetates. From [69, 73].

ELECTRON AFFINITIES DETERMINED USING ECD, NIMS, AND TCT METHODS |
253 |
TABLE 10.11 Kinetic and Thermodynamic Properties for Dissociative Electron Attachment from ECD Data for Esters
Species |
ln(A1) |
E1(eV) |
Q(eV) |
Ea(eV) |
E2(eV) |
ln(A2) |
Acetic anhydride |
34.2(4) |
0.01 |
0.4 |
0.21(5) |
0.22(5) |
24.3(2) |
Benzyl acetate |
35.8(4) |
0.04(1) |
0.3 |
0.20(5) |
0.24(5) |
22.0(2) |
Ethyl acetate |
35.3(4) |
0.04(1) |
0.8 |
0.20(5) |
0.24(5) |
21.0(20) |
Ethyl trifluoroacetate |
35.2(4) |
0.14(2) |
0.5 |
0.51(5) |
0.8(1) |
24.8(5) |
Ethyl trifluoroacetate |
35.1(4) |
0.22(5) |
0.4 |
0.8(1) |
— |
— |
Ethyl trifluoroacetate |
35.1(4) |
0.13(2) |
0.4 |
0.6(1) |
— |
— |
Ethyl trichloroacetate |
35.0(5) |
0.08(5) |
— |
— |
— |
— |
|
|
|
|
|
|
|
The values in parentheses are the uncertainties in the last figure. Other quantities are given to the proper number of significant figures The second set of data for the trifluoroacetate assumes two states. The data for the trichloroacetate could represent C Cl dissociation.
anhydride. The electron affinities of these molecules have been calculated using CURES-EC and support the experimental data, as shown in Table 10.10.
The data for ethyl trifluoroacetate in the low-temperature region can be definitely assigned to the formation of a stable negative ion. The increase at higher temperatures could result from activation to the ground state, as observed for tetracene. The lowest CURES-EC calculated value is 0.8 eV, while the ECD value from the lowertemperature slope is only 0.51 eV. As a result, we have calculated another curve that has two states. These results are also given in Table 10.11. The mechanism for the ECD reactions of ethyltrichloroacetate cannot be assigned because there is only one region and multiple pathways for dissociative electron capture exist. Dissociative electron capture could take place via the C Cl bond rather than the C O bond.
10.4.3 Electron Affinities of Organic Nitro Compounds the ECD and TCT Methods
Table 10.12 lists the Ea of aromatic nitrocompounds determined by both the TCT and ECD methods. The values are the weighted averages. The ECD and TCT values agree within the uncertainty. They are confirmed by reduction potential data and CURES-EC calculations (not listed). This is the largest number of Ea for related compounds that have been measured by any two techniques [15, 16, 63–68]. The ECD Ea for the dimethyl-nitrobenzenes, m-Cl-nitrobenzene, p-Cl-nitrobenzene, and 2-Cl-6-Me-nitrobenzene are not published elsewhere. The Ea for the dimethyl-nitrobenzenes are obtained from data in the linear region. Those for the chlorinated compounds are obtained from the fit to the data in both regions. The Ea for m-Cl-nitrobenzene is a lower limit because there are no data in the a region. These confirm the TCT values.
Figures 10.11 and 10.12 illustrate the ECD data showing structure and two states in the data for p-Cl-nitrobenzene and dimethylnitrobenzene. These data were collected along with those for other nitrobenzenes but not published because the

254 NEGATIVE IONS OF ORGANIC MOLECULES
TABLE 10.12 Electron Affinities (in eV) for Aromatic Nitrocompounds Using the TCT and ECD Methods
Molecule |
AEa |
NIST |
ECD |
TCT |
E1=2 |
Nitrobenzene (NB) |
1.00(1) |
1.006 |
1.00(2) |
1.01(5) |
1.00 |
Nitrobenzene-F5 |
1.50(10) |
1.450 |
1.50(10) |
1.45(10) |
1.50 |
Nitrobenzene-mF |
1.20(5) |
1.236 |
1.30(15) |
1.18(5) |
1.20 |
Nitrobenzene-oF |
1.09(5) |
1.075 |
1.10(15) |
1.09(5) |
1.11 |
Nitrobenzene-pF |
1.10(5) |
1.119 |
1.16(5) |
1.09(5) |
1.09 |
m-Nitrotoluene |
0.98(3) |
0.989 |
0.97(3) |
0.98(5) |
1.00 |
o-Nitrotoluene |
0.90(3) |
0.924 |
0.88(3) |
0.94(5) |
0.89 |
p-Nitrotoluene |
0.95(3) |
0.954 |
0.96(3) |
0.95(5) |
0.95 |
2,3-diMe-NB |
0.85(3) |
0.854 |
0.85(3) |
0.87(5) |
0.87 |
3,4-diMe-NB |
0.92(5) |
0.924 |
0.90(2) |
0.92(5) |
0.93 |
2,4-diMe-NB |
0.88(5) |
0.880 |
— |
0.88(5) |
— |
2,6-diMe-NB |
0.78(5) |
0.811 |
0.77(6) |
0.78(5) |
0.78 |
2,4,6-triMe-NB |
0.73(5) |
0.711 |
— |
0.73(5) |
0.72 |
3-Cl, 6-Me-NB |
1.09(5) |
— |
1.09(5) |
— |
— |
o-Cl-NB |
1.13(5) |
1.162 |
— |
1.13(5) |
1.20 |
m-Cl-NB |
1.27(5) |
1.280 |
1.25(15) |
1.26(5) |
1.28 |
p-Cl-NB |
1.24(4) |
1.258 |
1.25(5) |
1.23(5) |
1.25 |
|
|
|
|
|
|
structure was not understood [15]. Shown in the plots are the resolved curves for both states: the best combined curve and the best single-state curve. Also shown is a least-squares fit through the highest-temperature points, which indicates that the Qan for the ground state is low. These data support the TCT value of 1.23(5) eV for p-chloronitrobenzene. This clearly establishes the ability of both methods to measure ground-state Ea. The observation of structure in the ECD data shows that even at 1 atm pressure detachment can result from excited states. Thus, it is also certainly reasonable that excited-state anions may exist in TCT or photon methods at much lower pressures. A study of the effect of pressure on the thermal electron detachment rate of azulene demonstrated that the ‘‘high pressure limit’’ is not generally reached in TCT experiments [70].
Table 10.13 lists the Ea for a representative number of nitrocompounds that have been determined by only the TCT methods. These provide a range of values that were measured using this technique and examples of the substituent effects. When two determinations are made by different investigators, the weighted average is used. The most important point in this table is the CURES-EC method support of the TCT values. The Ea of the halogenated nitrobenzenes are also supported by reduction potential data. There are presently no higher estimates of the electron affinities of these compounds so these values are the current ‘‘best’’ adiabatic electron affinities.
Table 10.14 gives the Ea for acetophenones, benzaldehydes, benzonitriles, and benzophenones measured using only the TCT method. The values were scaled to

ELECTRON AFFINITIES DETERMINED USING ECD, NIMS, AND TCT METHODS |
255 |
Figure 10.11 Plots of ECD data as ln KT3/2 versus 1,000/T for p-Cl-nitrobenzene. The data were determined with a concentric electrode Ni-63 detector using dibromobenzene as an internal standard. They were also collected along with the data in [15], but electron affinities were not obtained because of the structure.
Figure 10.12 Plots of ECD data as ln KT3/2 versus 1,000/T for dimethyl-nitrobenzene. The data were determined with a concentric electrode Ni-63 detector using dibromobenzene as an internal standard. They were also collected along with the data in [15], but electron affinities were not obtained because of the structure.

256 NEGATIVE IONS OF ORGANIC MOLECULES
TABLE 10.13 Electron Affinities (in eV) for Aromatic Nitrocompounds Using the TCT Method
Molecule |
AEa |
NIST |
TCT |
C-EC |
Nitrobenzene-2,3-di-Cl |
1.29(10) |
1.292 |
1.30(10) |
1.40 |
Nitrobenzene-3,4-di-Cl |
1.44(10) |
1.444 |
1.44(10) |
1.50 |
Nitrobenzene-3,5-di-Cl |
1.52(8) |
1.500 |
1.52(8) |
1.50 |
Nitrobenzene-o-Br |
1.18(10) |
1.162 |
1.18(10) |
1.22 |
Nitrobenzene-m-Br |
1.32(10) |
1.318 |
1.32(10) |
1.35 |
Nitrobenzene-p-Br |
1.29(10) |
1.292 |
1.29(10) |
1.48 |
Nitrobenzene-o-CF3 |
1.33(10) |
1.331 |
1.33(10) |
1.25 |
Nitrobenzene-m-CF3 |
1.41(10) |
1.414 |
1.41(10) |
1.45 |
Nitrobenzene-p-CF3 |
1.50(10) |
1.500 |
1.50(10) |
1.55 |
Nitrobenzene-m-OCH3 |
1.04(10) |
1.040 |
1.04(10) |
1.00 |
Nitrobenzene-p-OCH3 |
0.91(10) |
0.911 |
0.91(10) |
0.89 |
Nitrobenzene-p-NH2 |
0.92(10) |
0.915 |
0.92(10) |
0.90 |
Nitrobenzene-m-NH2 |
0.95(10) |
0.945 |
0.95(10) |
0.92 |
Nitrobenzene-m-CN |
1.57(10) |
1.565 |
1.57(10) |
1.60 |
Dinitrobenzene-m |
1.66(10) |
1.657 |
1.66(10) |
1.68 |
Dinitrobenzene-o |
1.65(10) |
1.652 |
1.65(10) |
1.68 |
Dinitrobenzene-p |
2.00(10) |
2.003 |
2.00(10) |
2.01 |
1-Nitronaphthalene |
1.23(10) |
1.227 |
1.23(10) |
1.30 |
1,5-Dinitronaphthalene |
1.77(10) |
1.765 |
1.77(10) |
1.80 |
|
|
|
|
|
TABLE 10.14 Molecular Electron Affinities (in eV) Using the TCT Method
Molecule |
AEa |
NIST |
C-EC |
Acetophenone-m-NO2 |
1.33(10) |
1.33 |
1.40 |
Acetophenone-o-NO2 |
1.40(10) |
1.40 |
1.45 |
Acetophenone-p-NO2 |
1.57(10) |
1.57 |
1.50 |
Acetophenone-F5 |
0.88(10) |
0.876 |
0.88 |
Acetophenone-p-COOMe |
0.96(10) |
0.963 |
1.15 |
Benzaldehyde-F5 |
1.10(10) |
1.097 |
1.15 |
Benzaldehyde-m-CN |
1.02(10) |
0.990 |
1.08 |
Benzaldehyde-p-CN |
1.28(10) |
1.250 |
1.28 |
Benzaldehyde-m-CF3 |
0.85(10) |
0.815 |
0.90 |
Benzaldehyde-p-CF3 |
0.97(10) |
0.941 |
1.05 |
Benzaldehyde-3,5-DiCF3 |
1.26(10) |
1.232 |
1.54 |
Benzaldehyde-3,5-DiCl |
1.03(10) |
0.989 |
1.01 |
Benzaldehyde-p-Cl |
0.68(10) |
0.659 |
0.72 |
Benzaldehyde-m-Cl |
0.71(10) |
0.668 |
0.70 |
Benzaldehyde-p-CHO |
1.30(10) |
1.236 |
1.30 |
Benzaldehyde-m-CHO |
1.03(10) |
0.971 |
1.06 |
Benzaldehyde-p-NO2 |
1.69(10) |
1.691 |
1.66 |
Benzaldehyde-m-NO2 |
1.43(10) |
1.431 |
1.39 |
Benzaldehyde-o-NO2 |
1.56(10) |
1.557 |
1.50 |