

Chen The electron capture detector
.pdfALKYL HALIDES |
267 |
CH2Cl2, and C6F5X( ) are calculated from electron affinities, electron impact data, and dissociation energies.
The electron affinities of chlorinated biphenyls and naphthalenes were estimated from half-wave reduction potentials by assuming that the solution energy differences were constant. Now that it is possible to estimate solution energy differences, more accurate Ea are obtained. The Ea for all the isomers of the chlornaphthalenes are calculated using CURES-EC.
The negative-ion mass spectra for more than 300 environmental pollutants have been reported at two temperatures: 373 K and 523 K. The electron affinities of aromatic hydrocarbons, phthalates, chloroethylenes, chlorobenzenes, chloronphthalenes, chlorinated biphenyls, and nitrobenzenes have been measured, but the Ea of others, such as the bromobenzenes and chlorinated dioxins, have not. If we know the Ea of the parent compounds, the electron affinities and bond dissociation energies of these compounds can be estimated and compared with the NIMS data. These values are examined using CURES-EC.
One use of the electron affinities of molecules is to predict the sensitivity and temperature dependence of the ECD to compounds that might be analyzed. Many environmental pollutants have different multiple substituents. Pesticides are highly chlorinated organic compounds. The chlorinated biphenyls, naphthalenes, and dioxanes are among the most toxic compounds. The temperature dependence of these compounds in the ECD is important, but has not been extensively studied. When the electron affinities and bond dissociation energies are known, the temperature dependence can be calculated from the kinetic model. This is done for the chlorinated biphenyls and naphthalenes, and the calculated temperature dependence is then compared with experiment. These calculations offer clues about the best conditions for analysis.
11.2ALKYL HALIDES
11.2.1Morse Potential Energy Curves
The temperature dependence of the alkyl halides was one of the first subjects to be studied using the ECD. These are the simplest to analyze because often there is only one temperature region when dissociative thermal electron attachment is exothermic. This means that the EDEA, the energy of dissociative electron attachment, is positive: EDEA ¼ EaðXÞ DðR XÞ. The alkyl bromides, iodides, and chlorides are among the few organic compounds that have positive EDEA. Like the homononuclear diatomic halogen ions, the ground-state anionic curves for these molecules are M(3), with positive values for all three Herschbach metrics—EDEA, Ea, and VEa.
Originally, the temperature dependence for these compounds was interpreted in terms of unimolecular dissociation. The activation energy was equal to the energy of the crossing of a single curve with the molecular curve on the approach side of the molecule. The negative-ion curve dissociates to the lowest limit, R þ Xð Þ. The interpretation is now different since there are three potential energy curves in the
268 THERMAL ELECTRONS AND ENVIRONMENTAL POLLUTANTS
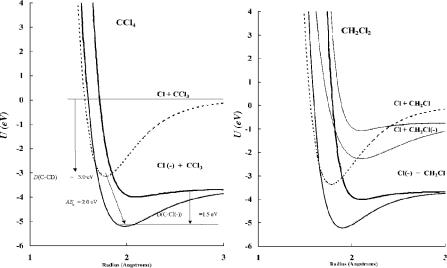
Figure 11.1 Morse potential energy curves for CCl4 and CH2Cl2, DEC(1) compounds.
region of the internuclear distance of the neutral. One curve is the polarization or dipole bound curve with an Ea less than 0.1 eV. The other two are a bonding curve and an antibonding curve resulting from the addition of the electron to the C X bond to give a three-electron bond [1–6].
This is exemplified in the data for the chloromethanes [1, 3–5]. Figure 11.1 illustrates the Morse potential energy curves for the bonding and antibonding states for CH2Cl2 and CCl4. The electron affinity of the bonding curve for CCl4 is 2.04(10) eV, as determined by MGN and AMB studies. The excited-state Ea is 0.80(34) eV by TCT [7–10]. The dissociation energy of the ground-state anion is D(C Cl) Ea(Cl) þ Ea(CCl4) ¼ 3.1 3.67 þ 2.04 ¼ 1.5 eV, which gives a bond order of 0.5 from 1.5/3.1. Since the C X bond in the neutral has two bonding electrons, whereas the bond in the anion has one net bonding electron, the simple bond order is predicted to be 0.5. The excited-state bond order is predicted to be lower and is 0.23/3.1 ¼ 0.08. Both curves cross the neutral curve close to zero, but the ground state is an M(3) curve and the excited state is a D(2) curve since the VEa is negative and the vertical transition leads to dissociation. The ground-state curve is an Mc(3) curve because it can lead to the long-range negative ion.
The activation energy from the ECD data for CH2Cl2 arises from the crossing of the excited-state curve and the neutral. The bond dissociation energy of the excitedstate anion is calculated by assuming a bond order of 0.1. The ground-state curve for CH2Cl2 is defined by the ECD activation energy and the electron affinity of 1.3 0.1 eV [7]. For CH2Cl2 two curves are drawn to the complementary dissociation limit, CH2Cl( ) þ Cl. The two higher curves for CH2Cl2 are D(0) because all three metrics are negative and the vertical transition leads to dissociation. The

ALKYL HALIDES |
269 |
TABLE 11.1 Thermodynamic Properties for Dissociative Electron Attachment to Alkyl Halides (in eV)
Compound |
|
|
DðR XÞ |
|
|
R X |
E1 ECD |
EaðXÞ |
in the Literature |
DðR XÞ ECD |
Intercept |
CF3 Cl |
0.25 0.02 |
3.616 |
3.74 |
>3.31, <3.93 |
34.1 0.3 |
CH3 Cl |
0.54 0.02 |
3.616 |
3.59 |
3.61 0.09 |
35.6 0.5 |
t-C4H9 Cl |
0.47 0.02 |
3.616 |
3.58 |
3.54 0.09 |
36.5 0.5 |
1,2C2H4Cl Cl |
0.38 0.01 |
3.616 |
3.46 |
3.45 0.09 |
36.1 0.1 |
CH2Cl Cl |
0.33 0.02 |
3.616 |
3.44 |
3.40 0.09 |
33.9 0.5 |
CF2Cl Cl |
0.15 0.02 |
3.616 |
3.30 |
3.22 0.09 |
36.0 0.5 |
CHCl2 Cl |
0.14 0.02 |
3.616 |
3.30 |
3.21 0.09 |
35.5 0.2 |
CFCl2 Cl |
0.01 0.02 |
3.616 |
3.17 |
3.08 0.09 |
36.0 0.2 |
CCl3 Cl |
0.00 0.05 |
3.616 |
3.08 |
3.07 0.09 |
33.6 0.2 |
CH3 Br |
0.25 0.02 |
3.365 |
3.02 |
3.07 0.09 |
33.2 0.5 |
n-C3H7 Br |
0.34 0.02 |
3.365 |
3.14 |
3.16 0.09 |
36.3 0.5 |
CH2Br Br |
0.05 0.02 |
3.365 |
2.97 |
2.87 0.09 |
36.8 0.2 |
CHBr2 Br |
0.01 0.02 |
3.365 |
2.84 |
2.83 0.09 |
34.4 0.5 |
CH3 I |
0.03 0.02 |
3.055 |
2.45 |
2.54 0.09 |
34.3 0.2 |
C2H5 I |
0.05 0.02 |
3.057 |
2.39 |
2.56 0.09 |
35.2 0.2 |
CHFCl Cl |
0.25 0.02 |
3.616 |
— |
3.32 0.09 |
34.0 0.2 |
1,3-C3H6Cl Cl |
0.34 0.02 |
3.616 |
— |
3.41 0.09 |
35.2 0.3 |
1,3-C3H6Br Br |
0.18 0.02 |
3.365 |
— |
3.00 0.09 |
35.9 0.2 |
bound curve is Mc(0) because it crosses the long-range curve below the dissociation limit, while the higher antibonding curve is Dc(0) because it will lead to dissociation when crossing the long-range curve. Previously only the D(2) curve crossing on the right-hand side of the minimum was considered [1, 3, 5].
11.2.2Experimental Activation Energies
The activation energy for thermal electron attachment to CCl4 is 0.0 0.05 eV, while that for CH2Cl2 is 0.33 0.02 eV. The activation energies for thermal electron attachment to the mono chloroalkanes are 0.45 eV to 0.55 eV. The A1 and E1 for the chloromethanes and values for other alkyl chlorides, bromides, and iodides are given in Table 11.1. The A1 values for all these compounds are within an order of magnitude of the De Broglie A1. Examples of the temperature dependence for the chloromethanes were given in Chapter 5 and are used to verify the suitability of ECD equipment to obtain fundamental data. Since only one temperature region is observed for most of these compounds, only one slope and one intercept are obtained. The activation energies establish the energy of the crossing of the excited-state negative ion and neutral curves.
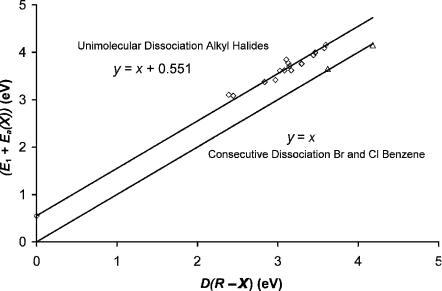
An empirical relationship DðR XÞ ¼ E þ EaðXÞ C relates the bond dissociation energy, electron affinity of the halogen, and activation energy for these types of reactions. For compounds studied in the ECD the quantity C, obtained from the
270 THERMAL ELECTRONS AND ENVIRONMENTAL POLLUTANTS
Figure 11.2 Correlation of activation energies for thermal electron attachment with bond dissociation energies for DEC(1) and DEC(2) compounds.
plot shown in Figure 11.2, is 0.55(9) eV. The bond dissociation energies for other compounds are obtained from these data using C ¼ 0.55(9) and the experimental E1. These are compared with experiment in Table 11.1 [11, 12]. This relationship will be valid if dissociation takes place via a curve crossing on the right-hand side of the neutral, as in Figure 11.1 for CH2Cl2. If, however, the ground-state curve also participates in the dissociation, this gives a lower limit to the bond dissociation energy. Also shown in Figure 11.2 is a unit slope zero intercept line that is valid for compounds in which dissociation only results from a single state. In the case of CF3Cl the DðR ClÞ is E þ Ea(Cl) 0.55 ¼ 3.31 eV. As seen in Table 11.1, the value found in the literature is 3.73 eV. If, on the other hand, the dissociation only occurs from the ground state, then DðR ClÞ ¼ E þ EaðClÞ ¼ 3:93 eV, which is an upper limit. This interpretation suggests that two curves participate in the dissociation. In the case of the chloroalkanes there is a region at low temperatures with a low slope. These data points cannot be explained with a single state [1, 5].
From the data in Table 11.1 the consistency of A1 is apparent. If we assume a constant A1 about equal to the DeBroglie A1, and with relative molar responses of similar compounds in the ECD at the same temperature, the activation energy for thermal electron attachment can be obtained from E1x Eref ¼ RTðlnðRref =RX ÞÞ. This is only applicable to alkyl chlorides, bromides, or iodides. The activation energy of dissociative reactions for alkylfluorides is too large to be observed in the ECD.
Shown in Table 11.2 and 11.3 are the log (relative responses) and activation energies and bond dissociation energies obtained from this analysis [11–14]. The

ALKYL HALIDES |
271 |
TABLE 11.2 Thermodynamic Properties for Dissociative Electron Attachment to Alkyl Halides from ECD Data at 373 K (in eV)
Compound |
|
|
DðR XÞ |
DðR XÞ |
|
R X |
E1 ECD |
EaðXÞ |
in the Literature |
ECD (463 K) |
ln(RR) ECD |
CHF2 Cl |
0.45 0.10 |
3.616 |
— |
3.52 0.10 |
2.30 |
C2F5 Cl |
0.33 0.10 |
3.616 |
3.60 |
3.40 0.10 |
5.13 |
1,1C2F4Cl Cl |
0.21 0.10 |
3.616 |
— |
3.28 0.10 |
8.81 |
CF2Cl Cl |
0.16 0.10 |
3.616 |
3.31 |
3.23 0.10 |
10.30 |
CHCl2 Cl |
0.16 0.02 |
3.616 |
3.30 |
3.23 0.10 |
10.41 |
CF3 Br |
0.12 0.10 |
3.365 |
3.05 |
2.94 0.10 |
11.37 |
1,2,2C2F3Cl2 Cl |
0.11 0.10 |
3.616 |
— |
3.18 0.10 |
11.98 |
CF3CHCl Br |
0.07 0.10 |
3.365 |
2.85 |
2.89 0.10 |
12.89 |
C3F7 I |
0.06 0.10 |
3.057 |
2.17 |
2.57 0.10 |
13.30 |
1,2C2F4Br Br |
0.06 0.10 |
3.365 |
— |
2.88 0.10 |
13.55 |
CHBr2 Br |
0.06 0.10 |
3.365 |
2.84 |
2.86 0.10 |
13.81 |
CFCl2 Cl |
0.04 0.10 |
3.616 |
3.17 |
3.11 0.10 |
13.99 |
CF2Br Br |
0.03 0.10 |
3.365 |
2.84 |
2.83 0.10 |
14.34 |
CCl3 Cl |
0.02 0.10 |
3.616 |
3.08 |
3.09 0.10 |
14.60 |
1,2 C2F4I I |
0.00 0.10 |
3.055 |
— |
2.50 0.10 |
15.20 |
uncertainties in the E1 are nominally 0.10 eV. The deviation between the values determined using multiple data points given in Table 11.1 and the singletemperature data in Tables 11.2 and 11.3 is less than 0.05 eV. The dissociation energies are approximately the same for the primary RX compounds. The values for the bromo and iodo compounds are lower than for the chlorocompounds.
TABLE 11.3 Thermodynamic Properties for Dissociative Electron Attachment to Alkyl Halides from ECD Data at 463 K (in eV)
Compound |
|
|
DðR XÞ |
DðR XÞ |
|
|
R X |
E1 ECD |
EaðXÞ |
in the Literature |
ECD |
(463 K) |
ln(RR) ECD |
C4H9 Cl |
0.58 0.10 |
3.616 |
— |
3.65 |
0.10 |
0.00 |
C5H9 Cl |
0.58 0.10 |
3.616 |
— |
3.65 |
0.10 |
0.00 |
C6H13 Cl |
0.58 0.10 |
3.616 |
— |
3.65 |
0.10 |
0.09 |
C8H17 Cl |
0.57 0.10 |
3.616 |
— |
3.64 |
0.10 |
0.47 |
2-C4H9 Cl |
0.55 0.10 |
3.616 |
— |
3.62 |
0.10 |
0.69 |
t-C4H9 Cl |
0.48 0.10 |
3.616 |
— |
3.54 |
0.10 |
2.48 |
1,4C4H8Cl Cl |
0.47 0.10 |
3.616 |
— |
3.53 |
0.10 |
2.71 |
1,1C4H8Cl Cl |
0.39 0.10 |
3.616 |
— |
3.46 |
0.10 |
4.70 |
1,2C2H4Cl Cl |
0.37 0.10 |
3.616 |
— |
3.44 |
0.10 |
5.25 |
C3H7 Br |
0.36 0.10 |
3.365 |
— |
3.18 |
0.10 |
5.54 |
C4H9 Br |
0.36 0.10 |
3.365 |
— |
3.18 |
0.10 |
5.63 |
CHCl2 Cl |
0.14 0.02 |
3.616 |
3.30 |
3.21 |
0.10 |
11.00 |
C4H9 I |
0.12 0.10 |
3.055 |
2.15 |
2.52 |
0.10 |
11.40 |
1,1C2H4Br Br |
0.12 0.10 |
3.365 |
— |
2.83 |
0.10 |
11.61 |
CCl3 Cl |
0.06 0.10 |
3.616 |
3.08 |
3.13 |
0.10 |
12.90 |

272 THERMAL ELECTRONS AND ENVIRONMENTAL POLLUTANTS
TABLE 11.4 Thermodynamic Properties for Dissociative Electron Attachment to Alkyl Halides from Rate Constants at 298 K (in eV)
Compound R X |
E1 Rates |
EaðXÞ |
E1 ECD |
DðR XÞ Rates |
ln(RR) Rates |
CH3 Cl |
0.48 0.10 |
3.616 |
0.54 |
3.55 0.10 |
0.00 |
CF3 Cl |
0.39 0.10 |
3.616 |
0.25 |
3.46 0.10 |
3.50 |
CHF2 Cl |
0.38 0.10 |
3.616 |
0.45 |
3.45 0.10 |
4.21 |
CHFCl Cl |
0.37 0.10 |
3.616 |
0.25 |
3.44 0.10 |
6.21 |
CH2Cl Cl |
0.29 0.10 |
3.616 |
0.33 |
3.36 0.10 |
7.36 |
CH3 Br |
0.29 0.10 |
3.365 |
0.25 |
3.10 0.10 |
7.41 |
1,1C2H4Cl Cl |
0.25 0.10 |
3.616 |
— |
3.32 0.10 |
8.85 |
1,2C2H4Cl Cl |
0.24 0.10 |
3.616 |
0.38 |
3.31 0.10 |
9.27 |
CH3CHCl Cl |
0.20 0.10 |
3.616 |
— |
3.27 0.10 |
10.59 |
CH3CCl2 Cl |
0.16 0.10 |
3.616 |
— |
3.23 0.10 |
12.36 |
CF2Cl Cl |
0.14 0.10 |
3.616 |
0.15 |
3.21 0.10 |
13.12 |
CHCl2 Cl |
0.12 0.02 |
3.616 |
0.14 |
3.19 0.10 |
13.81 |
1,1C2F4Cl Cl |
0.11 0.10 |
3.616 |
— |
3.18 0.10 |
14.28 |
CF3CFCl Cl |
0.09 0.10 |
3.616 |
— |
3.16 0.10 |
15.11 |
CF2ClCFCl Cl |
0.08 0.10 |
3.616 |
— |
3.14 0.10 |
15.42 |
CH3 I |
0.04 0.02 |
3.055 |
0.03 |
2.54 0.10 |
16.96 |
CFCl2 Cl |
0.01 0.10 |
3.616 |
0.01 |
3.08 0.10 |
18.01 |
C2F3Cl2 Cl |
0.01 0.10 |
3.616 |
— |
3.08 0.10 |
18.35 |
CCl3 Cl |
0.00 0.10 |
3.616 |
0.00 |
3.07 0.10 |
18.57 |
Although dissociative thermal electron attachment has been studied by many different techniques, the ECD method is the only one that has been extensively applied to reactions at 1 atm pressure as a function of temperature. Other procedures give values for the rate constants that agree with those obtained from the ECD at a specified temperature. To predict the temperature dependence of the rate constants determined by other methods, the single-point data relationship is applied to data in the literature. The ln of the relative rate constants are given in Table 11.4 [15]. The activation energies agree well with those values obtained with the ECD, as seen in Table 11.4. The largest difference is 0.14 eV, while the standard deviation is0.1 eV. These represent another determination of the bond dissociation energies using the linear correlation. For reactions with responses that are close to the maximum values, the rate constants are given by the DeBroglie A1 value and the E1 are small.
11.2.3Alkyl Fluorocompounds
Some of the above alkyl halides contain fluorine. In the case of CF3Cl the activation energy indicated that two negative-ion curves contribute to the dissociative thermal electron attachment. In 1997 S. R. Sousa and S. E. Bialkowski carried out a classic study of the ECD temperature dependence of alternative fluorocarbon freon replacements [16]. The study used a commercial ECD and the fundamental concepts discussed in this book to obtain rate constants and energies for compounds. One of these, CF2Cl2, was used as an internal standard in all the measurements. The
ALKYL HALIDES |
273 |
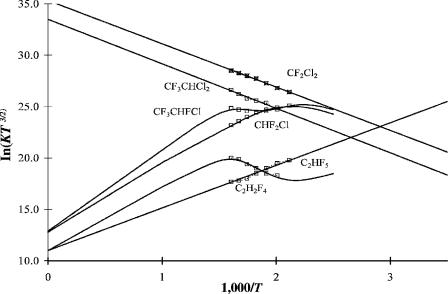
Figure 11.3 Plots of ECD data as ln KT3/2 versus 1,000/T for freon substitutes [16]. The parameters are given in Table 11.5. The analysis appears in this work.
data were analyzed in terms of either dissociative or nondissociative capture because the multistate model had not been presented. The basic classification of the compounds from Figure 11.3 is as follows: (1) CCl2F2 (CFC-12), CF3CHCl2 (HCFC123), and CF3CHF2 with only a single negative slope; (2) CHClF2 (HCFC-22), CF3CH2F (HFC134a) with only a single positive slope; and (3) CF3CHClF with two slopes. These responses have been converted to absolute electron capture coefficients by scaling to the response for CF2Cl2 and adjusting for the relative molar responses reported at 573 K.
The molecules with two chlorines on a single carbon are analogous to methylene chloride and have similar E1 and A1 values. The reported activation energies for CCl2F2 and CF3CHCl2 are 0.28 eV and 0.32 eV, respectively. The value for CCl2F2 is 0.15 eV higher than the value previously determined at lower temperatures in Table 11.1. Indeed, the higher value gives a C Cl bond dissociation energy of 3.34 0.10 eV, as compared to the value of 3.30 eV to be found in the literature. This suggests that the lower-temperature data partly result from molecular ion formation with an Ea of about 0.4 eV. The negative slope of the data for CF3CHCl2 gives the C Cl bond energy of 3.40 eV. It is also consistent with an Ea of approximately 0.5 eV.
The two molecules with a single positive slope (CHClF2 and CF3CH2F) and the one with two slopes (CF3CHF2) indicate nondissociative thermal electron attachment. The negative slope for the latter is the activation energy for electron attachment to the ground state. There are no reasonable dissociative pathways.

274 THERMAL ELECTRONS AND ENVIRONMENTAL POLLUTANTS
TABLE 11.5 ECD and NIMS Parameters for Freon Substitutes and Fluorocarbons [16]
Compound |
E1 (eV) |
ln(A1) (eV) |
Ea (eV) |
Qan |
Ea(Lit) (eV) |
CCl2F2 |
0.28 |
36 |
— |
— |
— |
CF3CHCl2 |
0.32 |
34 |
— |
— |
— |
CHClF2 |
0.35 |
33.9 0.5 |
0.50 0.15 |
1 |
0.28 |
CF3CHClF* |
0.37 |
33.9 0.5 |
0.60 0.15 |
1 |
— |
CF3CHClF |
0.23 |
33.9 0.5 |
0.50 0.15 |
1 |
— |
CF3CHF2* |
0.57 |
33.9 0.5 |
0.45 0.15 |
0.2 |
— |
CF3CHF2 |
0.09 |
33.9 0.5 |
0.26 0.15 |
0.2 |
— |
CF3CH2F |
0.01 |
33.9 0.5 |
0.38 0.15 |
0.2 |
0.45 |
CF3C6F11 |
0.03 |
34.9 0.5 |
1.06 0.05 |
1.1 |
1.07 |
CF3C5F9 |
0.04 |
35.0 0.5 |
1.02 0.05 |
1.0 |
— |
* Excited state.
The negative slope for CF3CHClF may also be an activation energy for attachment to the ground state. The positive slope indicates stable negative-ion formation. The data for CHClF2 were analyzed to yield an Ea of 0.28 eV. However, this is a lower limit because the intercept is high. As shown in Figure 11.3, the use of a Q value of 1 gives a higher Ea of 0.5 eV. By using two states, a curve for CF3CHClF is constructed with an Ea of 0.5 eV and 0.55 eV. If Q < 0.1, the Ea of CF3CH2F is 0.45 eV, as reported. If Q ¼ 0.1, the Ea is 0.35 eV. The curve drawn through the data uses two states, Q ¼ 0.5 and E1 ¼ 0.37 eV, for CF3CHF2 and Ea of 0.35 eV and 0.40 eV.
Table 11.5 lists the electron affinities and activation energies obtained using two states and nominal intercepts. The larger uncertainties in the electron affinities reflect possible systematic uncertainties due to the values of Q. The Ea are confirmed by the CURES-EC calculations. These are the only measurements of a positive valence-state electron affinity of the fluoroethanes and chlorofluoroethanes. The parent negative ion of C4F10 has been observed and the Ea of CF2Cl2 measured as 0.4 eV [8]. The values in Table 11.5 are thus reasonable.
11.2.4Electron Affinities of the Alkyl Halides
The electron affinities of the alkyl and cycloalkyl halides reported in the NIST tables are tabulated and evaluated in Appendix II. The NIST value is returned by a sequential search, using CX, CClF, or CHX. In some cases two values that differ by more than the uncertainty have been reported so excited-state values can be assigned. Many of the Ea have only been measured by one technique; thus, the experimental values could refer to an excited state.
The electron affinities of C2Cl6, CBr4, CCl4, CHCl3, and CH2Cl2 have been measured using the magnetron method. The value for C6Cl6 is lower than for CHCl3, but the CURES-EC value given in Table 10.1 is the same as for CCl4. Therefore, the ground-state value is estimated to be 1.80(15) eV. The AMB Ea for CCl4 confirmed the magnetron value and provide estimates of the electron affinities for CF2Cl2, CFCl3, CF3X, and CH3I. The AMB Ea for CFCl3 was confirmed by TCT studies.

ALKYL HALIDES |
275 |
It is 1.0 0.3 eV that is lower than the value obtained for CHCl3 and consequently could exist for an excited state. We estimate the ground-state Ea of all the fully halogenated compounds to be larger than the experimental values obtained through AMB, except for CF3I. Excited-state values have been measured for CCl4 and CHCl3 in TCT studies. The AEa is approximately 2 eV for CBr4 and CCl4 [7–10, 17–20].
The electron affinities of the chloroethylenes and two bromoethylenes have been measured using the ECD. Both the halogen negative ions and parent negative ions are observed. The electron affinities of C2Cl4 and C2HCl3 measured in NIMS are verified using E1/2 values. The NIMS data for these compounds are shown in Figure 5.12. The ECD values are assigned to excited states. By analogy the adiabatic electron affinities of C2H2Cl2 are estimated to be 0.15 eV to 0.25 eV and that of vinyl chloride to be 0.1 0.05 eV [21–23]. These values are confirmed by CURES-EC.
The electron affinity of perfluromethylcyclohexane, C7F14, has been measured by thermal charge transfer studies. The electron affinity of perfluorocyclobutane has been measured by the TCT, kinetic equilibrium, and endothermic charge transfer methods. Two values were reported: 1.05 0.1 eV and 0.6 0.02 eV. The lower value was assigned to an isomer, but could also be for an excited state. Interestingly, both these values are higher than the 0.4 0.3 eV obtained from endothermic charge transfer studies, indicating multiple bound states [24–26].
The electron affinity of C7F14 can be determined from unpublished API-MS data for the parent negative ion. These data are shown in a plot of ln KT3/2 versus 1000/T for C7F14 in Figure 11.4. The good fit is apparent. The ln(A1) is 34.9(2); the Qan is
Figure 11.4 Plots of NIMS data as ln KT3/2 versus 1,000/T for perfluoromethylcyclohexane C7F14. Similar data are available for C6F12, perfluoromethylcyclopentane. The Ea and Qan values are given in Table 11.5. The analysis appears in this work.
276 THERMAL ELECTRONS AND ENVIRONMENTAL POLLUTANTS
1.1(2); the E1 is 0.03 0.01 eV, while the Ea is 1.06(5). The Ea agrees with the TCT value and the kinetic parameters support measurements of the rate constant for thermal electron attachment [27, 28]. For perfluoromethylcyclopentane, C6F12 (m=z ¼ 300), the parameters are ln(A1) ¼ 35.0(2); Qan ¼ 1.0(2); E1 ¼ 0.04(1) eV, and Ea ¼ 1.02(5). These values are given in Table 11.5. There are no other values for these parameters in the literature. The activation energy for the formation of the [M F]( ) by dissociation from the ground state is 1.35 0.10 eV. With the electron affinity of the radical, 3.9 eV, the C F bond dissociation energy is 4.15(10) eV ¼ (1.35 1.06 ¼ 3.9). The comparable activation energy from perfluromethylcyclopentane is 1.35(10) eV. Assuming the same bond dissociation energy, Ea(C6F11) is 4.15 1.35 þ 1.02 ¼ 3.92(15) eV.
11.3AROMATIC HALIDES
11.3.1Electron Affinities of Fluoroand Chlorobenzenes
The electron affinities of C6F6 have been determined by seven different methods. The TCT and kinetic equilibrium methods give 0.5(1) eV. The ECD, PES, NIMS, and a second TCT method yield 0.86 eV. The magnetron and endothermic charge transfer values are 1.20(15) eV and 1.8(3) eV. The ECD value of 0.86(2) eV is the most precise. Ten independent ECD determinations by different investigators using different equipment produced this value. A TCT study bracketed the Ea of C6F6 between that of benzophenone and nitrobenzene or 0.85(15) eV. The magnetron value overlaps the ECD value at twice the nominal uncertainty. The endothermic charge transfer value with a lower limit of 1.2 eV is a high outlier. The reduction potential and CURES-EC values support the ECD value of 0.86 0.02 eV. The lower value can be assigned to an excited state. Two states are observed in the ECD data. The ECD Ea of C6F5H is 0.73(5) eV. A lower limit of 0.4 eV has been obtained from TCT measurements. The TCT Ea of perfluorotoluene, C7F8, is 0.86(10) eV. This is the same as for the ground state of C6F6. The substitution of a CF3 group increases the Ea by about 0.4 eV. The ground-state Ea should be about 0.73 þ 0.4 ¼ 1.15 eV. The CURES-EC value is 1.3(1) eV. The endothermic charge transfer Ea is 1.7(3) eV [26, 28–34]. Thus, we propose that the TCT Ea is for an excited state and the AEa is 1.0 0.2 eV.
In the 1960s ECD data for the mono, di, and tetra fluorobenzenes were obtained but not published because of the unexplained structure in the data. We have analyzed the ECD data for all the fluorobenzenes using two states and report on their electron affinities. Figure 11.5 provides the ECD data. Table 11.6 lists the ECD parameters. The ln(A1i), 34.5 to 36.5, are within an order of magnitude of ln(DeBA) ¼ 36. The Q values are within the observed range of 10 4 to 1 [35]. The CURES-EC calculations agree with the AEa. The electron affinities range from 0.13(5) eV to 0.86(2) eV for C6F6. There is a regular change in the Ea values with the number of fluorine atoms. Each fluorine replacement increases the Ea by about 0.15 eV. These values are supported by experimental reduction potentials [36].