

Chen The electron capture detector
.pdfINTRODUCTION 297
In Chapter 9 the ECD data for NO and O2 were analyzed in terms of multiple negative ion states. Because the A Ea of NO was considered to be less than 0.1 eV, no stable bound excited states of NO(–) have been previously considered. The isoelectronic principle and the measurement of higher Ea by three independent techniques support the postulate of stable bound excited states of NO(–). Figure 12.1 presents a comparison of the states for the isoelectronic NO(–) and O2. By analogy at least three bound states of NO(–) are predicted [3].
R. R. Freeman collected the original ECD data for O2 and NO in the 1970s. The ECD results were not published because it was believed that there were no stable excited anion states for these molecules and because the change in slope was not understood [4]. Later the low-temperature data were published as an example of the use of the ECD to determine Ea [5]. The high-temperature data were not published until 2002 when multiple states for anions in the ECD were considered. Other data showing the excited states of O2(–) and the recognition that 12 of the 24 predicted states of O2(–) were bound and stable led to the assignments previously given in Chapter 9 [3, 6, 7].
The ECD data for NO shown in Chapter 9 were resolved into four curves, three of which are predicted by analogy to the three states of O2 shown in Figure 12.1. The largest value of the Ea, 0:85 0:1 eV, has been measured by the MGN, EI, and ECD techniques and can be accurately assigned to the ground state. The remaining
Figure 12.1 Morse potential energy curves for NO( ) and O2 illustrating the similar electronic structure of the isoelectronic species.
298 BIOLOGICALLY SIGNIFICANT MOLECULES
ECD values and the Ea of less than 0.1 eV determined by PES and other experimental techniques require further theoretical predictions to be accurately assigned. It is clearly important to consider all the experimental Ea for both O2 and NO so that values differing by more than the uncertainty are assigned to different states.
The present situation for the electron affinities of adenine, guanine, cytosine, uracil, and thymine (AGCUT) is similar to that for NO. Prior to 1990 the electron affinities had not been measured. Indeed, theoretical calculations of the valencestate Ea alternated between positive and negative [8, 9]. Presently the Ea of the purines and pyrimidines are measured using reduction potentials and scaling to gas phase values. These Ea are confirmed by the CURES-EC calculations [10–20]. These are assigned to the AEa, but the existence of excited valence states is not generally recognized. The values for C, U, and T have been confirmed by PES of the respective anion hydrates, Ah-PES [21–24]. Scaled ab initio and density functional calculations give values that confirm the Ea for the pyrimidines [25, 26]. The vertical Ea for C and T and AGCUT have been measured [27, 28]. In the NIST tables only the dipole bound Ea of AGCUT are given. The energies for the hydrated excited-state anions listed in NIST appear in the appendix [21–24, 29].
The general method for estimating the electron affinities of biologically significant molecules from solution energy differences and half-wave reduction potentials, the use of CURES-EC, and substitution and replacement effects are reviewed and applied to other molecules. The electron affinities of heterocyclic aromatic molecules listed in the NIST tables, including acridine, have been determined by TCT measurements and are evaluated [16, 29]. The Ea for halogenated uracils have been calculated by density functional methods and are calculated using CURES-EC [30, 31].
The gas phase acidities of AGCUT have been estimated from negative-ion mass spectra and that of U has been measured by TCT experiments [32, 33]. By consolidating electron impact, electron transmission, and NIMS data and by calculating bond dissociation energies, Morse potential energy curves have been constructed in the N H and C NH2 dimensions for C and only the N H dimension for T. We review these curves [7, 26]. The gas phase acidities and electron affinities of AGCUT have been calculated by CURES-EC and standard AM1 and PM3 procedures. The experimental and CURES-EC GPA are revised based on the determinations of the GPA of uracil [32–36]. The gas phase acidities of halogenated uracils are calculated by CURES-EC.
At present there are no experimental values for the electron affinities of the amino acids. The gas phase acidities of alanine, glycine, and histidine have been measured and the Ea of the corresponding radical determined. This follows the procedure first used to determine the Ea of the acetate radical [37–42]. These values are verified using CURES-EC. Predictions of the GPA for representative amino acids are made.
The values of the electron affinities and rate constants for thermal electron attachment to the purines, pyrimidines, and heterocyclic compounds can be used to predict the temperature dependence of the ECD and NIMS response. These are similar to those made for the chlorinated biphenyls and naphthalenes in
ELECTRON AFFINITIES OF PURINES AND PYRIMIDINES |
299 |
Chapter 11. By analogy to the ECD data for the esters of simple acids, the ECD temperature dependence for derivatives of the amino acids is predicted. The temperature dependence of derivatives used to analyze nucleic acids and amino acids will be estimated based on the calculated data for the parent compounds and reported minimum detectable amounts [43–48].
Once the Ea of the purines and pyrimidines were measured and confirmed by the CURES-EC method, other fundamental questions involving the purines and pyrimidines and DNA were investigated. These are the electron affinities of the hydrogenbonded base pairs; the conduction of electrons by DNA; the role of electron bound complexes in radiation damage in DNA; the change in geometry upon electron addition to DNA, and the difference between the electron affinity of guanine and adenine in the hydrogen-bonded form and the isolated global minimum [49–55]. These calculations were made using the commercial software and PCs available in 1998 [49, 50]. The electron affinities of GC and AT were calculated by density functional procedures in 2002 and 2003 [51–54]. These values are compared with those predicted by CURES-EC.
12.2ELECTRON AFFINITIES OF PURINES AND PYRIMIDINES
12.2.1Predictions of Electron Affinities
Before 1990 there were no accurate experimental or theoretical values for the Ea of AGCUT. It was recognized that ionization potentials and electron affinities were important to charge transfer in biological processes, but there were three potential measures of the Ea. These were donor acceptor complex data, reduction potentials, and theoretical calculations, each of which resulted in different measures of the Ea. Much of our work during the past decade has attempted to reconcile these differences.
In 1975 the anion of T was observed in a mass spectrometer, indicating a positive valence-state Ea for T. In 1990 the Ea of AGCUT were predicted using substitution, replacement, and conjugation effects [10–14]. In order to estimate the Ea of substituted compounds, that of the parent compounds is required. In 1974 I. Nenner and G. J. Schulz estimated the A Ea of quinoline (0.36 eV), pyradazine (0.40 eV), pyrimidine (0.00 eV), pyrazine (0.40 eV), and s-triazine (0.45 eV) from electron transmission spectra and half-wave reduction potentials [15]. No adiabatic electron affinities of aromatic nitrogen heterocyclic compounds were measured in the gas phase before 1989 [16].
In 1990 the A Ea for C, U, and T were predicted to range from 0.6 eV to 0.75 eV, while the A Ea of A and G were predicted to be higher. These estimates were based on an Ea of 0.3 eV for pyrimidine and the observation that C, U, and T are hydro- xyl-, methyl-, and amino-substituted pyrimidines. From the data for pairs of molecules shown in Table 12.1, quantitative measures of the substitution, conjugation, and replacement effects were postulated. The replacement of a CH by N in an aromatic system increases the Ea by 0.2 eV to 0.8 eV. The substitution of a hydroxyl

300 BIOLOGICALLY SIGNIFICANT MOLECULES
TABLE 12.1 Substitution and Replacement Effects on Electron Affinities [10–12, 15–20]
Molecule |
Ea (eV) |
Method |
Effect |
Benzene C6H6 |
0.73(10) |
E1=2 |
Parent |
Pyridine C5H5N |
0.00(20) |
E1=2, ECD |
CH to N |
Nitrobenzene C6H5NO2 |
1.00(1) |
Many |
Parent |
Nitroaniline C6H6N2O2 |
0.95(10) |
TCT |
NH2 sub |
Benzonitrile C7H5N |
0.28(5) |
ECD |
Parent |
Cyanopyridine C6H5N2 |
1.05(5) |
E1=2 |
CH to N |
Naphthalene C8H10 |
0.16(2) |
ECD |
Parent |
Quinoline C7H9N |
0.50(5) |
E1=2 |
CH to N |
Hydroxyquinoline C7H8NO |
0.85(5) |
E1=2 |
OH sub |
Phenanthrene C14H10 |
0.30(2) |
ECD |
Parent |
Benzoquinoline C13H9N |
0.50(15) |
ECD |
CH to N |
Anthracene C14H10 |
0.68(2) |
ECD |
Parent |
Acridine C13H9N |
0.91(10) |
TCT |
CH to N |
Pyradazine C4H4N2 |
0.31(5) |
E1=2 |
CH to N |
Pyrimidine C4H4N2 |
0.20(5) |
E1=2 |
Parent |
Pyrazine C4H4N2 |
0.36(5) |
E1=2 |
CH to N |
as-Triazine C3H3N3 |
0.90(5) |
E1=2 |
CH to N |
Acetophenone C8H8O |
0.338(2) |
ECD |
Parent |
Hydroxyacetophenone |
0.77(5) |
ECD |
OH sub |
Purine |
1.04(5) |
E1=2 |
Parent |
group increases the Ea by about 0.3 eV to 0.5 eV, while the methyl and amino groups have a small effect on the Ea. Since G and A are substituted purines and related to C and T by extension of the aromatic system, their Ea should be larger than those for C, U, and T. The Ea of purine was later estimated to be 1 eV so the Ea of adenine and guanine are predicted to be 1.0 eV and 1.3 eV [10].
12.2.2Electron Affinities from Reduction Potentials
Once the predictions were in place, the next step was to measure the Ea. They were obtained by measuring the half-wave reduction potentials of the bases. These relative values were scaled to measured gas phase values for acridine and anthracene [11]. To validate the experimental procedure, the Ea for molecules with different solution energy differences and experimental gas phase electron affinities were determined. These values all agreed with values found in the literature within the experimental uncertainty of 0.03 V. Recall that the general classes of charge densities, q and G, are [EL, 0,1.7]; [F, 0.05, 1.8]; [A, 0.2, 2.0]; [B, 0.4, 2.2];
[C, 0.6, 2.4]; [D, 0.8, 2.6]; [EH , 1, 2.7]; and Ea ¼ Eref 2:20 nð0:20Þ þ E1=2, where 2:20 nð0:20Þ is G (see Chapter 7). Thus, the G for anthracene
and acridine are different from those of the nitrocompounds by about 0.4 eV, the difference between groups Aðn ¼ 1Þ and Cðn ¼ 1Þ. The localized charge densities in anions of A, G, C, U, and T are about the same as for the acridine anion so the

|
ELECTRON AFFINITIES OF PURINES AND PYRIMIDINES |
301 |
|||||
TABLE 12.2 Reduction Potentials and Electron Affinities [1 12, 15 20] |
|
|
|||||
|
|
E1=2 |
E1=2 |
|
|
Constanta |
|
|
|
|
|
|
|
||
Compound |
Ea |
(V vs. Ag/AgCl) |
Ea (eV) |
Ea (eV) |
|
(eV) |
|
Anthracene |
0.68(2) |
1.93 |
1.96 |
0.69 |
0.66 |
|
2.62 |
Acridine |
0.91(10) |
1.57 |
1.57 |
0.91 |
0.91 |
|
2.48 |
Nitrobenzene |
1.00(2) |
1.11 |
1.10 |
1.00 |
1.01 |
|
2.11 |
m-Nitrotoluene |
0.98(5) |
1.13 |
1.12 |
0.98 |
0.99 |
|
2.11 |
o-Nitrotoluene |
0.90(5) |
1.17 |
1.16 |
0.89 |
0.90 |
|
2.06 |
p-Nitrotoluene |
0.95(5) |
1.23 |
1.22 |
0.94 |
0.95 |
|
2.17 |
Pyridazine |
0.31(5) |
2.17 |
2.16 |
0.31 |
0.32 |
|
2.48 |
Pyrazine |
0.36(5) |
2.12 |
2.09 |
0.36 |
0.39 |
|
2.48 |
s-Triazine |
0.47(5) |
2.01 |
2.02 |
0.47 |
0.46 |
|
2.48 |
as-Triazine |
0.91(5) |
1.57 |
— |
— |
0.91 |
|
2.48 |
s-Tetrazine |
1.67(5) |
0.81 |
— |
— |
1.67 |
|
2.48 |
Pyrimidine |
0.19(5) |
2.29 |
2.32 |
0.19 |
0.16 |
|
2.48 |
Cytosine |
0.56(5) |
1.92 |
— |
0.56 |
— |
|
2.48 |
Uracil |
0.80(5) |
1.68 |
— |
0.80 |
— |
|
2.48 |
Thymine |
0.79(5) |
1.69 |
— |
0.79 |
— |
|
2.48 |
Purine |
1.02(5) |
1.46 |
1.44 |
1.02 |
1.04 |
|
2.48 |
Adenine |
0.95(5) |
1.53 |
1.59 |
0.95 |
0.89 |
|
2.48 |
Guanine |
1.51(5) |
0.97 |
— |
1.51 |
— |
|
2.48 |
aEa ¼ Eref mddG þ E1=2 ¼ constant þ E1=2; Eref ¼ 4:58, and mddG ¼ 2:1 for the purines and pyrimidines. The constant is 4:58 2:1 ¼ 2:48.
G was set to 2.1 eV. The specific value of Eref 2:20 nð0:20Þ for the purines and pyrimidines is Ea ¼ 4:58 2:10 þ E1=2 ¼ 2:48 þ E1=2.
The electron affinities of AGCUT were obtained by scaling to all the reference compounds since the G values for the nitro compounds and anthracene agreed with those that had been determined previously. The experimental data defining these Ea are shown in Table 12.2. The first column contains the evaluated values of the Ea for the reference compounds. The second column gives the experimental reduction potentials used to determine the Ea of AGCUT. In the third column the values of the reduction potentials scaled to the Ag/AgCl electrode value for acridine in DMSO, those available in the literature, are given. The specific electrode supporting the electrolyte and solvent is important for obtaining accurate Ea values. The next two columns contain the Ea values obtained by using Ea ¼ Eref –G þ E1=2. The values in the last column are Eref – G. For example, for the purines and pyrimidines the Ea ¼ 2:48 þ E1=2 ¼ 2:48 0:97 ¼ 1:51 eV for guanine. The agreement between the Ea obtained from the reduction potentials found in the literature and the values determined in our study is good. The E1=2 for adenine ( 1.59 V versus Ag/AgCl) and purine ( 1.44 V versus Ag/AgCl) give independent Ea for adenine: Ea(adenine) ¼ 2:48 1:59 ¼ 0:89(10) eV and Ea(purine) ¼ 2:48 1:44 ¼ 1:04(10) eV. These Ea are the largest precise values and are selected as the AEa.
302 BIOLOGICALLY SIGNIFICANT MOLECULES
Subsequently published E1=2 (V versus NHE, in dimethylformamide) for the ribonucleosides are A, 2.57; C, 2.26 ; U, 2.04; T, 2.15, and purine, 1.84 ( 0.05 V) [17]. If we assume the Ea of rpurine is 1.04 eV, these give rC, 0.62; rU, 0.84, and rT, 0.73 ( 0.1 eV), the same as for C, U, and T. The (rA) is 0.31 0.1 eV, supporting an excited state for rA( ). These are the only experimental Ea for the ribonucleosides [17]. It should be noted that the Ea of ribonucleoside is primarily determined by the base.
12.2.3Gas Phase Measurements of Electron Affinities
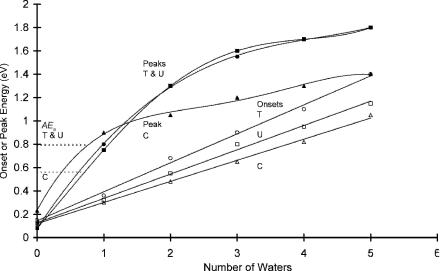
The PES of dipole bound U and valence-state anion complexes with Xe, Kr, and one water molecule were reported in one study. The PES of dipole bound C, T, and U and their anion hydrate complexes for n ¼ 1 to 5 were observed in another [23, 24]. In the bare anion the major peak occurs for the dipole bound anion, but other small peaks are observed at higher energies. In the U Xe( ) PES ‘‘valencestate’’ peaks are observed at 0.35, 0.5, 0.65, 0.8, and 0.9 eV. In the spectra of the hydrates valence states are also observed but with greater intensities. The onsets and peaks for the U H2O( ) are different in the two studies. In the first one the peak occurs at 1.0 eV and the onset at 0.5 eV, while in the second the peak is at 0.8 eV and the onset at 0.4 eV [21–24]. By assigning the peak to the Ea of the monohydrate and subtracting the hydration energy of 0.2 eV, the Ea of U are 0.8 eV and 0.6 eV, respectively. In the series of multihydrated anions the onsets and peaks increase with the number of water molecules, as shown in Figure 12.2. The peaks for cytosine occur initially at higher energies than the peaks for U and T
Figure 12.2 Onsets and peaks for the photoelectron spectra of the anion hydrates of cytosine, thymine, and uracil. From [24].
ELECTRON AFFINITIES OF PURINES AND PYRIMIDINES |
303 |
but drop off sooner. This indicates the establishment of a shell at two or three water molecules for cytosine but four or five for U and T [24]. The energies are given in the appendix.
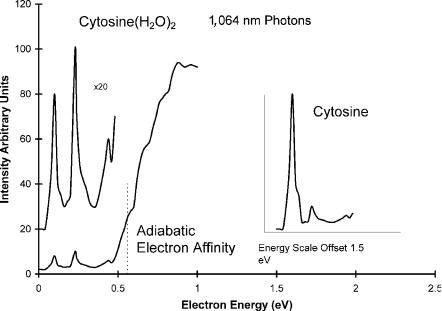
For cytosine two DBEA are reported: 0.230 eV and 0.085 eV. Interestingly, the dipole bound states are observed in the PES of the dihydrates due to two-photon absorption. The first photon removes the waters and then a second photon detaches the electron from the dipole bound state. These spectra for cytosine are shown in Figure 12.3. The spectrum of the bare cytosine is shown in the inset offset by 1.5 eV. The peak at 0.230 eV is assigned to the dipole bound anion of keto-cytosine, whereas the peak at 0.085 eV is assigned to the enol form of the anion. The dipole moment of the enol form is about 4 Debye, while that for the keto form is about 6.5 Debye. The two peak intensities are quite different in the spectrum for the monomer. In the spectrum for the dihydrate the intensities are about the same. The double-photon process explains this difference. The absorption of the initial photon by the dihydrate leaves equal concentrations of two forms that are then photodetached. In the spectrum of the bare anion the distribution reflects the equilibrium concentrations. The extra structure in the spectrum of the dihydrate can be attributed to excited states of the anion and offers a different interpretation of the onset.
Since the dipole bound anions are formed by double-photon absorption, the valence states could also be formed, in which case the onsets and initial peaks results from the photodetachment of the isolated ground-state or excited-state anions. These can be a measure of the Ea. The onsets that are lower than the
Figure 12.3 Photoelectron spectra of the anion hydrates of cytosine [24].

304 BIOLOGICALLY SIGNIFICANT MOLECULES
TABLE 12.3 Electron Affinities and Excited-State Electron Affinities (in eV)
Molecule |
E1=2 |
PES |
NIST |
Uracil |
0.80(5) |
0.8, 0.7(1) |
— |
Uracil* |
— |
(0.3, 0.5)a |
— |
Uracil* |
— |
0.15(10) |
— |
Uracil-DBEA |
— |
— |
0.09(1) |
Thymine |
0.79(5) |
0.7(1) |
— |
Thymine* |
— |
(0.3, 0.5)a |
— |
Thymine* |
— |
0.12(10) |
— |
Thymine DBEA |
— |
— |
0.06(1) |
Cytosine |
0.56(5) |
0.6(1) |
— |
Cytosine* |
— |
(0.3, 0.45)a |
— |
Cytosine* |
— |
0.13(10) |
— |
Cytosine-DBEA |
— |
— |
0.09(1) |
Cytosine-DBEA |
— |
— |
0.23(1) |
Adenine |
0.95(5) |
— |
— |
Adenine-DBEA |
— |
— |
0.01(1) |
Guanine |
1.51(5) |
— |
(0.3)b |
aPeaks observed in PES but not originally assigned.
bPredicted based on the value for cytosine and the similarity of the dipole moments of cytosine and
guanine.
Excited states.
A Ea are assigned to excited states. The weighted average DBEA for U, T, and A are 0.065(7), 0.090(7), and 0.012(5) eV, respectively [21–24, 29]. The only valencestate Ea reported for the parent was obtained by extrapolation of onsets to n ¼ 0 to give Ea, and 0 eV to 0.2 eV for C, U, and T, as shown in Figure 12.2 [23]. The other onsets have been assigned to the Ea of the hydrates and are listed in the NIST tables and the appendix. The peak energies could also be attributed to the photodetachment of the hydrates and give a higher Ea. Based on the observation of excited anion states in other molecules and the peaks observed in the spectra of the isolated anions, it was postulated that excited-state Ea of 0.3 eV and 0.5 eV are observed for C, U, and T. These values are given in Table 12.3.
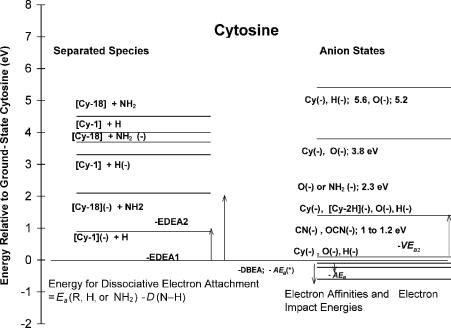
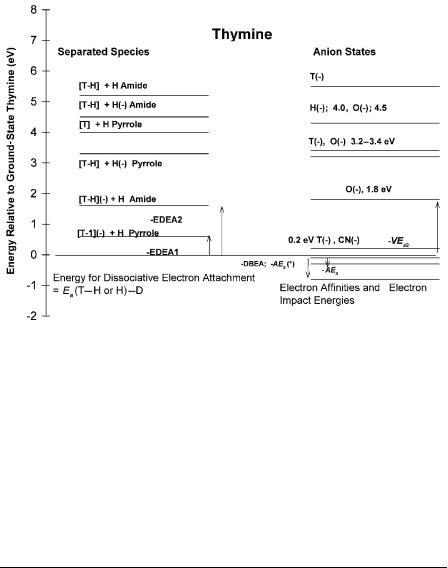
The vertical electron affinities of AGCUT have been measured by electron transmission spectroscopy and those of C and T by electron impact spectra [25, 26]. The electron transmission spectra give VEa of 0.32, 0.29, 0.54, 0.46, and 0.22 eV for C, T, A, G, and U, respectively. In the same order, the CURES-EC values are 0.2, 0.15, 0.5, 0.3 and 0.15 eV. It must be recalled that electron transmission and electron impact spectra can only give negative values of VEa. From the lowest energy peak in the electron impact distribution of the parent negative ions, the VEa are 0, or 1.40 eV for C and 0.18 eV for T. The observation of the parent negative ions in mass spectrometry at 0 eV to 0.2 eV electron energies for both C and T indicates a positive electron affinity greater than about 0.5 eV. Surprisingly, the electron impact spectra of C and T also yield parent negative-ion peaks at about 3.4 eV and 5.4 eV. These states must be valence states because they exist long enough to be recorded in the mass spectrometer. In addition to the parent negative ions fragment
ELECTRON AFFINITIES OF PURINES AND PYRIMIDINES |
305 |
Figure 12.4 Energy-level diagrams constructed for cytosine from electron affinities, electron impact and transmission data, and CURES-EC calculations. From [7, 27, 28].
ions are also observed. Energy-level diagrams can be obtained from the electron impact data, as shown in Figures 12.4 and 12.5. For example, limits to the bond dissociation energies are obtained from the onsets of various ions. These data are used to construct Morse potential energy curves for C and T to explain the parent negative-ion peaks at different energies in the electron impact spectra.
12.2.4Theoretical Electron Affinities
In 1966 a semi-empirical SCF calculation of the valence-state Ea of A, G, C, and T reported that the energies of the LUMO were positive, indicative of negative valence-state Ea in contrast to earlier calculations that indicated positive Ea [8, 9]. Indeed, up to the early 1990s and even today many theoretical calculations still predict negative valence-state Ea for G and A [26, 27]. All the calculations anticipate a small positive polarization Ea for adenine and larger positive dipole bound Ea for guanine. A comparison of the theoretical estimates for the electron affinities of AGCUT is given in Table 12.4. The only theoretical values that agree with all the E1=2 values are obtained by CURES-EC [13]. By scaling ab initio 631 þ GðdÞ==6 31 G LUMO to the AEa of naphthalene using AEa ¼ VEaþ 1:05, the Ea are found to be as follows: U, 0.9; T, 0.8; C, 0.7; G, 0.9, and A, 0.5 eV [26]. The largest unscaled density functional values are obtained with the B3P86 density functional and are the following Ea: U, 0.75; T, 0.71; C, 0.54;
306 BIOLOGICALLY SIGNIFICANT MOLECULES
Figure 12.5 Energy-level diagrams constructed for thymine from electron affinities, electron impact and transmission data, and CURES-EC calculations. From [7, 27, 28].
G, 0.36, and A, 0.01 eV. By using different functionals, lower Ea are calculated [27]. The highest values for C, U, and T agree with experimental values, but those of G and A are systematically lower than experiment by 1.1 eV and 0.5 eV. The density functional calculations all result in a change in the geometry of the anion relative to that of the neutral. However, the changes are not as large as those obtained in the CURES-EC optimization, as illustrated for the keto and enol forms of the C anions in Figure 12.6.
TABLE 12.4 Experimental and Theoretical Electron Affinities (in eV) of Purines and Pyrimidines and Halogenated Uracils
Molecule |
Experimental |
CEC |
ab initio |
Density Functional |
|
|
|
|
|
Uracil |
0.80(5) |
0.80 |
0.9 |
0.06 to 0.75 |
Thymine |
0.79(5) |
0.78 |
0.8 |
0.0 to 0.71 |
Cytosine |
0.56(5) |
0.58 |
0.7 |
0.14 to 0.54 |
Adenine |
0.95(5) |
0.94 |
0.5 |
0.66 to –0.08 |
Guanine |
1.51(5) |
1.51 |
0.9 |
0.36 to 0.36 |
5-F-uracil |
— |
1.00 |
— |
0.45, 0.48 |
5-Cl-uracil |
— |
1.14 |
— |
0.58, 0.60 |
5-Br-uracil |
— |
1.20 |
— |
0.63, 0.64 |
|
|
|
|
|