

Chen The electron capture detector
.pdfELECTRON AFFINITIES AND MORSE POTENTIAL ENERGY CURVES |
227 |
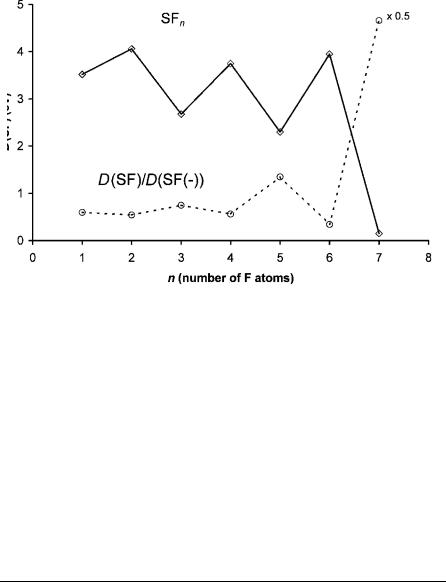
Figure 9.29 Adiabatic electron affinities of SFn . Data from [1].
state is also Mð3Þ but dissociates to a higher limit, leading to SF4( ). The two antibonding curves are Dð3Þ and Dð2Þ curves since the Ea and EDEA are positive and the VEa is negative for the curve, leading to the higher limit. The vertical transition leads to the fluoride ion for one curve and SF4( ) for the other. The anion curves in Figure 9.27 are examples of five of the eight possible HIMPEC.
The curves for SF4( ) and SF( ) shown in Figure 9.28 provide additional example HIMPEC. The ground-state curve for SF( ) is Mð3Þ. The bonding curve leading to S( ) þ F is Mð2Þ, with positive Ea and VEa but negative EDEA. The higher antibonding curve is Dð0Þ, while the lower antibonding curve is Dð2Þ. The two excited-state curves for SF4( ) are Mð2Þ and Mð0Þ curves since they lead to molecular ion formation in the vertical transition. The EDEA, Ea, and VEa are negative for the antibonding curve, while only the EDEA is negative for the bonding curve. The ground-state curve is Mð2Þ, while the complementary antibonding curve is Dð2Þ. The only HIMPEC not illustrated by the anion curves in Figures 9.28 and 9.29 is the Dð3Þ curve.
The systematic trends in the Ea, D(SF), and relative bond orders were used in these constructions. The quantities are plotted against the number of fluorine atoms in Figures 9.29 and 9.30 and given in Table 9.8. The CURES-EC values reproduce the experimental Ea. The first S F bond dissociation energy in SF5 is the weakest of all the SFn. This accounts for the relative bond order greater than 1 for the anion. The dissociation energies show minima at n ¼ 3, 5, and 7 and maxima at 2, 4, and 6. The experimental Ea illustrated in Figure 9.29 were used
228 DIATOMIC AND TRIATOMIC MOLECULES AND SULFUR FLUORIDES
Figure 9.30 Dissociation energies and relative bond order of SFn .
to calculate the curves for the excited states when available. The relative bond orders for the ground state given in Figure 9.30 are upper limits to the bond orders for the excited states [106–124].
The limitations of the two-dimensional representations must be emphasized. For example, for SF5 the geometry of the anion is very different from that of the neutral. Therefore, by showing only the S F stretching dimension, the representation is only a cut through the surface. In the case of triatomic molecules this was taken into account by showing the manner in which the neutral changes with the bond angle. In the case of these polyatomic molecules the geometric changes cannot be thus represented. In the case of more rigid molecules, such as those involving benzene rings, the dissociations in one dimension can be very effective in representing negative-ion states.
TABLE 9.8 Electron Affinities, Dissociation Energies, and Anion Bond Order SFn
Species |
Ea (eV) |
Source |
CEC (eV) |
D(S F) |
Bond Order |
SF |
2.285(6) |
PES |
2.23 |
3.52(5) |
0.60 |
SF2 |
1.6(5) |
TCT |
1.38 |
3.98(19) |
0.54 |
SF3 |
2.91(15) |
MGN |
2.81 |
2.68(10) |
0.75 |
SF4 |
1.50(20) |
TCT |
1.58 |
3.75(10) |
0.56 |
SF5 |
3.85(3) |
NIMS |
3.80 |
2.30(26) |
1.34 |
SF6 |
1.07(7) |
NIMS |
1.02 |
3.95(20) |
0.15 |
SF7 |
4.8 |
CALC |
4.7 |
0.15(10) |
9.33 |
REFERENCES 229
9.5SUMMARY
The electron affinities of the homonuclear diatomic molecules are supported by periodic trends and simple molecular orbital concepts. The negative-ions states of the Group IA, IB, VI, and VII homonuclear diatomic anions are supported by Morse potential energy curves. Six curves for F2( ) and Cl2( ), eight curves for Br2( ), and 12 curves for I2( ) are obtained. The curves for the 2 g (1/2) state of I2( ) and Br2( ) are calculated using a lower excited-state dissociation energy (0.02 eV). The curves for F2( ) are the least certain for the halogens. The other curves should remain the same as new data are obtained. The AEa are as follows: F2, 3.08; Cl2, 2.45; Br2, 2.56; and I2, 2.50 (all 0.02 eV) obtained by assuming D0(Rg2(þ)) ¼ D0(X2( )) and AEaðX2Þ ¼ D0ðX2ð ÞÞ þ AEaðXÞ D0ðX2Þ. They agree with those measured directly. A new interpretation of ECD data for Cl2, Br2, and I2 gives activation energies for thermal electron attachment E1 to two states. Recent ECD data for O2( ) confirm multiple electron affinities previously observed and define new activation energies for thermal electron attachment. Small peaks observed in published high-resolution PES for O2( ) have been assigned to closely spaced negative-ion states based on experimental Ea and the prediction of 24 states. Twelve curves leading to molecular ion formation and 12 curves leading to dissociation in a Franck Condon process were constructed for O2( ) from experimental data. Two anion curves are presented for S2( ), Se2( ), and Te2( ). The anion curves for the Group IA and IB homonuclear diatomic molecules have been constructed using experimental Ea. The relative bond order for these ground-state anions is approximately 1. The excited-state anion curves are based on theoretical curves for Li2( ).
The electron affinities of several triatomic molecules and the azide radical have been evaluated and are supported by the CURES-EC method. The molecules that are linear in the neutral and bent in the anion have been emphasized. The ECD data support two negative-ion states. Morse potential energy curves for N2O and CS2 have been constructed for the linear and bent ions. The relative energies of the anion and neutrals for CO2, COS, CS2, and N2O were presented to explain the electron attachment data. The electron affinities of the SFn molecules n ¼ 1 to 6 were evaluated and the largest values assigned to the ground state.
All the curves discussed in this chapter have been assigned to the general Herschbach ionic Morse potential curves classification. While many of these curves are speculative, they reflect the data. As stated by Robert Sanderson Mulliken in offering curves for I2 in 1971, ‘‘While the curves shown cannot possibly be quantitatively correct, they should be useful as forming a sort of zeroth approximation to the true curves.’’ [128].
REFERENCES
1.National Institute of Standards and Technology (NIST). Chemistry WebBook, 2003. Available at http://webbook.nist.gov.
230DIATOMIC AND TRIATOMIC MOLECULES AND SULFUR FLUORIDES
2.Christodoulides, A. A.; McCorkle, D. L.; and Christophorou, L. G. ‘‘Electron Affinities of Atoms, Molecules and Radicals’’ in Electron-Molecule Interactions and Their Applications. New York: Academic Press, 1984.
3.Reinstra-Kiracofe, J. C.; Tschumper, G. S.; Schaefer, H. F.; Nandi, S.; and Ellison, G. B.
Chem. Rev. 2002, 102, 231.
4.Gutsev, G. L. and Bauschlicher, C. W. J. Phys. Chem. A 2003, 107, 4755.
5.Chen, E. S. D. and Chen, E. C. M. J. Phys. Chem. A 2003, 107, 169.
6.Jones, P. L.; Mead, R. D.; Kohler, B. E.; Rosner, S. D.; and Lineberger, W. C. J. Chem. Phys. 1980, 73, 4419.
7.Zanni, M. T.; Batista, V. S.; Greenblatt, B. J.; Soep, B.; and Neumark, D. M. J. Chem. Phys. 1999, 110, 3748.
8.Chen, E. C. M. and Wentworth, W. E. J. Phys. Chem. 1985, 89, 4099.
9.Chen, E. S. and Chen, E. C. M. Chem. Phys Lett. 1998, 293, 491.
10.Chen, E. S. and Chen, E. C. M. J. Phys. Chem. A 2002, 106, 6655.
11.Ayala, J. A.; Chen, E. C. M.; and Wentworth, W. E. J. Phys. Chem. 1981, 85, 768.
12.Herschbach, D. R. Adv. Chem. Phys. 1966, 10, 250.
13.Parr, R. G. and Ayres, P. W. J. Phys. Chem. A 2002, 106, 5060.
14.Kleyn, A. W. and Moutinho, A. M. C. J. Phys. B: At. Mol. Opt. Phys. 2001, 34, R1.
15.Zanni, M. T.; Taylor, T. R.; Greenblatt, B. J.; Miller, W. H.; and Neumark, D. M. J. Chem. Phys. 1997, 107, 7613.
16.Leininger, T. and Gadea, F. X. J. Phys. B: At. Mol. Opt. Phys. 2001, 33, 735.
17.Paidarova, I. and Gadea, F. X. Chem. Phys. 2001, 274, 1.
18.Caledonia, G. E. Chem. Rev. 1975, 75, 333.
19.Pritchard, H. O. Chem. Rev. 1953, 52, 529.
20.Kurepa, M. V.; Babic, D. S.; and Belic, D. S. J. Phys. B: At. Mol. Opt. Phys. 1978, 11, 3719.
21.Kurepa, M. V.; Babic, D. S.; and Belic, D. S. J. Phys. B: At. Mol. Opt. Phys. 1981, 14, 375.
22.Azria, R.; Abouaf, R.; and Tellet-Billy, D. J. Phys. B: At. Mol. Opt. Phys. 1982, 16, L569.
23.Azria, R.; Abouaf, R.; and Tellet-Billy, D. J. Phys. B: At. Mol. Opt. Phys. 1988, 21, L213.
24.Freeman, R. R. Ph. D. dissertation, University of Houston, 1971.
25.Chen, E. S.; Wentworth, W. E.; and Chen, E. C. M. J. Mol. Struct. 2002, 606, 1.
26.Burch, D. S.; Smith, S. J.; and Branscomb L. M. Phys. Rev. 1958, 112, 171.
27.Pack J. L. and Phelps, V. Phys. Rev. Lett. 1961, 6, 111.
28.Vogt, D.; Hauffe, B.; and Neuert, H. Z. Phys. 1970, 232, 439.
29.Bailey, T. L. and Mahadevan, P. J. Chem. Phys. 1970, 52, 179.
30.Stockdale, J. A. D.; Compton, R. N.; Hurst, G. S.; and Reinhardt, P. W. J. Chem. Phys. 1969, 50, 2176.
31.Celotta, R. J.; Bennett, R. A.; Hall, J. L.; Siegel, M. W.; and Levine, J. Phys. Rev. A: At. Mol. Opt. Phys. 1972, 6, 631.
32.Schiedt, J. and Weinkauf, R. Z. Natforsch. 1995, 50a, 1041.
33.Baeda, A. P. M. Physica 1972, 59, 541.
34.Nalley, S. J. and Compton, R. N. Chem. Phys. Lett. 1971, 9, 529.
35.Tiernan, T. O.; Hughes, B. M.; and Lifschitz, C. J. Chem. Phys. 1971, 55, 5692.
36.Lacmann, K. and Herschbach, D. R. Chem. Phys. Lett. 1970, 6, 106.
REFERENCES 231
37.Sambe, H. and Ramaker, D. E. Phys. Rev. A: At. Mol. Opt. Phys. 1989, 40, 3651.
38.Bates, D. R. and Massey, H. S. W. Proc. Roy. Soc. A 1943, 239, 33.
39.Gilmore, F. R. J. Quant. Spectr. Rad. Trans. 1965, 5, 369.
40.Michels, H. H. Adv. Chem. Phys. 1981, 45, 227.
41.Bass, A. D.; Parenteau, L.; Weik, F.; and Sanche, L. J. Chem. Phys. 2001, 115, 48.11.
42.Jaffke, T.; Meinke, M.; Hashemi, R.; Christrophorou, L. G.; and Illenberger, E. Chem. Phys. Lett. 1992, 193, 62.
43.Bailey, C. J.; Lavrich, D. J.; Serxner, D.; and Johnson, M. A. J. Chem. Phys. 1996, 105, 1807.
44.Celotta, R. J.; Bennett, R. A.; and Hall, J. L. J. Chem. Phys. 1986, 60, 1740.
45.Hunsicker, S.; Jones, R. O.; and Gantefor, G. J. Chem. Phys. 1995, 102, 5917.
46.Moran, N. R. and Ellison, G. B. J. Phys. Chem. 1988, 92, 1794.
47.Snodgrass, J. T.; Coe, J. V.; McHugh, K. M. ; Friedhoff, C. B.; and Bowen, K. H. J. Phys. Chem. 1989, 93, 1249.
48.Hobbs, R. H.; Michels, H. H.; and Wright, L. A. Chem. Phys. Lett. 1985, 118, 67.
49.McHugh, K. M.; Eaton, J. G.; Lee, G. H.; Sarkas, H. W.; Kidder, L. H.; Snodgrass, J. T.; Manaa, M. R.; and Bowen, K. H. J. Chem. Phys. 1989, 91, 3792.
50.Ho, J.; Ervin, K. M.; and Lineberger, W. C. J. Chem. Phys. 1990, 93, 6987.
51.Gantefor, G. F.; Cox, D. M.; and Kaldor, A. J. Chem. Phys. 1990, 93, 8395.
52.Taylor, K. J.; Pettiettehall, C. L.; Cheshnovsky, O.; and Smalley, R. E. J. Chem. Phys. 1992, 96, 3319.
53.McGeoch, M. W. and Schlier, R. E. Phys. Rev. A: At. Mol. Opt. Phys. 1985, 33, 1708.
54.Travers, M. J.; Cowles, D. C.; and Ellison, G. B. Chem. Phys. Lett. 1989, 164, 449.
55.Siegel, M. W.; Celotta, R. J.; Hall, J. L.; Levine, J.; and Bennett, R. A. Phys. Rev. A: At. Mol. Opt. Phys. 1972, 6, 607.
56.Tiernan, T. O. and Wu, R. L. C. Adv. Mass Spectrom. 1978, 7A, 136.
57.Burrow, P. D. Chem. Phys. Lett. 1974, 26, 265.
58.Parkes, D. A. and Sugden, T. M. J. Chem. Soc. Farad. Trans. 2, 1972, 68, 600.
59.Refaey, K. M. A. Int. J. Mass Spectrom. Ion Phys. 1976, 21, 21.
60.Berkowitz, J.; Chupka, W. A.; and Gutman, D. J. Chem. Phys. 1971, 55, 2733.
61.Williams, J. M. and Hamill, W. H. J. Chem. Phys. 1968, 49, 4467.
62.Farragher, A. L.; Page, F. M.; and Wheeler, R. C. Farad. Disc. Chem. Soc. 1964, 37, 203.
63.Arnold, D. W.; Bradforth, S. E.; Kitsopoulos, T. N.; and Neumark, D. M. J. Chem. Phys. 1991, 95, 8753.
64.Oakes, J. M. and Ellison, G. B. Tetrahedron 1986, 42, 6263.
65.Yang, S.; Taylor, K. J.; Craycraft, M. J.; Conceicao, J.; Pettiette, C. L.; Cherhnovsky, O.; and Smalley, R. E. Chem. Phys. Lett. 1989, 144, 431.
66.Illenberger, E.; Comita, P.; Brauman, J. I.; Fenzlaff, H-P.; Heni, M.; Heinrich, N.; Koch, W.; and Frenking, G. Ber. Bunsen-Ges. Phys. Chem. 1985, 89, 1026.
67.Jackson, R. L.; Pellerite, M. J.; and Brauman, J. I. J. Amer. Chem. Soc. 1981, 103, 1802.
68.Engleking, P. C. and Lineberger, W. C. J. Chem. Phys. 1976, 65, 4323.
69.Franklin, J. L.; Dibeler, V. H.; Reese, R. M.; and Krauss, M. J. Amer. Chem. Soc. 1958, 80, 298.
232DIATOMIC AND TRIATOMIC MOLECULES AND SULFUR FLUORIDES
70.Arnold, D. W.; Xu, C. S.; Kim, E. H.; and Neumark, D. M. J. Chem. Phys. 1994, 101, 912.
71.Novich, S. E.; Engelking, P. C.; Jones, P. L.; Futrell, J. H.; and Lineberger, W. C. J. Chem. Phys. 1979, 70, 2652.
72.Wong, S. F.; Vorburger, T. V.; and Woo, S. B. Bull. Am. Phys. Soc. 1971, 16, 213.
73.Smith, G. P.; Lee, L. C.; Cosby, P. C.; Peterson, J. R.; and Moseley, J. T. J. Chem. Phys. 1978, 68, 3818.
74.Dotan, I.; Davidson, J. A.; Streit, G. E.; Albritton, D. L.; and Fehsenfeld, F. C. J. Chem. Phys. 1977, 67, 2874.
75.Wu, R. L. C.; Tiernan, T. O.; and Lifschitz, C. Chem. Phys. Lett. 1977, 51, 211.
76.Rothe, E. W.; Tang, S. Y.; and Reck, G. P. J. Chem. Phys. 1975, 62, 3829.
77.Nimlos, M. R. and Ellison, G. B. J. Phys. Chem. 1986, 90, 2574.
78.Chowdhury, S.; Heinis, T.; Grimsrud, E. P.; and Kebarle, P. J. Phys. Chem. 1986, 90, 2747.
79.Feldman, D. Z. Naturfor. 1970, 25A, 621.
80.Grabowski, J. J.; Van Doren, J. M.; De Puy, C. H.; and Bierbaum, V. M. J. Chem. Phys. 1984, 80, 575.
81.Refaey, K. M. A. and Franklin, J. L. J. Chem. Phys. 1976, 65, 1994.
82.Ervin, K. M.; Ho, J.; and Lineberger, W. C. J. Phys. Chem. 1988, 92, 5405.
83.Woo, S. B.; Helmy, E. M.; Mauk, P. H.; and Paszek, A. P. Phys. Rev. A 1981, 24, 1380.
84.Herbst, E.; Patterson, T. A.; and Lineberger, W. C. J. Chem. Phys. 1974, 61, 1300.
85.Smith, G. P.; Lee, L. C.; and Moseley, J. T. J. Chem. Phys. 1979, 71, 4034.
86.Richardson, J. H.; Stephenson, L. M.; and Brauman, J. I. Chem. Phys. Lett. 1974, 25, 318.
87.Pearson, P. K.; Schaefer, H. F.; Richardson, J. H.; Stephenson, L. M.; and Brauman, J. I.
J.Amer. Chem. Soc. 1974, 96, 6778.
88.Ferguson, E. E.; Dunkin, D. B.; and Fehsenfeld, F. C. J. Chem. Phys. 1972, 57, 1459.
89.Chen, E. C. M.; Welk, N.; Chen, E. S.; and Wentworth, W. E. J. Phys. Chem. A 1999, 103, 9072.
90.Chen, E. C. M. and Wentworth, W. E. J. Phys. Chem. 1983, 87, 45.
91.Chen, E. C. M.; George, R.; Carr, S. D.; Wentworth, W. E.; and Chen, E. S. D.
J.Chromatogr. A 1998, 811, 250.
92.Wentworth, W. E.; Chen, E.; and Freeman, R. J. Chem. Phys. 1971, 55, 2075.
93.Compton, R. N.; Reinhardt, P. W.; and Cooper, C. D. J. Chem. Phys. 1975, 63, 3821.
94.Scheidt, J. and Weinkauf, R. Chem. Phys. Lett. 1997, 266, 201.
95.Compton, R. N.; Dunning, F. B.; and Nordlander, P. Chem. Phys. Lett, 1996, 253, 8.
96.Tsukuda, T.; Hirose, T.; and Nagata, T. Chem. Phys. Lett. 1997, 279, 179–184.
97.Kraus, K.; Muller-Duysing, W.; and Neuert, H. Z. Naturfor. 1961, 16A, 1385.
98.Bruning, F.; Matejcik, S.; Illenberger, E.; Chu, Y.; Senn, G.; Muigg, D.; Denifi, G.; and Mark, T. D. Chem. Phys. Lett. 1998, 292, 177.
99.Chantry, P. J. J. Chem. Phys. 1969, 51, 3369.
100.Knapp, A.; Echt, O.; Kreisle, D.; Mark, T. D.; and Recknagel, E. Chem. Phys. Lett. 1986, 126, 225.
101.Coe, J. V.; Snodgrass, J. T.; Freidhoff, C. B.; McHugh, K. M.; and Bowen, K. H. Chem. Phys. Lett. 1986, 124, 274.
102.Tiernan, T. O. and Wu, R. L. C. Adv. Mass Spectrom. 1978, 7A, 136.
REFERENCES 233
103.Hopper, D. G.; Wahl, A. C.; Wu, R. L. C.; and Tiernan, T. O. J. Chem. Phys. 1976, 65, 5474.
104.Polak, M. L.; Gilles, M. K.; and Lineberger, W. C. J. Chem. Phys. 1992, 96, 7191.
105.Langford, M. L.; Almeida, D. P.; and Harris, F. M. Int. J. Mass Spectrom. Ion Proce. 1990, 98, 147.
106.Miller, A. E. S.; Miller, T. M.; Viggiano, A. A.; Morris, R. A.; Vandoren, J. M.; Arnold, S. T.; and Paulson, J. J. Chem. Phys. 1995, 102, 8865.
107.Harland, P. W. and Thynne, J. C. J. J. Phys. Chem. 1971, 75, 351.
108.Compton, R. N.; Reinhardt, P. W.; and Cooper, C. D. J. Chem. Phys. 1978, 68, 2023.
109.Page, F. M. and Goode, G. C. Negative Ions and the Magnetron. New York: Wiley, 1969.
110.Babcock, L. M. and Streit, G. E. J. Chem. Phys. 1981, 75, 3864.
111.Donovan, R. J.; Harland, P. W.; Knox, J. H.; Makowski, J. A.; and Thynne, J. C. J. Int. J. Mass Spectrom. Ion Phys. 1974, 13, 464.
112.Chen, E. C. M.; Shuie, L. R.; D’Sa, E. D.; Batten, C. F.; and Wentworth, W. E. J. Chem. Phys. 1988, 88, 4711.
113.Larson, J. W. and McMahon, T. B. J. Amer. Chem. Soc. 1983, 105, 2944.
114.Compton, R. N.; Reinhardt, P. W.; and Cooper, C. D. J. Chem. Phys. 1978, 68, 2023.
115.Hubers, M. M. and Los. J. Chem. Phys. 1975, 10, 235.
116.Compton, R. N. and Cooper, C. D. J. Chem. Phys. 1973, 59, 4140.
117.Kay, J. and Page, F. M. Trans. Farad. Soc. 1964, 60, 1042.
118.Chen, E. C. M.; Wiley, J. R.; Batten, C. F.; and Wentworth, W. E. J. Phys. Chem. 1994, 98, 88.
119.Grimsrud, E. P.; Chowdhury, S.; and Kebarle, P. J. Chem. Phys. 1985, 83, 1059.
120.Datskos, P. G.; Carter, J. G.; and Christophorou, L. G. Chem. Phys. Lett. 1995, 239, 38.
121.Drzaic, P. S. and Brauman, J. I. J. Amer. Chem. Soc. 1982, 104, 13.
122.Refaey, K. M. A. and Franklin, J. L. Int. J. Mass Spectrom. Ion Phys. 1978, 26, 125.
123.Fehsenfeld, F. C. J. Chem. Phys. 1971, 54, 438.
124.Compton, R. N.; Christophorou, L. G.; Hurst, G. S.; and Reinhardt, P. W. J. Chem. Phys. 1966, 45, 4634.
125.Tachikawa, H. J. Phys. B: At. Mol. Opt. Phys. 2002, 35, 55.
126.Ziegler, T. and Gutsev, G. L. J. Chem. Phys. 1992, 96, 7623.
127.King, R. A.; Galbraith, J. M.; and Schaefer, H. F. J. Phys. Chem. 1996, 100, 6061.
128.Mulliken, R. S. J. Chem. Phys. 1971, 55, 288.

 CHAPTER 10
Negative Ions of Organic Molecules
10.1INTRODUCTION
The negative ions of organic molecules are more difficult to characterize because of the many degrees of freedom that they have. Organic molecules are defined as closed-shell species that contain C, H, O, S, N, and halogens. The profusion of vibrations and rotations also leads to multiple negative-ion states. In this chapter the negative-ion states of nitromethane and nitrobenzene will be characterized by Morse potential energy curves. The electron affinities of the organic molecules will be evaluated by comparisons with experimental and theoretical determinations. Substitution and replacement rules will then be established from the data.
Fewer than 300 Ea for organic molecules have been determined in the gas phase. The majority of the Ea have been determined by the ECD and/or TCT methods. The direct capture magnetron, AMB, photon, and collisional ionization methods have produced fewer than 40 values. Only the Ea of p-benzoquinone, nitrobenzene, nitromethane, azulene, tetracene, and perylene have been determined by three or more methods. Excited-state Ea have been obtained by each of these methods. Half-wave reduction potentials have determined the electron affinities of 50 aromatic hydrocarbons. The electron affinities of another 50 organic compounds have been determined from half-wave reduction potentials and the energies of charge transfer complexes. It is a manageable task to evaluate these 300 to 400 Ea.
The electron affinities of organic halides and environmental pollutants are evaluated in Chapter 11 and those of biological molecules in Chapter 12. Many of the Ea measured in the gas phase are tabulated in the NIST tables [1]. These are listed in the appendices according to molecules containing CHX, CHNX, CHOX, and CHONX with references. The ECD values for some of the aromatic hydrocarbons in NIST have not been updated. L. G. Christophorou’s compilation includes Ea from half-wave reduction potentials and charge transfer complexes [2]. Some of these Ea will be revised and evaluated in this chapter based on gas phase measurements.
The Electron Capture Detector and the Study of Reactions with Thermal Electrons by E. C. M. Chen and E. S. D. Chen
ISBN 0-471-32622-4 # 2004 John Wiley & Sons, Inc.
234
ELECTRON AFFINITIES AND POTENTIAL ENERGY CURVES |
235 |
The Ea are considered according to the methods used. Those for hydrocarbons determined by other methods are compared with the ECD values. The Ea for benzaldehydes, acetophenones, benzophenones, bezonitriles, esters, and nitrobenzenes have been determined by the ECD, TCT, and/or NIMS methods. These compounds and related molecules obtained from reduction potentials and charge transfer complex energies will be evaluated. Based on these data, the substitution effects for CH3C O, NO2, HC O, NH2, F, Cl, and CF3 and the alkyl groups are determined. The multiple substitution effects of NO2 and CN on benzene and ethylene are also established.
10.2 ELECTRON AFFINITIES AND POTENTIAL ENERGY CURVES FOR NITROBENZENE AND NITROMETHANE
Nitromethane makes a nice transition from small molecules to large organic molecules. The Ea of NO2 was determined using the ECD (above 425 K) from the activation energy for dissociative thermal electron attachment to CH3NO2. The Ea of CH3NO2 was determined from data in the lower-temperature region. The data were presented in Chapter 5 as an example of the determination of a Qan much smaller than 1. The ECD Ea of 0.50 0.02 eV for nitromethane is supported by AMB and TCT values. The PES value is 0.26 0.08 eV and could exist for an excited state. A dipole bound state is observed at 0.012 eV [1–13].
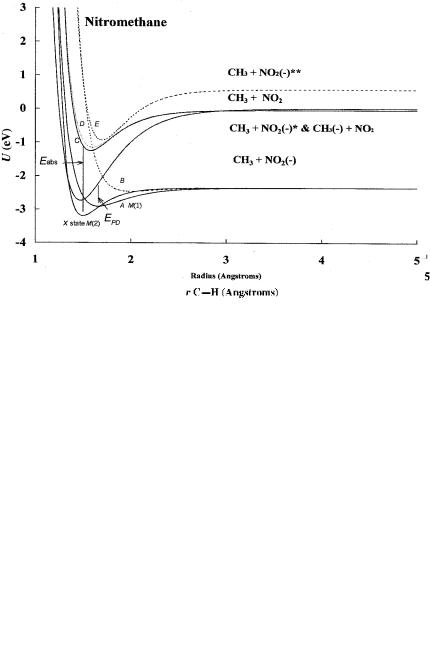
For nitromethane there are two dissociation directions: the C H dimension and C N dimension. There are two known excited states for NO2(-). The dissociation in the C H dimension is related to the gas phase acidity measurement. There are considerable gas phase acidity, electron impact, absorption, and emission data for nitromethane. Morse potential energy curves have been calculated for seven states in the C N dimension and six states in the C H dimension [3–13]. At least two dipole bound curves can also be constructed. Curves in the C H dimension and C N dimension are shown in Figures 10.1 and 10.2. The ground-state curve is drawn to give the AEa and crosses on the backside of the neutral, making it M(2) and Mc(2). The first excited-state curve, M(1), is drawn to give a positive Ea and crosses on the frontside of the neutral. The bonding excited-state curve leading to the H( ) limit is D(0) and Mc(0). It is possible for the parent negative ion to be formed in a vertical process if the ion is stabilized to the dipole bound state before dissociation takes place. The two highest excited states lead to dissociation, giving the H( ) or CH2NO2( ) ions.
In the C N dimension anion curves are drawn to four different dissociation limits: the two complementary limits of NO2( ) and CH3 and two limits leading to excited states of NO2( ) and CH3. Dipole bound states could also be drawn in these dimensions. The ground-state curves and dipole bound curves are M(2). The lower excited-state curve A is M(1) since the EDEA and VEa are negative but the Ea is positive. More than three data points from PES, ECD, EI, or anion absorption and emission spectra define the ground state and the first excited valence state. The B state is D(0) but could lead to molecular anion formation via the C, D,
236 NEGATIVE IONS OF ORGANIC MOLECULES
Figure 10.1 Morse potential energy curves for CH3NO2 in the C H dimension. The curves are drawn from experimental data for the Ea and gas phase acidity. The details are given in [3].
Figure 10.2 Morse potential energy curves for CH3NO2 in the C N dimension. The curves are drawn from experimental data for the Ea and electron impact and negative-ion absorption data. The details are given in [3].