

Chen The electron capture detector
.pdfELECTRON AFFINITIES OF CHARGE TRANSFER COMPLEX ACCEPTORS |
257 |
the ECD values of the parents. The evaluated values reflect the increased values for acetophenone, benzaldehyde, and benzophenone. The majority of these are confirmed by CURES-EC and relative values have been supported by ab initio calculations. The LUMO are positive rather than negative, so a constant displacement of 2.2 eV is required to obtain absolute Ea. These compounds are the natural bridge between the TCT and ECD values and the ab initio and CURES-EC values.
10.5 ELECTRON AFFINITIES OF CHARGE TRANSFER COMPLEX ACCEPTORS
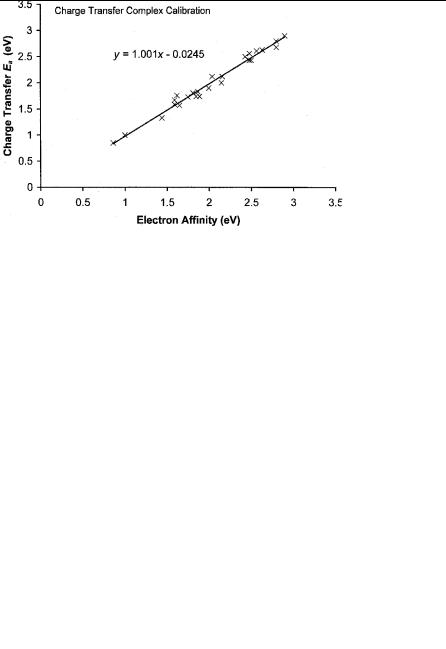
The electron affinities of a number of the standard p charge transfer complex acceptors have been measured using TCT. By scaling the values originally obtained for these acceptors, unmeasured Ea can be estimated. The values for the substituted benzoquinones differ from the values published in 1975, as discussed in Chapter 6 [71]. By shifting the methyl-substituted compounds by a different amount than the halogenated compounds, more accurate values were obtained. The difference is a systematic uncertainty that can be removed empirically with the larger number of calibration points. The random uncertainties will, however, remain. The values for 1,4 naphthoquinone and anthraquinone can be scaled by 0.1 eV to obtain more precise values. The Ea of s-trinitrobenzene has the largest systematic error, about 0.9 eV. The charge transfer complex maxima for other trinitrocompounds are close to the value for 1,3,5 trinitrobenzene. Comparable values for the Ea of other trinitro compounds are obtained by scaling. Table 10.15 lists the Ea that have been scaled to the selected Ea, the values determined from charge transfer complex data in 1975, and the current ‘‘best’’ values. This procedure introduces additional scale factors: 0.20 and 0.30 eV for the halobenzoquinones, 0.1 eV for anthraquinone and naphthoquinone, 0.55 eV for the dinitrobenzenes, and 0.9 eV for the trinitrocompounds. Figure 10.13 is a precision and accuracy plot for the Ea of the calibration points determined from the charge transfer spectra versus the evaluated Ea. If we assume a unit slope, the intercept is slightly negative. The standard deviation is 0.08 eV. Table 10.16 gives the Ea of other compounds scaled with these same factors.
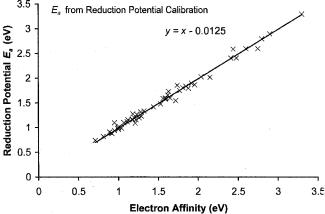
In many cases the Ea of these acceptors have been determined from reduction potentials by using G values that vary from 2.6 eV for nitrobenzene to 2.0 for the tetrahalobenzoquinones. Figure 10.14 shows the calibration points for the reduction potentials given in Table 10.17. The standard deviation is 0.08 eV. Five values of G are defined, 2.00 eV and 2.05 eV, the same as for some aromatic hydrocarbons, 2.25 eV for the benzoquinones, cyanonitrobenzenes and dinitrobenzenes, 2.45 eV for halogen substituted nitro compounds, and 2.55 eV for nitrobenzenes and alkyl nitro benzenes. In Table 10.18 are Ea using theseG and the average of these values with those obtained from ECT.
258 NEGATIVE IONS OF ORGANIC MOLECULES
TABLE 10.15 Calibration Data (in eV) for Charge Transfer Complex Acceptors
Compound |
Evaluated |
1975 |
Difference |
Adjusted |
|
|
|
|
|
Hexacyanobutadiene |
3.29(15) |
3.08 |
0.21 |
3.18 |
Tetracyanoethylene |
2.95(10) |
2.77 |
0.16 |
2.87 |
Tetracyanoquinodimethane |
2.80(6) |
2.84 |
0.04 |
2.94 |
Hexacyanobenzene |
2.54(15) |
2.56 |
0.02 |
2.66 |
Tetracyanobenzene |
2.20(15) |
2.00 |
0.20 |
2.10 |
Maleic anhydride |
1.44(9) |
1.33 |
0.11 |
1.43 |
Hexafluorobenzene |
0.86(2) |
0.86 |
0.00 |
0.86 |
9,10-Anthraquinone |
1.59(6) |
1.57 |
0.02 |
1.67 |
Nitrobenzene |
1.00(1) |
1.19 |
0.19 |
1.00 |
p-Benzoquinone |
1.860(5) |
1.83 |
0.04 |
1.83 |
Chloranil |
2.77(5) |
2.44 |
0.33 |
2.74 |
Fluorobenzoquinone |
2.20(15) |
1.93 |
0.23 |
2.13 |
Tetrabromo-o-benzoquinone |
2.44(20) |
2.48 |
0.04 |
2.78 |
2,5-Dichlorobenzoquinone |
2.40(3) |
2.30 |
0.13 |
2.50 |
2,6-Dichlorobenzoquinone |
2.48(3) |
2.23 |
0.25 |
2.53 |
Trichlorobenzoquinone |
2.61(5) |
2.41 |
0.20 |
2.71 |
Methyltrichlorobenzoquinone |
2.54(5) |
2.22 |
0.32 |
2.52 |
Methylbenzoquinone |
1.85(5) |
1.74 |
0.15 |
1.74 |
2,5-Dimethylbenzoquinone |
1.76(6) |
1.73 |
0.03 |
1.73 |
2,6-Dimethylbenzoquinone |
1.77(5) |
1.67 |
0.10 |
1.67 |
Tetramethylbenzoquinone |
1.61(9) |
1.67 |
0.06 |
1.67 |
1,4-Naphthoquinone |
1.80(5) |
1.71 |
0.10 |
1.81 |
1,2-Dinitrobenzene |
1.65(10) |
1.07 |
0.58 |
1.57 |
1.3-dinitrobenzene |
1.66(10) |
1.26 |
0.40 |
1.77 |
1,3,5-Trinitrobenzene |
2.63(15) |
1.73 |
0.90 |
2.63 |
|
|
|
|
|
Figure 10.13 Precision and accuracy plots of the calibration data for charge transfer complex energy for the maximum absorbance. The charge transfer complex data were compiled in [71]. The data are given in Table 10.15.
ELECTRON AFFINITIES OF CHARGE TRANSFER COMPLEX ACCEPTORS |
259 |
||
TABLE 10.16 Electron Affinities (in eV) from Charge Transfer Complex Data |
|
||
|
|
|
|
Compound |
CT |
Previous |
Offset |
|
|
|
|
Acetylbenzoquinone |
2.29(10) |
2.09 |
0.2 |
Bromobenzoquinone |
2.21(10) |
2.01 |
0.2 |
Di-bromobenzoquinone |
2.61(10) |
2.31 |
0.3 |
Di-bromo-dimethylbenzoquinone |
2.35(10) |
2.05 |
0.3 |
p-Tetrabromobenzoquinone |
2.78(10) |
2.48 |
0.3 |
o-Tetrachlorobenzoquinone |
2.67(10) |
2.57 |
0.3 |
Cyanobenzoquinone |
2.22(10) |
2.22 |
0.0 |
2,3-Dicyanobenzoquinone |
2.78(10) |
2.78 |
0.0 |
Tetracyanobenzoquinone |
2.87(10) |
2.87 |
0.0 |
Trifluoromethylbenzoquinone |
2.38(10) |
2.18 |
0.2 |
Iodobenzoquinone |
2.20(10) |
2.00 |
0.2 |
p-Tetraiodobenzoquinone |
2.83(10) |
2.43 |
0.4 |
Methoxybenzoquinone |
1.69(10) |
1.69 |
0.0 |
Dimethylaminobenzoquinone |
1.47(10) |
1.47 |
0.0 |
2,5-Di-t-butylbenzoquinone |
1.57(10) |
1.57 |
0.0 |
Nitrobenzoquinone |
2.63(10) |
2.63 |
0.2 |
Dibromo-1,4-naphthoquinone |
2.41(10) |
2.11 |
0.3 |
Bromochloro-1,4-naphthoquinone |
2.30(10) |
2.00 |
0.3 |
2,3-Dichloro-1,4-naphthoquinone |
2.20(10) |
2.00 |
0.2 |
2,3-Dicyano-1,4-naphthoquinone |
2.66(10) |
2.66 |
0.0 |
Tetracyanoxylene |
1.65(10) |
1.65 |
0.0 |
Pentacyanotoluene |
2.19(10) |
2.19 |
0.0 |
1,2,3-Trinitrobenzene |
2.18(10) |
1.28 |
0.9 |
1,2,4-Trinitrobenzene |
2.59(10) |
1.69 |
0.9 |
1,2,3,5-Tetranitrobenzene |
2.81(10) |
1.91 |
0.9 |
2,4-Dinitrotoluene |
1.67(10) |
1.17 |
0.5 |
2,4,6-Trinitrotoluene |
2.57(10) |
1.67 |
0.9 |
2,4,6-Trinitro-p-xylene |
2.37(10) |
1.47 |
0.9 |
2,4,6-Trinitrobenzoic acid |
2.64(10) |
1.74 |
0.9 |
2,4,6-Trinitroanisole |
2.52(10) |
1.62 |
0.9 |
|
|
|
|
Figure 10.14 Precision and accuracy plots of the calibration data for half-wave reduction potentials. The data were compiled in [58, 71]. The data are given in Table 10.17.
260 |
NEGATIVE IONS OF ORGANIC MOLECULES |
|
|
|
TABLE 10.17 Calibration Data (in eV) for Reduction Potentials |
|
|||
|
|
|
|
|
|
|
Ea |
G |
Ea (reduction) |
Trifluoromethylnitrobenzene |
1.41(9) |
2.55 |
1.42 |
|
Nitrobenzene |
1.00(1) |
2.55 |
1.02 |
|
m-Methoxynitrobenzene |
1.04(1) |
2.55 |
0.99 |
|
m-Nitrotoluene |
0.98(3) |
2.55 |
0.98 |
|
Dimethylaminonitrobenzene |
0.98(3) |
2.55 |
1.10 |
|
p-Nitrotoluene |
0.95(3) |
2.55 |
0.94 |
|
o-Nitrotoluene |
0.90(3) |
2.55 |
0.88 |
|
p-Methoxynitrobenzene |
0.89(5) |
2.55 |
0.89 |
|
3,4-Dimethylnitrobenzene |
0.90(5) |
2.55 |
0.91 |
|
2,3-Dimethylnitrobenzene |
0.80(5) |
2.55 |
0.82 |
|
2,6-Dimethylnitrobenzene |
0.74(4) |
2.55 |
0.74 |
|
p-Bromonitrobenzene |
1.29(10) |
2.45 |
1.34 |
|
m-Bromonitrobenzene |
1.29(10) |
2.45 |
1.23 |
|
m-Chloronitrobenzene |
1.27(5) |
2.45 |
1.32 |
|
p-Chloronitrobenzene |
1.24(4) |
2.45 |
1.20 |
|
1-Nitronaphthalene |
1.23(9) |
2.45 |
1.27 |
|
p-Nitrobenzophenone |
1.28(9) |
2.45 |
1.20 |
|
m-Fluoronitrobenzene |
1.22(5) |
2.45 |
1.16 |
|
2-Nitronaphthalene |
1.16(9) |
2.45 |
1.28 |
|
o-Fluoronitrobenzene |
1.09(5) |
2.45 |
1.17 |
|
o-Chloronitrobenzene |
1.13(5) |
2.45 |
1.16 |
|
p-Fluoronitrobenzene |
1.10(5) |
2.45 |
1.12 |
|
o-Nitrobiphenyl |
1.07(10) |
2.45 |
1.10 |
|
Maleic anhydride |
1.44(9) |
2.40 |
1.42 |
|
2,3-Di-t-butylbenzoquinone |
1.92(9) |
2.25 |
1.90 |
|
p-Benzoquinone |
1.860(5) |
2.25 |
1.80 |
|
2,6-Di-t-butylbenzoquinone |
1.88(9) |
2.25 |
1.80 |
|
Methylbenzoquinone |
1.85(5) |
2.25 |
1.84 |
|
1,4-Naphthoquinone |
1.80(5) |
2.25 |
1.81 |
|
2,5-Dimethylbenzoquinone |
1.76(6) |
2.25 |
1.75 |
|
2-Methyl-1,4-naphthoquinone |
1.75(4) |
2.25 |
1.86 |
|
p-Cyanonitrobenzene |
1.71(9) |
2.25 |
1.55 |
|
o-Dinitrobenzene |
1.65(10) |
2.25 |
1.60 |
|
Trimethylbenzoquinone |
1.69(5) |
2.25 |
1.73 |
|
m-Dinitrobenzene |
1.66(10) |
2.25 |
1.66 |
|
Tetramethylbenzoquinone |
1.61(4) |
2.25 |
1.58 |
|
9,10-Anthraquinone |
1.59(6) |
2.25 |
1.60 |
|
t-Butyl-9,10-anthraquinone |
1.56(6) |
2.25 |
1.59 |
|
Ethyl-9,10-anthraquinone |
1.56(6) |
2.25 |
1.59 |
|
m-Cyanonitrobenzene |
1.57(5) |
2.25 |
1.48 |
|
Phenylbenzoquinone |
2.04(6) |
2.25 |
2.03 |
|
p-Dinitrobenzene |
2.00(9) |
2.20 |
1.87 |
|
Phthalic anhydride |
1.26(5) |
2.20 |
1.09 |
|
Dicyanoethylene |
1.00(10) |
2.15 |
0.97 |
|
Hexacyanobutadiene |
3.29(15) |
2.05 |
3.30 |
|
Tetracyanoethylene |
2.95(10) |
2.05 |
2.90 |
|

|
|
SUBSTITUENT EFFECT |
261 |
|
TABLE 10.17 ðContinuedÞ |
|
|
|
|
|
Ea |
G |
Ea (reduction) |
|
Tetracyanoquinodimethane |
2.80(6) |
2.05 |
2.80 |
|
p-Fluoranil |
2.70(10) |
2.05 |
2.60 |
|
p-Chloranil |
2.77(5) |
2.00 |
2.65 |
|
o-Bromanil |
2.44(20) |
2.00 |
2.64 |
|
2,6-Dichlorobenzoquinone |
2.48(3) |
2.00 |
2.46 |
|
2,3-Dichlorobenzoquinone |
2.40(3) |
2.00 |
2.46 |
|
Tetracyanobenzene |
2.20(15) |
2.00 |
2.07 |
|
o-Dicyanobenzene |
1.00(10) |
2.00 |
1.00 |
|
|
|
|
|
|
TABLE 10.18 Electron Affinities (in eV) from Reduction Potential and Charge Transfer Complex Data
Compound |
Eval |
ECT |
E1/2 |
Acetylbenzoquinone |
2.21(5) |
2.29 |
2.18 |
Bromobenzoquinone |
2.19(5) |
2.21 |
2.17 |
Di-bromo-dimethylbenzoquinone |
2.25(5) |
2.25 |
2.25 |
p-Tetrabromobenzoquinone |
2.78(5) |
2.78 |
2.78 |
Cyanobenzoquinone |
2.30(5) |
2.22 |
2.37 |
Trifluoromethylbenzoquinone |
2.32(5) |
2.38 |
2.26 |
Iodobenzoquinone |
2.18(5) |
2.20 |
2.16 |
Methoxybenzoquinone |
1.76(5) |
1.69 |
1.87 |
Dimethylaminobenzoquinone |
1.55(5) |
1.47 |
1.64 |
2,5-Di-t-butylbenzoquinone |
1.76(8) |
— |
1.76 |
2,3-Dichloro-1,4-naphthoquinone |
2.20(5) |
2.20 |
2.20 |
2,3-Dicyano-1,4-naphthoquinone |
2.66(5) |
2.66 |
2.66 |
|
|
|
|
The evaluated values are the averages.
10.6SUBSTITUENT EFFECT
From the changes in the electron affinities for the substituted compounds, general substitution effects can be identified. The replacement of an aromatic hydrogen atom by an F atom raises the Ea by 0.1 to 0.2 eV, while the replacement by a single Cl, Br or I increases the Ea 0.2 to 0.3 eV. The substitution of a CH3 group can lower the Ea as in the case of nitrobenzene or can raise it as in the case of benzene. The substitution of a single CF3 group raises the Ea by as much as 0.4 eV. The effect of substituting OH for an H atom is to increase the Ea by about 0.5 eV. The substitution of a COOCH3 will increase the Ea by about 0.4 eV. The substitution of an acetyl group will increase the Ea by about 0.6 eV while the substitution of a CHO or CN group will increase the Ea by a greater amount. The substitution of a nitro group on nitrobenzene increases the Ea by about 1 eV for the para position
262 NEGATIVE IONS OF ORGANIC MOLECULES
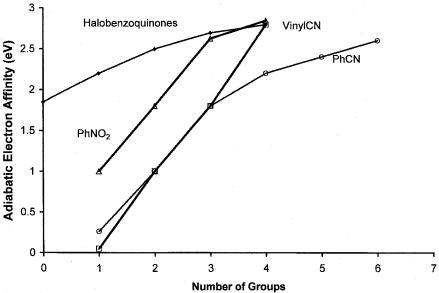
Figure 10.15 The electron affinities of halogenated benzoquinones, cyanoethylene, cyanobenzenes, and nitrobenzenes versus the number of substituents, data from [20].
but only increases the Ea by about 0.6 eV in the meta and ortho positions. This difference is supported by the CURES-EC calculations. The increase in the Ea of naphthalene is 1 eV for the first nitro group and about 0.6 eV for a second nitro group. The largest increases are observed for the substitution of the first NO2 group, from 1 eV to 1.5 eV. The effects are larger for the molecules with the lower Ea values, such as benzonitrile and methyl benzoate, and are smallest for nitrobenzene [68]. The Ea from half-wave reduction potentials and charge transfer maxima support the substitution effects. The substitution of alkyl groups decreases the Ea by 0.05 eV to 0.1 eV per alkyl group, and the substitution of a halogen atom increases it by 0.1 eV to 0.25 eV. The substitution of four halogens in benzoquinone raises the Ea from 1.86 eV to 2.8 eV regardless of the halogen. Upon substitution of an additional NO2 group in trinitrobenzene, the increase in the Ea is only 0.2 eV, indicating a saturation effect. Indeed, the electron affinities of organic molecules seem to plateau at 4 eV. This Ea maxima is observed in Figure 10.15. Values for radicals are observed at higher values.
With these generalizations the Ea of other compounds can be estimated and used to optimize the CURES-EC results. The Ea of phenanthraldehyde should be about 0.6 eV greater than that for phenanthrene or 0.3 þ 0.6 ¼ 0.9 eV. The experimental value is 0.9 eV. The values for the chloroanthracenes should be approximately 0.2 eV greater than that of anthracene or 0.2 þ 0.68 ¼ 0.88 eV. The experimental values are 0.8 to 0.9 eV. Multiple substitutions for the NO2 and CN groups in benzene level off with three groups. The substitution of halogens in benzoquinone level off with three substitutions.
REFERENCES 263
10.7SUMMARY
Morse potential energy curves for nitromethane and nitrobenzene were calculated from experimental data. These curves are the most precisely defined curves for the organic compounds. The electron affinities measured by the magnetron, AMB, photon, collisional ionization, TCT, NIMS, and ECD methods generally agree within the uncertainties. Since each of these methods is capable of accurately and precisely measuring the Ea of a given compound, when a value deviates from the highest precise value by more than the experimental uncertainty, the possibility of an excited state should be considered. For ECD and PES data it is possible to interpret the data in terms of the simultaneous observation of two nondetaching negative-ion states. New electron affinities for substituted nitrobenzenes and esters were reported from ECD data. The experimental data for charge transfer complex acceptors from absorption maxima and half-wave reduction potentials were calibrated with experimental Ea to obtain more accurate values for the electron affinities.
REFERENCES
1.National Institute of Standards and Technology (NIST). Chemistry WebBook, 2003. Available at http://webbook.nist.gov.
2.Christodoulides, A. A.; McCorkle, D. L.; and Christophorou, L. G. ‘‘Electron Affinities of Atoms, Molecules and Radicals’’ in Electron-Molecule Interactions and Their Applications. New York: Academic Press, 1984.
3.Chen, E. C. M.; Welk, N.; Chen, E. S.; and Wentworth, W. E. J. Phys. Chem. A 1999, 103, 9072.
4.Chen, E. C. M. and Wentworth, W. E. J. Phys. Chem. 1983, 87, 45.
5.Jager, K. and Henglein, A. Z. Natforschg. 1967, 22a, 700.
6.Stockdale, J. A.; Davis, F. J.; Compton, R. N.; and Klots, C. E. J. Chem. Phys. 1974, 60, 4279.
7.DeDomenico, A. and Franklin, J. L. Int. J. Mass. Spectrom. Ion Phys. 1972, 9, 171.
8.Compton, R. N.; Reinhardt, P. W.; and Cooper, C. D. J. Chem. Phys. 1978, 68, 4360.
9.Grimsrud, E.; Caldwell, G.; and Kebarle, P. J. Amer. Chem. Soc. 1985, 107, 4627.
10.Lobo, R. F. M.; Moutinho, A. M. C.; Lachmann, K.; and Los, J. J. Chem. Phys. 1991, 95, 166.
11.Lecomte, F.; Carles, S.; Desfrancois, C.; and Johnson, M. A. J. Chem. Phys. 2000, 113, 10973.
12.Compton, R. N.; Carman, H. S.; Desfrancois, C.; Abdoul-Carmine, H.; Schermann, J. P.; Hendricks, J. H.; Lyapustina, S. A.; and Bowen, K. H. J. Chem. Phys. 1996, 105, 3475.
13.Gutsev, G. L. and Bartlett, R. J. J. Chem. Phys. 1996, 105, 8785.
14.Chen, E. C. M.; Wiley, J. R.; Batten, C. F.; and Wentworth, W. E. J. Phys. Chem. 1994, 98, 88.
15.Chen, E. C. M.; Chen, E. S.; Milligan, M. S.; Wentworth, W. E.; and Wiley, J. R. J. Phys. Chem. 1992, 96, 2385.
264 NEGATIVE IONS OF ORGANIC MOLECULES
16.Fukuda, E. K. and McIver, R. T., Jr. J. Amer. Chem. Soc. 1985, 107, 2291.
17.Chowdhury, S.; Heinis, T.; Grimsrud, E. P.; and Kebarle, P. J. Phys. Chem. 1986, 90, 2747.
18.Henglein, A. and Muccini, G. A. J. Chem. Phys. 1959, 31, 1426.
19.Laramee, J. A.; Kocher, C. A.; and Deinzer, M. L. Anal. Chem. 1992, 64, 2316.
20.Page, F. M. and Goode, G. C. Negative Ions and the Magnetron. New York: WileyInterscience, 1969.
21.Kleyn, A. W. and Moutinho, A. M. C. J. Phys. B 2001, 34, R1.
22.Dispert, H. and Lacmann, K. Int. J. Mass Spectrom. Ion Phys. 1978, 28, 49.
23.Lacmann, K.; Maneira, M. J. P.; Moutinho, A. M. C.; and Weigman, U. J. Chem. Phys. 1983, 78, 1767.
24.Spyrou, S. M.; Sauers, I.; and Christophorou, L. G. J. Chem. Phys. 1983, 78, 7200.
25.Compton, R. N.; Reinhardt, P. W.; and Cooper, C. D. J. Chem. Phys. 1978, 68, 4360.
26.Tang, S. Y.; Mathur, B. P.; Roth, E. W.; and Reck, G. P. J. Chem. Phys. 1976, 64, 1270.
27.McNamee, P. E.; Lacmann, K.; and Herschbach, D. R. Farad. Disc. Chem. Soc. 1973, 55, 318.
28.Klots, C. E.; Compton, R. N.; and Raaen, V. F. J. Chem. Phys. 1974, 60, 1177.
29.Cooper, C. D.; Frey, W. F.; and Compton, R. N. J. Chem. Phys. 1978, 69, 2367.
30.Compton, R. N.; Reinhardt, P. W.; and Cooper, C. D. J. Chem. Phys. 1974, 60, 2953.
31.Cooper, C. D. and Compton, R. N. J. Chem. Phys. 1973, 59, 3550.
32.Cooper, C. D.; Naff, W. T.; and Compton, R. N. J. Chem. Phys. 1975, 63, 2752.
33.Nalley, S. J. and Compton, R. N. Chem. Phys. Lett. 1971, 9, 529.
34.Reinstra-Kiracofe, J. C.; Tschumper, G. S.; Schaefer, H. F.; Nandi, S.; and Ellison, G. B.
Chem. Rev. 2002, 102, 231.
35.Mock, R. S. and Grimsrud, E. P. J. Amer. Chem. Soc. 1989, 111, 2861.
36.Schiedt, J. and Weinkauf, R. J. Chem. Phys. 1999, 110, 304.
37.Marks, J.; Comita, P. B.; and Brauman, J. I. J. Amer. Chem. Soc. 1985, 107, 3718.
38.Nakajima, A.; Taguwa, T.; Hoshino, K.; Sugioka, T.; Naganuma, T.; Ono, F.; Watanabe, K.; and Nakao, K. Chem. Phys. Lett. 1993, 214, 22.
39.Lyons, L. E. and Palmer, L. D. Chem. Phys. Lett. 1973, 21, 442.
40.Datskos, P. G.; Carter, J. G.; and Christophorou, L. G. Chem. Phys. Lett. 1995, 239, 38.
41.Drzaic, P. S. and Brauman, J. I. J. Amer. Chem. Soc. 1982, 104, 13.
42.Duncan, M. A.; Knight, A. M.; Negishi, Y.; Nagao, S.; Nakamura, Y.; Kato, A.; Nakajima, A.; and Kaya, K. Chem. Phys. Lett. 1999, 309, 49.
43.Lyapustina, S. A.; Xu, S. K.; Nilles, J. M.; and Bowen, K. H. J. Chem. Phys. 2000, 112, 6643.
44.Schiedt, J.; Knott, W. J.; Le Barbu, K.; Schlag, E. W.; and Weinkauf, R. J. Chem. Phys. 2000, 113, 9470.
45.Scheidt, J. and Weinkauf, R. Chem. Phys. Lett. 1997, 266, 201.
46.Scheidt, J. and Weinkauf, R. Chem. Phys. Lett. 1997, 274, 18.
47.Wenthold, P. G.; Hrovat, D. A.; Borden, W. T.; and Lineberger, W. C. Science 1996, 272, 1456.
48.Gygax, R.; Peters, H. L.; and Brauman, J. I. J. Amer. Chem. Soc. 1979, 101, 2567.
49.Wentworth, W. E. and Ristau, W. J. Phys. Chem. 1969, 73, 2126.
REFERENCES 265
50.Kato, S.; Lee, H. S.; Gareyev, R.; Wenthold, P. G.; Lineberger, W. C.; DePuy, C. H.; and Bierbaum, V. M. J. Amer. Chem. Soc. 1997, 119, 7863.
51.Denault, J. W.; Chen, G. D.; and Cooks, R. G. J. Amer. Soc. Mass Spectrom. 1998, 9, 1141.
52.Chen, G. D. and Cooks, R. G. J. Mass Spectrom. 1995, 30, 1167.
53.Chen, G.; Cooks, R. G.; Corpuz, E.; and Scott, L. T. J. Amer. Soc. Mass Spectrom. 1996, 7, 619.
54.Ruoff, R. S.; Kadish, K. M.; Boulas, P.; and Chen, E. C. M. J. Phys. Chem. 1995, 99, 8843.
55.Crocker, L.; Wang, T. B.; and Kebarle, P. J. Amer. Chem. Soc. 1993, 115, 7818.
56.Chen, E. S. D.; Chen, E. C. M.; Sane, N.; Talley, L.; Kozanecki, N.; and Shultze, S. J. Chem. Phys. 1999, 110, 9319.
57.Chen, E. C. M. and Chen, E. S. D. J. Chromatogr. A 2002, 952, 173.
58.Chen, E. C. M. and Wentworth, W. E. Mol. Cryst. Liq. Cryst. 1989, 171, 271.
59.Wojnarvits, L. and Foldiak, G. J. Chromatogr. 1981, 206, 511.
60.Dewar, M. J. S.; Hashmall, J. A.; and Trinajstic, J. J. Amer. Chem. Soc. 1970, 92, 5555.
61.Bergman, I. Trans. Farad. Soc. 1954, 50, 829.
62.Bergman, I. Trans. Farad. Soc. 1956, 52, 690.
63.Kebarle, P. and Chowdhury, S. Chem. Rev. 1987, 87, 513.
64.Rains, L. J.; Moore, H. W.; and McIver, R. T. J. Chem. Phys. 1978, 68, 3309.
65.Fukuda, E. K. and McIver, R. T. In Lecture Notes in Chemistry, edited by H. Hartman and K. P. Wanzek. Berlin: Springer, 1982, p. 164.
66.Fukuda, E. K. and McIver, R. T. J. Chem. Phys. 1982, 77, 4942.
67.Burinsky, D. J.; Fukuda, E. K.; and Campana, J. E. J. Amer. Chem. Soc. 1984, 106, 2270.
68.Huh, C.; Kang, C. H.; Lee, H. W.; Nakamura, H.; Mishima, M.; Tsuno,Y.; and Yamataka, H.
Bull. Chem. Soc. Japan 1999, 72, 1083.
69.Steelhammer, J. C. M. S. thesis, University of Houston, 1968.
70.Williamson, D. H.; Knighton, W. B.; and Grimsrud, E. P. Internat. J. Mass Spectrom. 2000, 195/196, 481.
71.Chen, E. C. M. and Wentworth, W. E. J. Chem. Phys. 1975, 63, 3183.
72.Wentworth, W. E.; Kao, L. W.; and Becker, R. S. J. Phys. Chem. 1975, 79, 1161.
73.Wentworth, W. E.; Chen, E. C. M.; and Steelhammer, J. C. J. Phys. Chem. 1968, 72, 2671.

 CHAPTER 11
Thermal Electrons and
Environmental Pollutants
11.1INTRODUCTION
The ECD and NIMS are important tools for the analysis of environmental pollutants. The determination of freon levels in the atmosphere and their effects on ozone depletion required the ECD. Identifying the highly toxic chlorinated dioxins was only possible with the ECD and NIMS. Despite these successes very little fundamental data for the reactions of electrons with these molecules in the gas phase have been obtained. This chapter evaluates the available data and presents new data.
The electron affinities of the alkyl halides including the freons and newer coolants are evaluated. The Ea of c-CF3C6F11 and c-CF3C5F9 and the EDEA are determined from unpublished atmospheric pressure negative-ion mass spectra. Activation energies and bond dissociation energies are determined from molar ECD responses at a single temperature. These are compared with activation energies obtained from relative rate constants determined by complementary methods. Electron affinities and activation energies for electron attachment to freon substitutes are obtained by analyzing ECD responses measured as a function of temperature; these results were published in 1997. The two-state model gives new results that are compared with the original single-state interpretation.
Few electron affinities of halogenated olefins and aromatic hydrocarbons have been determined in the gas phase. The electron affinities of the chloroethylenes and chlorobenzenes were determined using the ECD and those of C6F6, C6F5X, C6HCl5, and C6Cl6 using TCT. The only Ea for the polychlorinated naphthalenes and chlorinated biphenyls and the complete set of Ea for the chlorobenzenes were obtained from reduction potentials in aprotic solvents. The ECD data for fluorobenzenes and chlorobenzenes, some of which have not been previously published, are analyzed and evaluated. The electron affinities of the halogenated benzenes are calculated using CURES-EC. Unpublished ECD data for trifluoromethylhalobenzenes are analyzed to obtain Ea. Morse potential energy curves for CCl4,
The Electron Capture Detector and the Study of Reactions with Thermal Electrons by E. C. M. Chen and E. S. D. Chen
ISBN 0-471-32622-4 # 2004 John Wiley & Sons, Inc.
266