

Chen The electron capture detector
.pdfELECTRON AFFINITIES AND POTENTIAL ENERGY CURVES |
237 |
Figure 10.3 Morse potential energy curves for C6H5NO2 in the C N dimension. The curves are drawn from experimental data for the Ea and electron impact data [14–19].
or E states. The higher excited-state curves are M(0) and Mc(0) curves. This stands in contrast to the C0 and D0 curves shown in Figure 10.1 that are D(0) and Dc(0). Only electron impact data are available for the higher curves so they are constructed using assumed bond orders or internuclear distances [3].
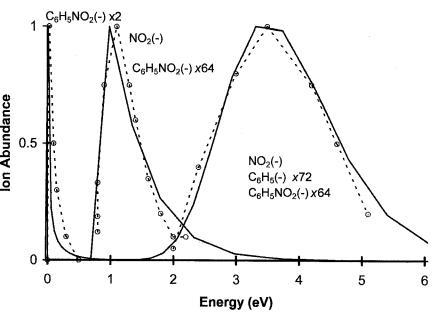
The electron affinity of nitrobenzene has been determined by the ECD, NIMS, PES, and TCT methods [14–18]. The more recent values are the most precise, but agree in magnitude with the earliest value determined in 1957. The electron impact spectrum for nitrobenzene shows peaks for the molecular ion at 0.03, 3.3, and 6.9 eV. The most intense ion is NO2( ) with peaks at 1.2 eV and 3.5 eV. The phenyl anion is observed at 3.6 eV and 6.0 eV. Based on these data, curves—two ‘‘bonding’’ and two ‘‘antibonding’’—are drawn, C6H5 þ NO2( ) and C6H5( ) þ NO2 [19]. These are shown in Figure 10.3 as examples in Chapter 5. The first excited-state curve, designated A, has been drawn to cross the neutral curve close to the minimum. The ground-state curve is M(2), while the A curve is M(1) and the higher states are D(0). The calculated distributions for the curves reproduce experiment, as shown in Figure 10.4. The peak at 1.2 eV is a vertical onset since theEDEA is 3.1 2.3 eV ¼ 0.8 eV. The onset for the formation of phenyl( ) is 3.1 1.1 eV ¼ 2.0 eV, as shown in Figure 10.4. The origin of the peak at approximately 6.0 to 6.5 eV is unknown, but could be a curve leading to the excited state of the phenyl anion or NO2 anion. These excited-state curves are given as qualitative indications to be compared to those for nitromethane. These curves are good representations of the dissociation in the C N dimension because the geometry of the phenyl ring does not change significantly upon the dissociation of NO2( ).
238 NEGATIVE IONS OF ORGANIC MOLECULES
Figure 10.4 Calculated and experimental ion distributions for the electron impact of C6H5NO2, from [19] and this book.
10.3 ELECTRON AFFINITIES DETERMINED USING THE MAGNETRON, ALKALI METAL BEAM, PHOTON, AND COLLISIONAL IONIZATION METHODS
10.3.1Electron Affinities Determined Using the Magnetron Method
The electron affinities of organic charge transfer complex acceptors in the gas phase were first determined using the magnetron method. This method is regarded as unreliable due to the lack of mass identification. However, the MGN Ea for H, O, S, F, Cl, Br, I, CCl4, NO, tetracyanoethylene, dicyanoethylene, dicyanobenzene, and tetracyanoquinodomethane are equal to the confirmed EvV to 0.15 eV. The magnetron values for benzoquinone, anthraquinone, fluoranil, and chloranil are assigned to excited states. The values for C6F6 and SF6 are higher than the EvV by about 0.3 eV. The Ea of some cyanocarbons and s-trinitrobenzene have not been determined by any other technique. They have been confirmed using CURES-EC and reduction potentials. The regularity of the substitution effects of the cyano and nitro groups on ethylene and benzene shown in Figure 10.5 further supports the magnetron values. Table 10.1 lists the magnetron Ea. The regular change in the electron affinities of the chloromethanes with the number of chlorine atoms provides support for these values. The CURES-EC values reproduce these

ELECTRON AFFINITIES |
239 |
Figure 10.5 The electron affinities of halogenated benzoquinones, cyanoethylene, cyanobenzenes, and nitrobenzenes versus the number of substituents, data from [20].
TABLE 10.1 Evaluated Electron Affinities (in eV) Using the Magnetron [20, 58]
Molecule |
Selected |
NIST |
MGN |
Ea(E1=2) |
C-EC |
Hexacyanobutadiene |
3.29(15) |
3.291 |
3.24(15) |
3.30(10) |
3.3 |
TCNE |
2.95(10) |
3.166 |
2.87(15) |
2.90(10) |
3.0 |
TCNQ |
2.80(6) |
2.800 |
2.85(15) |
2.80(10) |
2.8 |
Hexacyanobenzene |
2.54(15) |
2.541 |
2.48(15) |
— |
2.7 |
Chloranil-p |
2.77(5) |
2.775 |
2.40(15) |
2.65(10) |
2.8 |
Fluoranil-p |
2.70(10) |
2.702 |
2.16(15) |
2.60(10) |
2.7 |
Fluorobenzoquinone |
2.20(15) |
— |
2.20(15) |
2.22(10) |
2.2 |
s-Tetracyanobenzene |
2.20(15) |
2.203 |
2.15(15) |
2.20(10) |
2.2 |
s-Tetracyanopyridine |
2.17(15) |
2.173 |
2.11(15) |
— |
2.5 |
s-Trinitrobenzene |
2.63(15) |
2.628 |
2.30(15) |
2.60(10) |
2.6 |
p-Benzoquinone |
1.860(5) |
1.860 |
1.34(15) |
1.80(5) |
1.9 |
9,10 Anthraquinone |
1.59(6) |
1.591 |
1.15(15) |
1.60(10) |
1.6 |
o-Dicyanobenzene |
1.03(10) |
0.954 |
1.11(15) |
1.00(10) |
1.0 |
t-Dicyanoethylene |
1.00(10) |
1.249 |
0.75(15) |
— |
1.0 |
SF6 |
1.07(5) |
1.070 |
1.39(15) |
— |
1.0 |
NO |
0.86(10) |
0.026 |
0.83(15) |
— |
0.8 |
CCl4 |
2.04(10) |
0.805 |
2.06(15) |
— |
2.2 |
CBr4 |
2.06 (10) |
2.060 |
2.03(15) |
— |
2.2 |
CHCl3 |
1.75(15) |
0.622 |
1.75(15) |
— |
1.6 |
CH2Cl2 |
1.30(15) |
— |
1.30(15) |
— |
1.25 |
C2Cl6 |
1.80(15) |
1.479 |
1.48(15) |
— |
2.0 |
C6F6 |
0.86(2) |
0.520 |
1.20(15) |
0.90(10) |
0.85 |
C6F5 |
3.18(10) |
3.183 |
3.2(1) |
— |
3.20 |
SF5 |
3.80(3) |
3.800 |
3.7(1) |
— |
3.80 |

240 NEGATIVE IONS OF ORGANIC MOLECULES
TABLE 10.2 Evaluated Electron Affinities (in eV) Using the AMB Method [2, 21]
Molecule |
AEa |
NIST |
AMB |
E1=2 |
C-EC |
TCNQ |
2.80(8) |
2.800 |
2.80(20) |
2.80(10) |
2.8 |
Bromanil-o |
2.60(20) |
2.440 |
2.44(20) |
2.70(10) |
2.7 |
Chloranil-p |
2.77(5) |
2.775 |
2.76(20) |
2.65(10) |
2.8 |
Fluoranil-p |
2.70(10) |
2.702 |
2.91(20) |
2.60(10) |
2.7 |
p-Benzoquinone |
1.860(5) |
1.990 |
1.89(20) |
1.80(5) |
1.9 |
NO |
0.86(10) |
0.026 |
0.10 |
— |
0.8 |
CH3NO2 |
0.50 (2) |
0.486 |
0.45 |
— |
0.50 |
Cl2 |
2.45(2) |
2.400 |
2.45 |
— |
2.43 |
Br2 |
2.57(2) |
2.550 |
2.57 |
— |
2.58 |
I2 |
2.524(5) |
2.524 |
2.52 |
— |
2.33 |
O2 |
1.07(10) |
0.450 |
0.45 |
— |
1.1 |
CS2 |
0.89(2) |
0.512 |
1.00 |
— |
0.85 |
NO2 |
2.273(5) |
2.273 |
2.25 |
— |
2.25 |
Maleic anhydride |
1.44(9) |
1.440 |
1.40 |
1.42(5) |
1.4 |
CCl4 |
2.06(15) |
0.80 |
2.06 |
— |
2.20 |
CH3I |
1.30(10) |
— |
0.30 |
— |
0.00 |
CF2Cl2 |
1.3(2) |
— |
0.40 |
— |
— |
CF3Br |
1.8(3) |
— |
0.91 |
— |
— |
CF3I |
2.20(20) |
— |
2.20 |
— |
2.3 |
The uncertainties in the AMB values are nominally quoted as 0.20 eV, but the agreement is often better.
systematic changes in the Ea, as shown in Table 10.1. These will be discussed further in Chapter 11.
Only the Ea for SF5 and C6F5 listed in Table 10.1 are dissociative capture values. These Ea were first determined by the magnetron method in the 1960s. The ECD and NIMS values are the most recent and stand in agreement with the earlier magnetron values 0.15. The MGN Ea for the C6F5 radical uses more recent bond dissociation energies to update the original value. Other magnetron Ea for phenyl radicals with three or more halogens on the ring are reasonable since they fall between 2.0 eV and 3.0 eV. Some of these have not been determined by any other method [1, 2, 20].
10.3.2Electron Affinities Determined Using the AMB Method
The AMB Ea are listed in Table 10.2 [21–32]. The AMB method confirmed the magnetron value for tetracyanoquinodimethane and CCl4. It obtained higher values for the quinones that are equal to the EvV. The AMB values of maleic anhydride, Cl2, Br2, I2, NO2, and CS2 are also equal to the current EvV. The AMB Ea for CCl4 and CF3I of about 2 eV are for the ground state. However, two lower values for CF3I have also been reported using AMB studies. The uncertainty in the AMB values is often quoted as 0.20 eV, but their agreement with the EvV is often better than this. The values for the other alkyl halides could exist for an excited state. These will be discussed further in Chapter 11.
ELECTRON AFFINITIES |
241 |
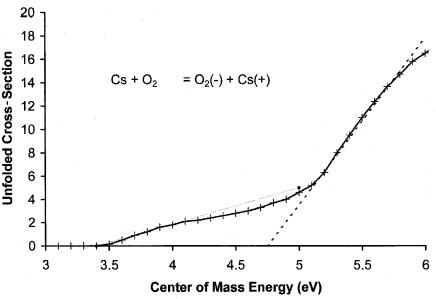
Figure 10.6 Unfolded cross-section for Cs beam reaction with O2, from [33]. The higher extrapolated appearance potential is AP ¼ IP þ E1. With the 3.89 eV ionization potential of Cs this gives E1 ¼ 4.75 3.89 eV ¼ 0.86 eV.
The AMB Ea for O2 and NO are for excited states. In 1971 Freeman postulated that structure observed in the unfolded cross-section for the reaction of a Cs beam with O2 could give a measure of the activation energy for electron attachment to form the ground state of O2( ). In this case the extrapolated appearance potential is AP ¼ IP þ E1. As shown in Figure 10.6, the two AP are 3.44 eV and 4.75 eV. With the 3.89 eV ionization potential of Cs, the first gives Ea ¼ 3.89 3.44 ¼ 0.45 eV for the excited state and the second E1 ¼ 4:75 3:89 ¼ 0:86 eV. This illustrates another interpretation of AMB data to give fundamental experimental information for thermal electron attachment reactions. This E1 has been subsequently measured and confirmed by isotopic exchange experiments and is incorporated in the ECD data analysis [33].
10.3.3Electron Affinities Determined Using Photon Methods
Very few electron affinities of large organic molecules have been determined using photoelectron spectrometry or photodetachment techniques. These are summarized in Table 10.3 [34–47]. Limits to the electron affinities of a large number of nitrobenzenes have been determined using the ECD photodetachment technique. Because these are known to be upper limits, they are only assigned to the AEa in the absence of other measurements. The evaluated Ea of the dinitrobenzenes, nitrotoluenes, and halogenated nitrobenzenes are in agreement with the upper limits

242 NEGATIVE IONS OF ORGANIC MOLECULES
TABLE 10.3 Evaluated Molecular Electron Affinities (in eV) Using the Photon Method
Molecule |
AEa |
NIST |
PES |
PD |
C-EC |
Tetracyanoethylene |
2.90(10) |
3.166 |
— |
2.0 |
2.90 |
p-Benzoquinone |
1.860(5) |
[1.990] |
1.86 |
1.99 |
1.9 |
SF6 |
1.07(5) |
1.070 |
— |
3.16 |
1.0 |
SF6 |
1.07(5) |
1.070 |
— |
0.54 |
1.0 |
NO |
0.86(10) |
0.026 |
0.026 |
— |
0.8 |
C6F6 |
0.86(2) |
0.520 |
0.80 |
— |
0.85 |
CH3NO2 |
0.50 (2) |
0.486 |
0.26 |
— |
0.50 |
I2 |
2.524(5) |
2.524 |
— |
— |
2.33 |
O2 |
1.07(10) |
0.450 |
0.450 |
0.15 |
1.10 |
CS2 |
0.89(2) |
0.512 |
0.895 |
— |
0.85 |
NO2 |
2.273(5) |
2.273 |
2.273 |
— |
2.25 |
Nitrobenzene |
1.00(1) |
1.006 |
1.00 |
1.05 |
1.0 |
c-C8H8 |
0.80(10) |
0.550 |
0.65 |
0.83 |
0.80 |
Perylene |
0.973(5) |
0.973 |
0.973 |
— |
1.00 |
Tetracene |
1.08(4) |
1.067 |
1.067 |
— |
1.08 |
Naphthalene |
0.16(2) |
0.20 |
0.20 |
— |
0.15 |
Coronene |
0.80(5) |
0.470 |
0.470 |
— |
0.68 |
Azulene |
0.84(5) |
0.694 |
0.790 |
— |
0.90 |
Anthracene |
0.68(2) |
0.530 |
0.530 |
— |
0.68 |
|
|
|
|
|
|
established by the ECD photodetachment technique. Since many have only been determined in the gas phase by TCT methods, these are important confirming values [35]. The photodetachment and PES Ea of p-benzoquinone and nitrobenzene are equal to the EvV. Two photodetachment values are reported for SF6, one larger than the AEa due to the change in geometry of the anion and the other lower than the AEa due to an excited state. The PD Ea reported for tetracyanoethylene is significantly lower than the AEa. The excited-state Ea of O2 and NO have been determined using PES. The PES values for C6F6, CS2, SO2, NO2, and other small molecules agree with the EvV [36–40].
The electron affinities of several aromatic hydrocarbons, including naphthalene, azulene, anthracene, tetracene, perylene, and coronene, have been measured using PES, and the Ea of c-C8H8 has been measured by both PES and photodetachment. The Ea for azulene, perylene, and tetracene agree with the AEa [34, 43, 44]. The values for naphthalene, anthracene, and coronene are lower than the AEa by more than the experimental uncertainty and have been assigned to excited states [42, 43, 46]. The Ea for naphthalene is obtained by extrapolating the PES peaks found in anion hydrates to zero water molecules. This gives a negative electron affinity. In the PES of naphthalene, anthracene, and coronene there are indications of a higher electron affinity. In the case of naphthalene and anthracene the intensities of the higher-energy peaks are lower than for the excited state. In the case of coronene the two sets of peaks are of equivalent intensity, as shown in Figure 6.8.
|
|
|
ELECTRON AFFINITIES |
243 |
|
TABLE 10.4 Evaluated Molecular Electron Affinities (in eV) of Selected |
|
||||
Hydrocarbons Using the Collisional Ionization Method [51–53] |
|
|
|||
|
|
|
|
|
|
Molecule |
AEa |
NIST |
C-Ion |
E1=2 |
C-EC |
Biphenylene |
0.40(5) |
(0.89) |
0.89(10) |
0.40(5) |
0.45 |
Anthracene, 1-CH3 |
0.65(2) |
0.550 |
0.55(10) |
0.65(10) |
0.65 |
Benz[a]anthracene |
0.72(2) |
0.390 |
0.39(10) |
0.72(5) |
0.74 |
Coronene |
0.80(10) |
0.470 |
0.47(10) |
0.74(5) |
0.80 |
1,3,5,7-c-C8H8 |
0.80(10) |
0.550 |
0.58(10) |
— |
0.80 |
Benzo[ghi]perylene |
0.89(10) |
0.420 |
0.42(10) |
0.90(10) |
0.90 |
|
|
|
|
|
|
The photodetachment and PES studies of c-C8H8 are interesting because the Ea determined from the first observed peak in the PES is larger than the adiabatic Ea. This occurs because the geometry of the neutral formed by photoionization is different from that of the ground state of the neutral. The anion is planar, while that of the neutral is bent. The lowest-energy peak at 1.1 eV corresponds to the vertical transition from the planar anion to the planar neutral. By estimating the energy to form the planar neutral, an Ea of 0.65 eV was obtained. Thermal charge transfer and kinetic fragmentation values are 0.55(2) eV and 0.60(10) eV, respectively. The photodetachment value is less than 0.82 eV. The Ea for c-C8H8 was reported to be 0.58(2) eV from the single-state ECD model. However, the highest-temperature data point indicates a higher-energy state. The lower value is assigned to an excited state of the anion and the ground-state Ea is closer to the PD onset. The CURES-EC value is 0.8 eV. The uncertainty in the Ea, 0.1 eV, encompasses all the values at twice the uncertainty. It is larger than the nominal value because of the approximations [47–51].
10.3.4 Electron Affinities Determined Using Collisional
Ionization Methods
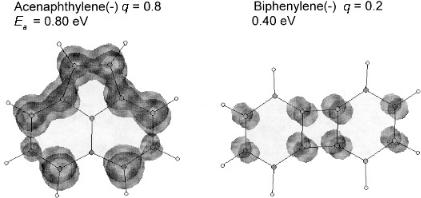
The relative electron affinities of a number of aromatic hydrocarbons have been measured by the collisional ionization of electron bound dimers. Table 10.4 gives the Ea of some aromatic hydrocarbons determined by the collisional ionization method listed in NIST [51–53]. These values are lower than the AEa and assigned to excited states. The Ea of biphenylene is significantly larger than the Ea determined from reduction potentials and cannot be explained. One possibility is that the ion is an isomer of biphenylene and acenaphthylene. To illustrate this point, a READS-TCT calculation is made for the two isomers. The three-dimensional spin densities are shown in Figure 10.7. When an electron is added to the system, the charge density on the acenaphthylene is 0.8q, while that for the biphenylene is 0.2q. This indicates that the Ea of acenaphthylene is greater than that of biphenylene. The CURES-EC calculations agree with this order. The ions observed in the collisional ionization could be either of the two isomers. The observation of excited-state Ea by collisional ionization of aromatic hydrocarbons with fullerenes and with bromosubstituted aromatic hydrocarbons has been observed [52, 53].
244 NEGATIVE IONS OF ORGANIC MOLECULES
Figure 10.7 READS-TCT calculation three-dimensional spin densities for acenaphthylene and biphenylene with one electron added. Eighty percent of the spin resides on acenaphthalene, indicating that the Ea of acenaphthylene is greater than that of biphenylene.
10.4 ELECTRON AFFINITIES DETERMINED USING THE ECD, NIMS, AND TCT METHODS
10.4.1 Electron Affinities of Aromatic Hydrocarbons by the ECD Method
Many of the Ea determined in the ECD are for molecules with only an a region. A large number of these compounds have the same intercept, designated the common intercept, from which the Ea is calculated. The alternate approach is to estimate the temperature range of the a region and to obtain the ‘‘best’’ slope and intercept through the data. Some of these intercepts are higher than the weighted average intercept and some of them are lower. The lower values can be explained by a Qan value lower than 1. The higher values imply a Qan value greater than 1. This is not likely. For these compounds the common intercept value is chosen. For the compounds with intercepts significantly lower than the weighted average the selected value is determined by the fit through the data. The random uncertainties are larger than those obtained using a fixed intercept. For compounds with only two regions the variable intercept values were obtained using a least-squares fit to the high-temperature data. In 1995 the ECD Ea for 20 hydrocarbons were verified with reduction potential data. The Ea were compared to Ea determined from other gas phase techniques and reduction potentials for 7 fullerenes and 15 metallophorphyrins and metal complexes [54]. At that time the Ea of anthracene, tetracene, perylene, and pentacene had been measured by TCT [55]. This led to the postulate of two states for tetracene and anthracene and the assignment of some of the ECD values to excited states [56–59].
In 1999 the Ea were further verified using CURES-EC calculations and electronegativity considerations. The Ea for another 50 aromatic hydrocarbons were
ELECTRON AFFINITIES DETERMINED USING ECD, NIMS, AND TCT METHODS |
245 |
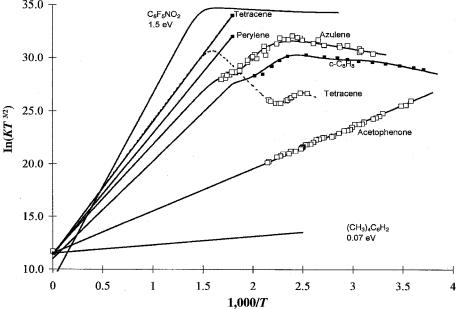
Figure 10.8 Plots of ECD data as ln KT3/2 versus 1,000/T for azulene, tetracene, and C8H6 with multiple a and b regions. Acetophenone, tetramethylbenzene, C6F5NO2, tetracene, and perylene are given for comparison. Table 10.5 provides the parameters. From [39, 49, 57, 59].
determined from a set of reduction potentials published by I. Bergman. M. J. S. Dewar and co-workers had calculated the Ea for all these molecules using MINDO/3. These are referred to as the Bergman Dewar set [60–62]. A complete listing of the AEa for the Bergman Dewar set is included in the appendix. Excited-state electron affinities have been observed for anthracene, cyclooctaterene, acenaphthylene, fluoranthene, azulene, and tetracene in the ECD.
In Figure 10.8 ECD data for acetophenone, azulene, c-C8H8, and tetracene and calculated responses for perylene, tetramethylbenzene, and C6F5NO2 are shown. Table 10.5 gives the parameters used to calculate the curves for azulene, c-C8H8, and tetracene. The lower values are assigned to excited states. Table 10.6 provides the AEa of the hydrocarbons reported in the literature determined using the ECD, the NIST values, reduction potentials, and CURES-EC. The NIST values are those returned from a sequential search for molecules containing only C and H. The ECD values are confirmed by the E1/2 and CURES-EC values. The largest differences between the NIST Ea and the assigned AEa exist for naphthalene and the Ea determined by PES and collisional ionization methods. The NIST ECD Ea for acenaphthylene is known to occur for an excited state based on the use of the constant current mode of detection and comparisons with the fixed frequency data [57–59]. The PES Ea for anthracene and coronene, and the collisional ionization Ea for benzanthracene and benzo[g,h,i]perylene are lower than the EvV by more

246 NEGATIVE IONS OF ORGANIC MOLECULES
TABLE 10.5 Experimental Kinetic and Thermodynamic Properties of Hydrocarbons from ECD Data [57]
Compound |
Ea (eV) |
E1 (eV) |
ln A1 |
|
Qan |
||
c-C8H8 |
0.80(10) |
0.36 |
36.8 |
|
|
1 |
|
c-C8H8 |
0.70(2) |
0.20 |
36.8 |
|
1.0 |
||
c-C8H8 |
0.57(2) |
0.10 |
34.6 |
|
0.1 |
||
Azulene |
0.84(10) |
0.22 |
35.6 |
|
|
1 |
|
Azulene |
0.78(2) |
0.13 |
35.6 |
|
|
1 |
|
Azulene |
0.70(2) |
0.13 |
35.6 |
|
|
1 |
|
Azulene |
0.60(5) |
0.06 |
35.6 |
|
|
1 |
|
Tetracene |
1.08(4) |
0.95 |
37.0 |
|
|
1 |
|
Tetracene |
0.90(4) |
0.80 |
36.0 |
1 |
10 4 |
||
|
|||||||
Tetracene |
0.53(4) |
0.65 |
36.0 |
|
|
1 |
|
*First excited state.
**Second excited state.
***Third excited state.
than the uncertainty and are assigned to excited states, as shown in Tables 10.3 through 10.6. The remaining values are the same as the ECD values.
Table 10.7 gives the AEa for hydrocarbons determined from reduction potentials, electronegativities, and CURES-EC [56]. The MINDO/3 Ea originally reported by Dewar are given for comparison [60]. Also shown are the values of mddG and the group classification used to obtain the Ea from the E1=2 values. The nominal random uncertainty in the Ea is 0.03 eV. This is one-half the differences between each group. The CURES-EC values were adjusted to the E1=2 Ea and have a deviation of less than 0.03 eV. The average deviation between the E1=2 Ea and the MINDO/3 values is 0.07 eV. The Ea obtained from electronegativity considerations is determined from EN ¼ (IP þ Ea)/2 so Ea ¼ 2EN IP, where IP is the ionization potential. The EN of the alternate aromatic hydrocarbons is nominally 4.00 eV. The Ea calculated in this manner agree with the E1=2 Ea with an average deviation of 0.08 eV. Some of the IP have not been measured. The process can be reversed and the IP obtained from IP ¼ 8.00 Ea. For the molecules containing five membered rings the value of EN is larger, 4.37 eV. The IP for fluoranthenes can be calculated from IP ¼ 8.74 Ea. These are especially interesting values because they are precursors to the fullerenes. The electronegativity of the fullerenes is 4.5 eV so IP ¼ 9.0 Ea [57].
10.4.2 Electron Affinities of Organic Carbonyl Compounds by the ECD Method
Besides the aromatic hydrocarbons the Ea of a number of aromatic carbonyl compounds have been determined using the ECD. These include substituted acetophenones, benzaldehydes, benzophenones, benzoates, phthalates, acetonaphthone, naphthaldehydes, and anthracene and phenanthrene aldehydes. Like the aromatic hydrocarbons, the majority of these compounds only undergo nondissociative