

Chen The electron capture detector
.pdfELECTRON AFFINITIES OF BIOLOGICAL MOLECULES |
307 |
Figure 12.6 Geometry-optimized forms of cytosine anion in the keto and enol forms, AM1 calculations. Note the twisted amino group and bent N H bond in the keto anion and the bent O H bond in the enol form.
The use of 5-fluorouracil in the treatment of cancer is well known, giving added significance to the electron affinities of the substituted uracils. The electron affinity of the 5-fluoro-, chloro-, and bromo-uracils have been calculated by two groups using density functional theory [30, 31]. We calculated these quantities utilizing CURES-EC and obtain systematically higher values. In all cases the Ea of the halogenated uracil is larger than that of uracil. The density functional value for U is 0.18 eV, while that for 5-FU is 0.45 or 0.48, an increase of 0.3 eV upon substitution of a fluorine atom. There is a systematic increase in the Ea for the other halogenated uracils in both the density functional and CURES-EC calculated values. The increments agree with the substitution effects discussed in Chapter 11.
12.3 ELECTRON AFFINITIES OF BIOLOGICAL MOLECULES FROM REDUCTION POTENTIALS
Absolute electron affinities can be obtained by classification of biological molecules to establish different values of G. This is illustrated for riboflavin, vitamin K, vitamin A, polyazines, and hydroxyprimidines. The Ea of these compounds are also predicted by substitution and replacement rules. Those for the diazines range from 0.2 eV to 0.4 eV. The values for 1,2,4 triazine and 1,2,4,5 tetrazine are 0.9 eV and 1.7 eV. The replacement of an additional CH by N increases the Ea by 0.6 eV. Therefore, the predicted values for pentazine and hexazine are 2.2 eV and 2.9 eV. The CURES-EC method gives better approximations to these Ea and can differentiate between isomers.
The prototype molecule for vitamin A, a conjugated olefin, is decapentaene. The half-wave reduction potentials of the linear conjugated olefins can be converted to absolute Ea. The olefins are classified as A molecules, with G ¼ 2:0 eV. The values calculated from the reduction potentials are the only absolute Ea of the

308 BIOLOGICALLY SIGNIFICANT MOLECULES
TABLE 12.5 Electron Affinities of Biologically Related Compounds (in eV)
|
Experimental |
|
Predicted |
|||
|
|
|
|
|
|
|
|
|
|
|
S&R |
CEC |
MCCI |
Compounds |
Gas |
E1=2 |
||||
Pyridine |
0.0 |
— |
— |
0.00 |
AM1(0011) |
|
Pyrimidine |
>0 |
0.2 |
|
0.3 |
0.22 |
AM1(2222) |
Pyrazine |
>0 |
0.36 |
0.3 |
0.38 |
AM1(0023) |
|
Pyradazine |
>0 |
0.31 |
0.3 |
0.33 |
AM1(0023) |
|
1,3,5-Triazine |
>0 |
0.5 |
|
0.9 |
0.50 |
PM3(0032) |
1,2,3-Triazine |
— |
— |
0.9 |
1.08 |
AM1(0000) |
|
1,2,4-Triazine |
— |
0.91 |
0.9 |
0.89 |
AM1(1100) |
|
1,2,3,4-Tetrazine |
— |
— |
1.6 |
1.62 |
AM1(0000) |
|
1,2,3,5-Tetrazine |
— |
— |
1.6 |
1.50 |
AM1(0000) |
|
1,2,4,5-Tetrazine |
— |
1.67 |
1.6 |
1.67 |
PM3(0033) |
|
Pentazine |
— |
— |
2.2 |
2.17 |
AM1(3300) |
|
Hexazine |
— |
— |
2.8 |
2.88 |
AM1(3300) |
|
1-OH-pyrimidine-ol |
— |
— |
0.65 |
0.71 |
AM1(3300) |
|
3-OH-pyrimidine-ol |
— |
— |
0.65 |
0.61 |
AM1(3300) |
|
6-OH-pyrimidine-ol |
— |
— |
0.65 |
0.58 |
AM1(3300) |
|
3-OH-pyrimidine-one |
— |
— |
0.65 |
0.77 |
AM1(3300) |
|
Ethylene |
— |
— |
— |
1.04 |
AM1(3300) |
|
Butadiene |
— |
0.0 |
|
0.0 |
0.00 |
AM1(2200) |
Hexatriene |
— |
0.44 |
0.4 |
0.41 |
AM1(0021) |
|
Octatetrene |
— |
0.66 |
0.6 |
0.64 |
M/3(2100) |
|
Decapentaene |
— |
0.85 |
0.8 |
0.80 |
M/3(2100) |
|
Cubene |
0.50 |
0.5 |
|
— |
0.50 |
M/3(0021) |
Vitamin A alcohol |
— |
0.75 |
0.8 |
0.76 |
M/3(0033) |
|
Vitamin A acetate |
— |
0.9 |
|
0.8 |
0.91 |
M/3(0023) |
1,4-Naphthoquinone |
1.81 |
— |
1.88 |
1.89 |
AM1(0033) |
|
Vitamin K |
— |
1.75 |
1.8 |
1.81 |
AM1(0033) |
|
Guanine |
— |
1.51 |
1.3 |
1.51 |
AM1(3300) |
|
Riboflavin |
— |
1.65 |
1.3 |
1.66 |
M/3(0000) |
|
|
|
|
|
|
|
|
conjugated olefins. The prototype for vitamin K is naphthoquinone with an G of 2.2 eV and the prototype for riboflavin is guanine. These initial assignments are based on the similarity of the molecules to the prototype molecules. The calculated charge densities agree with the intuitive assignment. The Ea determined from the E1=2 values, the predicted Ea, CURES-EC Ea for these compounds, and prototype molecules are given in Table 12.5. The agreement between the predicted and CURES-EC values is good. The predicted and calculated values of the Ea for the hydroxy-pyrimidines support the value for cytosine since they are all larger than for cytosine that has an additional NH2 group.
The electron affinities of aromatic heterocyclic compounds have been measured by TCT and are included in the NIST tables [21]. At the same time the electron affinities of pyridine, the diazines, and aza-substituted phenanthrenes were

ELECTRON AFFINITIES OF BIOLOGICAL MOLECULES |
309 |
TABLE 12.6 Selected Adiabatic Electron Affinities (in eV) for AGCUT, Related Compounds, and Nitrogen Heterocyclic Molecules
Molecule |
Selected |
NIST |
TCT/ET |
E1=2 |
C-EC |
Vitamin K |
1.81(10) |
— |
— |
1.81(10) |
1.83 |
1,2,4,5-Tetrazine |
1.67(10) |
— |
— |
1.67(10) |
1.67 |
Riboflavin |
1.60(10) |
— |
— |
1.60(10) |
1.66 |
Guanine |
1.51(5) |
— |
— |
1.51(5) |
1.51 |
9,10-Diazaanthracene |
1.31(10) |
1.31 |
1.31(10) |
1.00(10) |
1.35 |
1,6,7-Triazanaphthalene |
1.00(10) |
1.00(10) |
1.00(10) |
— |
1.01 |
Adenine |
0.95(5) |
0.01 |
— |
0.95(5) |
0.95 |
1,2-Diazaphenanthrene |
0.92(10) |
0.92 |
0.92(10) |
0.99(10) |
0.95 |
9-Azaanthracene |
0.91(10) |
0.91 |
0.9(10) |
0.91(10) |
0.91 |
1,2,4-Triazine |
0.91(10) |
— |
— |
0.91(10) |
0.89 |
Vitamin A acetate |
0.90(10) |
— |
— |
0.90(10) |
0.91 |
Uracil |
0.80(5) |
— |
0.8(1) |
0.80(5) |
0.80 |
Thymine |
0.79(5) |
— |
0.7(1) |
0.79(5) |
0.77 |
Vitamin A alcohol |
0.75(10) |
— |
— |
0.75(10) |
0.76 |
1,3,5-Triazine |
0.50(10) |
0.45 |
0.45(10) |
0.50(10) |
0.50 |
1,2-Diazanaphthalene |
0.72(10) |
0.72 |
0.72(10) |
0.82(10) |
0.75 |
1,4-Diazanaphthalene |
0.71(10) |
0.71 |
0.71(10) |
0.80(10) |
0.73 |
1,3-Diazanaphthalene |
0.58(10) |
0.58 |
0.58(10) |
0.71(10) |
0.60 |
Cytosine |
0.56(5) |
— |
0.6(1) |
0.56(5) |
0.58 |
Quinoline |
0.50(15) |
— |
— |
0.40(15) |
0.45 |
Pyrazine |
0.36(10) |
— |
— |
0.36(10) |
0.38 |
Pyradazine |
0.31(10) |
— |
— |
0.31(10) |
0.33 |
Pyrimidine |
0.20(10) |
— |
— |
0.20(10) |
0.22 |
|
|
|
|
|
|
The values in parentheses are the uncertainties in the last figure.
estimated from half-wave reduction potentials using two parameters. If a unit slope is assumed, the equation is the same as for the purines and pyrimidines: Ea ¼ 2:48ð5Þ þ E1=2. Table 12.6 presents the Ea measured in the gas phase and with E1=2 values. One of the molecules is acridine, originally used as a standard for the calibration of the Ea for AGCUT. Another is 9,10-diazaanthracene, which is analogous to the structure in riboflavin. Riboflavin with additional nitrogen atoms and hydroxyl groups should have an Ea greater than 9,10-diazaanthracene. The reduction potential data for riboflavin give an Ea of 1.65 eV, as compared to the TCT value of 1.31 eV for 9,10-diazaanthracene. The CURES-EC calculations support the TCT values. The substitution of a single N for a CH in naphthalene increased the Ea by about 0.3 eV. The increase from anthracene to acridine is 0.2 eV. With the data in Table 12.6 we can determine the effect of multiple replacements from gas phase data. The Ea for the diazanaphthalenes are all roughly 0.7 eV or 0.5 eV greater than naphthalene, or 0.25 eV per nitrogen replacement. Triazanaphthalene is 1.0 eV or another 0.3 eV higher. The monocyclic N10 has a predicted electron affinity of 4.0 eV or 0.4 eV/N. This is compared to the cyclic N6 with a predicted Ea of 2.9 eV. The Ea of phenazine, 9,10-diazaanthracene, is

310 BIOLOGICALLY SIGNIFICANT MOLECULES
0.4 eV higher than that for acridine. The increase in the Ea for the replacement of a CH by an N is about 0.3 eV. Based on these values and an Ea of 0.30 eV for phenanthrene, the Ea for 9- or 10-azaphenanthrene should be about 0.5 0.15 eV, as obtained from the single-point ECD data given in Table 12.4. Likewise, the value for the 9,10-diazaphenanthrene measured by TCT is yet another 0.3 eV higher or 0.9 eV.
12.4GAS PHASE ACIDITIES OF NUCLEIC ACIDS
Along with the determinations of the reduction potentials for the purines and pyrimidines, the negative-ion mass spectra of AGCUT and purine were obtained. Experiments on SF6, C6F5Cl, and C6F6 (see Chapter 5) demonstrated that thermal electron capture took place in the ion source. It was anticipated that the parent negative ions would be formed. However, instead the parent minus a hydrogen atom PminH( ) was observed. Thus, dissociative thermal electron attachment occurs and the energy for dissociative electron attachment was small, between 0.5 eV and 1.0 eV. The electron affinities of the radicals and bond dissociation energies were unknown at that time, so the data were set aside.
When it was demonstrated that the semi-empirical calculations could reproduce the experimental Ea of AGCUT, the gas phase acidities were calculated. Similar calculations had been made earlier using the standard AM1 and PM3 parameters without MCCI [32]. The calculated N H bond dissociation energies are 3.95 eV for G, A, and T and 4.15 eV for C and U. These results are shown in Table 12.7 with the -EDEA that range from 0.5 eV to 0.9 eV. Also shown are density functional calculated values. Based on current experimental data for the gas phase acidity of U, 14.4 0.2 eV determined by TCT, the earlier values are systematically low but within the uncertainty of 0.2 eV [32–36]. In order to obtain the highest possible GPA values (weaker acids), the minimum electron affinities of the PminH have been recalculated with AM1(0033). The minimum Ea is 3.25 eV for cytosine- H and 3.48 eV for guanine-H. This range of 0.3 eV is considerably smaller than that for the molecules, 1 eV. The Ea are comparable to the values for the halogens, 3.07 eV
TABLE 12.7 Gas Phase Acidities and Electron Affinities (in eV) of Radicals and Dissociation Energies
Molecule |
Exp-GPA |
D(N H) EaðRÞ |
EDEA |
GPACEC |
GPAPM3 |
GPADF |
|
Uracil |
14.4(2) |
4.15 |
3.38 |
0.77 |
14.4(2) |
— |
14.4(1) |
Thymine |
14.2(3) |
3.95 |
3.36 |
0.59 |
14.2(2) |
14.0 |
14.5(1) |
Cytosine |
14.6(3) |
4.17 |
3.25 |
0.92 |
14.5(2) |
14.2 |
15.0(1) |
Adenine |
14.2(3) |
3.96 |
3.40 |
0.56 |
14.2(2) |
14.2 |
— |
Guanine |
14.2(3) |
4.10 |
3.48 |
0.59 |
14.2(2) |
14.2 |
— |
5-F-uracil |
— |
4.10 |
3.48 |
0.52 |
14.2(2) |
— |
— |
5-Cl-uracil |
— |
4.14 |
3.50 |
0.64 |
14.2(2) |
— |
— |
5-Br-uracil |
— |
4.12 |
3.66 |
0.46 |
14.1(2) |
— |
— |
|
|
|
|
|
|
|
|
MORSE POTENTIAL ENERGY CURVES FOR THYMINE AND CYTOSINE |
311 |
to 3.61 eV. When combined with the bond dissociation energies, AGCUT are among the strongest organic acids. The gas phase acidities range from 14.2 eV to 14.5 eV for adenine to cytosine. All the theoretical values agree within the uncertainties. The GPA are remarkably similar for A, G, and T. The density functional GPA for U is less than that for T, as opposed to the CURES-EC values. The GPA for C is the largest (weakest acid), which agrees with the order of the collisional dissociation of deprotonated dinucleotides, which is A > T > G > C or G > A > T > C depending on the nature of the terminus base [36]. Based on these calculations, the NIMS values can be scaled to the experimental GPA for U and the relative values of -EDEA to obtain the EDEA given in Table 12.7. The uncertainty is taken as 0.3 eV based on the range of observed values of the -EDEA in ECD studies, which is 0.5 eV to 1.0 eV.
The GPA, calculated bond dissociation energies, and EDEA of the halogenated uracils are reasonable. These are also strong organic acids. The major difference in these molecules and uracil is the strength of the C X bond. The -EDEA in the C F dimension in fluorouracil is greater than for the N H dissociation of the anion. In the case of the chloro and bromo compounds the -EDEA is comparable to that in the N H dimension. There will be two dissociation limits in the C X dimension, one leading to the halogen anion plus the U-yl radical and the other leading to the U-yl radical anion plus a halogen. The Ea of the U-yl radical was calculated to be 2.30 eV using density functional theory and the AM1(0000) CURES-EC. The formation of the halogen anions has been observed experimentally [33]. Potential energy curves illustrating these dissociations were calculated in 2002 [32, 33]. The Ea for the molecules were calculated and it was concluded that all the halouracil anions in the gas phase have multiple bound electronic states. This supports the calculations of Herschbach negative-ion Morse potential energy curves in multiple dimensions from experimental data for C and T [7].
12.5 MORSE POTENTIAL ENERGY CURVES FOR THYMINE AND CYTOSINE
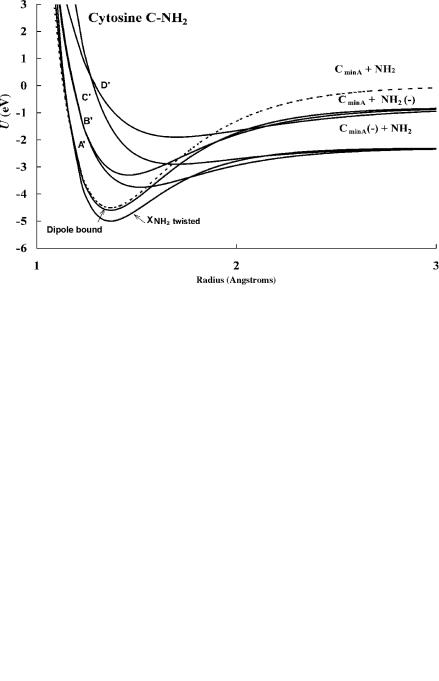
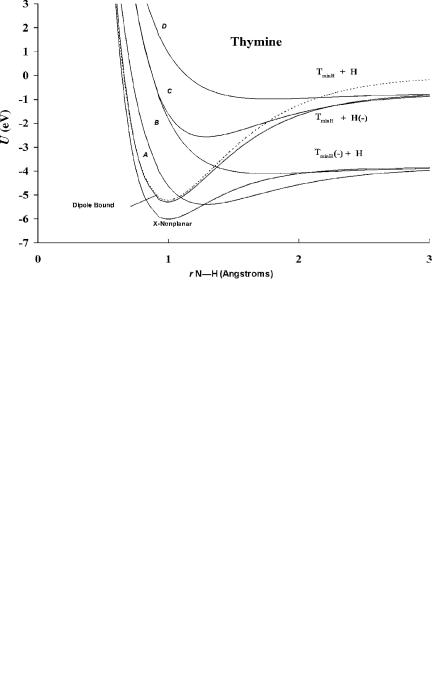
With gas phase acidities and electron impact data Morse potential energy curves can be calculated to explain the differences in the electron impact data for C and T. Recall that the VEa for C is 0.0 eV and 1.4 eV, while that for T is 0.2 eV based on the electron impact spectra. The obvious difference is that C has an NH2 group attached to the ring, whereas T does not so C can dissociate in the C NH2 dimension. The C NH2 bond energy is calculated to be 4.42 eV, while the Ea of the radical formed by the loss of the NH2 group is 2.35 eV. This radical is analogous to that formed in the halouracils by the loss of the halide ion. In the ground state of the anions of G, A, and C, the NH2 group is twisted relative to the plane, N H is bent, and the rings are nonplanar, as shown in Figure 12.6. In the case of T the negative ion is nonplanar and the pyrrole N H bent.
From the electron impact data four valence-state curves can be drawn. In Figure 12.4 the energy-level diagrams obtained from experimental data were shown.

312 BIOLOGICALLY SIGNIFICANT MOLECULES
Table 12.8 lists the Morse parameters and experimental data used to construct these curves. These curves could not be constructed without the gas phase acidities and bond dissociation energies obtained from the electron impact and NIMS experiments. The curves in the C NH2 dimension for cytosine are shown in Figure 12.7, those for T in the N H dimension are illustrated in Figure 12.9. The curves for C and T in this dimension are similar. The ion distributions for the parent negative ions are shown in Figures 12.8 and 12.10. From these curves the vertical transitions lead to a temporary anion that can dissociate or be stabilized to the stable ground-state parent negative ion. Thus, the parent negative ion for C observed at 1.4 eV results from the curve leading to dissociation in the C NH2 dimension. The low-energy dissociative curve is also evident in Figure 12.9 [7].
The formation of the parent negative ions at 3.4 eV and 4.5 eV proceeds via vertical processes that form a temporary negative ion which can then be stabilized to
TABLE 12.8 Morse Parameters and Dimensionless Constants
Molecule |
kA |
kB |
kR |
De (eV) |
re (pm) |
n (cm 1) |
AEa |
VEa |
Cytosine N H |
1.000 |
1.000 |
1.000 |
4.27 |
99.4 |
3,470 |
— |
— |
Dipole bound |
0.895 |
1.064 |
0.908 |
3.76 |
100 |
3,470 |
0.23 |
0.23 |
X |
0.357 |
1.419 |
0.367 |
1.48 |
100 |
2,900 |
0.56 |
0.45 |
A |
0.485 |
0.867 |
1.015 |
1.05 |
124 |
1,590 |
0.15 |
0.32 |
B |
0.239 |
0.761 |
1.022 |
0.24 |
186 |
625 |
— |
3.30 |
C |
0.485 |
0.867 |
1.015 |
0.99 |
138 |
1,450 |
— |
3.40 |
D |
0.232 |
0.677 |
0.977 |
0.23 |
196 |
550 |
— |
5.40 |
Cytosine C NH2 |
1.000 |
1.000 |
1.000 |
4.51 |
137 |
1,720 |
— |
— |
Dipole bound |
0.841 |
1.090 |
0.841 |
3.90 |
137 |
1,700 |
0.08 |
0.08 |
X0 |
0.621 |
1.254 |
0.621 |
2.91 |
137 |
1,700 |
0.56 |
|
0.56 |
||||||||
A0 |
0.610 |
1.096 |
0.814 |
2.14 |
146 |
1,275 |
0.1 |
0.33 |
B0 |
0.369 |
1.012 |
0.559 |
1.15 |
151 |
860 |
— |
1.4 |
C0 |
0.699 |
1.000 |
0.909 |
2.50 |
146 |
1,260 |
— |
1.4 |
D0 |
0.207 |
0.878 |
0.484 |
0.43 |
170 |
450 |
— |
5.0 |
Thymine N H |
1.000 |
1.000 |
1.000 |
4.17 |
99.4 |
3,470 |
— |
— |
pyrrole |
|
|
|
|
|
|
|
0.06 |
Dipole bound |
0.844 |
1.089 |
0.844 |
3.52 |
99.4 |
3,470 |
0.06 |
|
X |
0.364 |
1.447 |
0.371 |
1.49 |
100 |
3,000 |
0.79 |
0.79 |
A |
0.405 |
0.934 |
0.764 |
0.89 |
129 |
1,500 |
0.15 |
0.30 |
B |
0.256 |
0.752 |
1.145 |
0.24 |
186 |
625 |
— |
3.40 |
C |
0.547 |
0.871 |
1.139 |
1.10 |
136 |
1,550 |
— |
3.40 |
D |
0.225 |
0.725 |
0.892 |
0.24 |
182 |
600 |
— |
5.40 |
Thymine N H |
1.000 |
1.000 |
1.000 |
5.21 |
99.4 |
3,470 |
— |
— |
(amide) |
|
|
|
|
|
|
|
0.06 |
Dipole bound |
0.875 |
1.069 |
0.875 |
4.57 |
99.4 |
3,470 |
0.06 |
|
X0 |
0.422 |
1.342 |
0.429 |
2.16 |
100 |
3,000 |
0.79 |
|
0.79 |
||||||||
A0 |
0.515 |
0.897 |
0.888 |
0.88 |
129 |
1,700 |
0.15 |
0.30 |
B0 |
0.201 |
0.880 |
0.802 |
0.26 |
176 |
685 |
— |
3.40 |
C0 |
0.616 |
0.911 |
1.071 |
1.85 |
129 |
1,880 |
— |
3.40 |
D0 |
0.187 |
0.821 |
0.704 |
0.26 |
178 |
635 |
— |
5.40 |
MORSE POTENTIAL ENERGY CURVES FOR THYMINE AND CYTOSINE |
313 |
Figure 12.7 Morse potential energy curves for cytosine in the C NH2 dimension calculated from Ea and data in Figure 12.4 [7, 28]. The molecular anion formed at 1.5 eV comes from the vertical transition to the A0 and B0 curves. The parameters are given in Table 12.8.
Figure 12.8 The calculated and experimental molecular ion distributions for electron impact on cytosine [7, 28].
314 BIOLOGICALLY SIGNIFICANT MOLECULES
Figure 12.9 Morse potential energy curves for thymine in the N H dimension calculated from Ea and data in Figure 12.5 [7, 28]. The molecular anion formed at 0.2 eV comes from the vertical transition to the A curve, while those at 0.8 eV come from the B and C curves and the one at 6 eV comes from the D curve. There is no peak at 1.5 eV, as occurs in cytosine. The parameters are given in Table 12.8.
Figure 12.10 The calculated and experimental molecular ion distributions for electron impact on thymine [7, 28].
GAS PHASE ACIDITIES AND ELECTRON AFFINITIES OF THE AMINO ACIDS |
315 |
the ground state or dissociate via an exothermic process. Since the VEa and Ea are positive but the EDEA is negative, the ground-state curve is an M(2) curve and the excited-state curves for the states with positive Ea and negative VEa are M(1) curves. The higher-energy curves are D(0) curves but also Mc(0) because they can be stabilized to the ground-state anion via the dipole bound state. In these curves the anions are formed with a diminished attractive force, as indicated by the values of kA in Table 12.8 that are lower than 1. This is different from the diatomic molecules in the ground state. For these molecules both the attractive and repulsive portions of the curve are increased.
12.6 GAS PHASE ACIDITIES AND ELECTRON AFFINITIES OF THE AMINO ACIDS
The activation energies for dissociative electron capture of the esters and acetic anhydride give D(C O) Ea(acetate). By incorporating the data for bond dissociation energies found in the literature, the Ea of the acetate radical can be obtained. In the sequential NIST table the Ea of the acetate radical is 3:40 0:30 eV by laser photodetachment, but the value from the ECD data using more recent bond dissociation energies is 3:18 0:05 eV, while an earlier electron impact value is 3:30 0:20 eV. The weighted average of these values is 3:19 0:05 eV, the current best value. The electron affinities of many radicals of saturated organic acids vary from 3.14 eV to 3.24 eV. This provides another example of an evaluation of the Ea that requires searching the complete NIST tables rather than only taking the most recent value. The MNDO(0031) CURES-EC value for the electron affinity of the acetate radical is 3.16 eV [37, 38].
The gas phase acidities of only three amino acids—glycine, alanine, and L- histidine—have been measured [39–42]. These are higher than the GPA for the purines and pyrimidines because the O H bond in the amino acids is stronger than the N H bond in the purines and pyrimidines, while the Ea of the radicals are only slightly larger than those of the P H radicals. We have calculated the electron affinities of the molecules and radicals for these amino acids using CURES-EC. The energies of the negative ions of the free acids are about equal to the energies of the neutral molecule for acetic acid, glycine, and alanine. Thus, the current best estimate of the A Ea for acetic acid, glycine, and alanine is approximately zero. The values for tyrosine and phenylalanine are about 0 eV to 0.3 eV, while that for histidine is higher.
The experimental and CURES-EC electron affinities of the radicals are glycine- H: 3.37(10), 3.38 eV; alanine-H: 3.42(13), 3.40 eV; and histidine-H: 3.84(19), 3.90 eV. The value for histidine-H is one of the largest experimental or CURES-EC Ea for an amino acid radical. Its GPA is also among the lowest of the amino acids and is comparable to that of uracil, 14.4(2) eV. Glycine with a GPA of 14.7(2) eV is a weaker gas phase acid than histidine or cytosine. The Ea of the radical from aspartic acid and tyrosine are about 3.8 eV for AM1(0000), giving them a GPA comparable to
316 BIOLOGICALLY SIGNIFICANT MOLECULES
that of cytosine. A most remarkable observation is that very little experimental or theoretical Ea or GPA are available for the amino acids.
12.7 THE CALCULATION OF THE ECD AND NIMS TEMPERATURE DEPENDENCE
Very little experimental work using ECD has been done on heterocyclic molecules. Some data have been obtained at a single temperature and were used to obtain Ea. Some Ea have been measured with TCT and/or E1=2 techniques and can be used to predict the ECD or NIMS temperature dependence. The temperature dependence of the compounds with similar Ea can be predicted by assuming a single state and value of Qan. The ECD response for pyridine has been determined to be low. The response for substituted pyridines should be similar to those for substituted benzenes. The compounds with Ea less than about 0.6 eV should exhibit only a single region. The ECD temperature dependence of quinoline should be like that of benzaldehyde, while that for acridine should be like the temperature dependence of benz[a]pyrene.
The ECD response for the esters of the amino acids should be similar to that of the acetates. The CURES-EC calculated value for the methyl ester of glycine is 0.2 eV, approximately the same as that for ethyl acetate. By forming the trifluoromethyl ester of glycine, the electron affinity is increased to over 1.5 eV, making the compound a maximum capturing analyte. The amino acids have been analyzed in the ECD by making such electronegative derivatives. Very low limits of detection can be achieved, similar to those of some pesticides. For these cases the temperature dependence should be low [43–46].
The electron attachment cross-section for thymine is reported to be as large as that for SF6 [27]. Thus, with a value of Q ¼ 1, A1 ¼ Amax; E1 < 0:2 eV and the assumption of stable negative-ion formation of an excited state at about 0.5 eV, the curves shown in Figure 12.11 are calculated using the standard ECD equation for two states. These curves can also be calculated by assuming dissociative capture. With the N H bond dissociation energy the quantity D Ea is about 0.5 eV to 0.9 eV (see Table 12.7). With this value the temperature dependence (if we assume dissociative electron attachment) is shown in Figure 12.12. This indicates a higher ECD response than if nondissociative capture is assumed. For both cases the response for cytosine is much smaller (three orders of magnitude at 500 K) than for the other compounds. The optimum temperatures for the analyses would be the highest temperatures. The response factors for adenine and guanine reach saturation. The response for thymine does not occur at saturation, but will be large. Perhaps the most important part of the calculation is the lower response predicted for cytosine. To our knowledge there are no routine analyses of these compounds using the ECD. Techniques have been developed to determine concentrations of the nucleic acids by forming derivatives. It was reported that as few as 0.3 pg to 5.0 pg of thymine or 5-fluorouracil could be detected. With this large a response and the predicted temperature dependence of the parent compounds, these derivatives should have very little temperature dependence [47, 48].