

Chen The electron capture detector
.pdfTRIATOMIC MOLECULES AND ANIONS |
217 |
Figure 9.17 ECD data for N2O, CO2, CS2, and COS plotted as ln KT3/2 versus 1,000/T, [90–92].
Figure 9.18 Photoelectron spectra of N2O, replotted from [100].
218 DIATOMIC AND TRIATOMIC MOLECULES AND SULFUR FLUORIDES
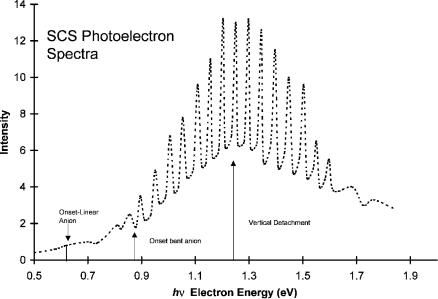
Figure 9.19 Photoelectron spectra of CS2, replotted from [94].
onset for the bent form of the anion appears at 0.5 eV. The vertical detachment energy for the bent anion is 1.4 eV [100].
Thermal electron attachment to nitrous oxide has been studied for more than 75 years. In spite of this extensive experimental and theoretical work the adiabatic electron affinity of N2O remains uncertain. The reported electron affinities are 0.0 0.1 eV, 0.22 0.2 eV; an upper limit of 0.76 0.1 eV is determined by PES [92, 98–103]. By fitting the ECD data to an expanded kinetic model, the data can be attributed to two states. The Ea obtained from the ECD data are0.17 0.05 eV for the linear anion and 0.40 0.15 eV for the bent anion. The larger uncertainty in the ECD value results because the transition temperature to dissociative electron attachment cannot be determined. If the calculated curve is extended to the highest temperature, the Ea is 0.5 eV and the E1 value is 0.5 eV. If it is terminated as shown in the second curve at approximately 350 K, the Ea is 0.3 eV and the E1 is 0.4 eV. The ‘‘best’’ value of the AEa is thus 0.40(15) eV.
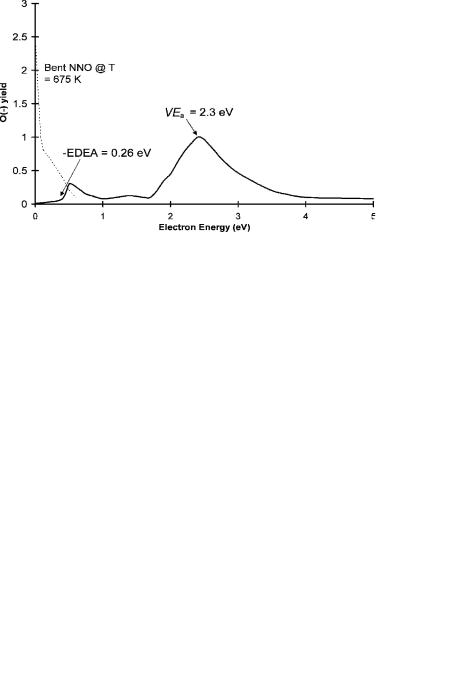
Figure 9.20 is the most recent electron impact spectrum for N2O [98]. The broad peak at 2.2 eV was observed earlier, but that at 0.5 eV was not. The peak at 0.0 eV gives the activation energy for the formation of O( ) of 0.21 eV, which is equal toEDEA [99]. From earlier electron impact data that goes to higher temperatures, the activation energy is 0.5 eV, as observed for the ECD data. This is attributed to the bending of the neutral so that dissociative electron attachment can take place. Consequently, the lower-temperature data could result from unimolecular dissociation, whereas the higher activation energy might be due to the crossing of the bent
TRIATOMIC MOLECULES AND ANIONS |
219 |
Figure 9.20 Electron impact spectra of N2O, replotted from [98].
anions and neutrals. Some of these crossings could lead to the molecular ion, which could then undergo thermal detachment.
The CURES-EC Ea are 0.10 eV for the formation of linear anion and 0.50 eV for the bent anion of N2O. In Figure 9.21 the relative positions of the vertical electron affinities can be seen at constant angles. At 180 the neutral is above the anion,
Figure 9.21 The energy of the neutral and negative ions of CS2 and N2O as a function of the bending angle calculated using CURES-EC and AM1.
220 DIATOMIC AND TRIATOMIC MOLECULES AND SULFUR FLUORIDES
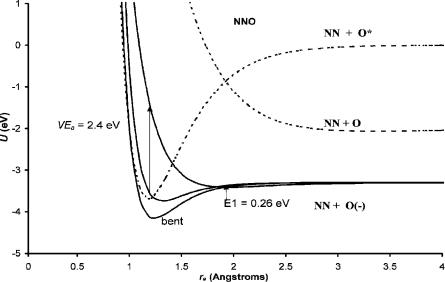
Figure 9.22 Morse potential energy curves for the neutral and negative-ion states of N2O.
but at 140 the energy of the anion is below that of the linear neutral. The calculated vertical detachment energy is 1.4 eV and agrees with experiment, as shown in Figure 9.21.
With these data Morse potential energy curves can be calculated for the linear and bent forms of the anion. These are shown in Figure 9.22. The dissociation of the neutral to the lowest level is spin-forbidden, giving a maximum in the neutral curve. Two linear anion curves are drawn. The bond dissociation energy of one is lower than the other. The lower curve is responsible for the 0.5 eV vertical attachment peak, while the higher curve with less bonding is responsible for the 2.3 eV vertical attachment peak. These curves are both Dð0Þ curves since they lead to dissociation in the Franck Condon region. However, the lower curve is a Mcð0Þ curve since it crosses the long-range anion curve below the dissociation limit, while the upper curve is Dcð0Þ since it crosses that curve above the dissociation limit. The ground-state Mð2Þ curve is bent and will intersect the ground-state neutral on the backside. The PES of N2O( ) arises primarily from transitions of the bent anion to the bent neutral. Improved photoelectron spectra could resolve many of the questions that still exist for N2O.
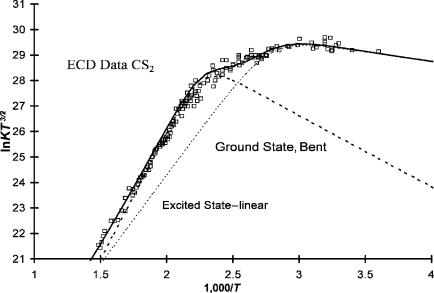
Of these four molecules the electron affinities of CS2 are the most precise and accurate. Two thresholds are observed in the PES for CS2, but the electron affinity obtained from the lower-energy onset was not reported. These can be seen in the high-resolution PES for CS2 in Figure 9.19. Shown in Figure 9.23 is an expanded plot of the ECD data with the slopes drawn in the two regions. The electron affinities of these two states are 0.6 0.05 eV and 0.89 0.02 eV. Figures 9.17, 9.19,
TRIATOMIC MOLECULES AND ANIONS |
221 |
Figure 9.23 ECD data for CS2 plotted as ln KT3/2 versus 1,000/T. The resolved curves are associated with the linear and bent anions.
and 9.23 clearly show that two electronic states of CS2( ) can be observed in the ECD and PES experiments. Two negative-ion states have also been observed in the same Rydberg electron transfer experiment [95]. In addition, different values have been reported using the same technique. Two TCT values, 0.53(10) and 0.9(2), and two AMB values, 0.6(2) and 1.0(2) eV, have been reported. If the lower values are assigned to the linear anion, the data are reconciled.
The CURES-EC calculations support the two electron affinities. The calculations of the energies as a function of bond angle give additional data for the calculation of potential energy curves, as shown in Figure 9.22 along with those of N2O. The calculated VEa for the bent-to-bent transition is in agreement with the PES data. The lowest energy for dissociative electron attachment is more than 2 eV so only molecular ion formation can take place with thermal electrons.
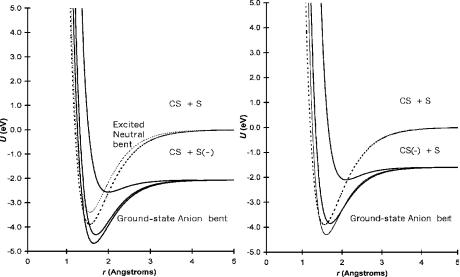
The dissociation in the C S dimension has two limits: one leading to CS þ S( ) and the other leading to CS( ) þ S. Figure 9.24 gives the Morse potentials for the linear and bent neutrals and anions for CS2 leading to these two dissociation limits. The electron affinities used to construct the curves in the CS þ S( ) dimension are the two experimental values. The crossing of the linear anion with the linear neutral occurs approximately at the internuclear distance of the neutral. The ‘‘backside’’ crossing of the ground state requires activation energy, as shown in the resolved curves for the ECD data in Figure 9.23. Vertical electron affinity is obtained from the PES spectra and CURES-EC calculation. The vertical transition for the bent anion to the bent neutral occurs at about 1.25 eV, as shown in Figure 9.20.
222 DIATOMIC AND TRIATOMIC MOLECULES AND SULFUR FLUORIDES
Figure 9.24 Morse potential energy curves for the neutral and negative-ion states of CS2 for the linear and bent forms.
The transition for the linear anion to the linear neutral has a lower VEa. The anion curves are both Mð2Þ and Mcð2Þ curves. There is also a Dð0Þ=Dcð0Þ curve, which leads to S( ) at about 3.6 eV. Similar curves can be drawn to the dissociation limit of CS( ) þ S. The electron affinity of CS is uncertain with one value at 0.20(2) eV and the other at 1.6(3) eV. Using 1.6 eV and the same bond orders as utilized for the two lower negative-ion curves, we obtain two low-lying curves: a Mð1Þ and Mð0Þ. The Dð0Þ curve gives CS( ) at an electron energy of 6.2 eV.
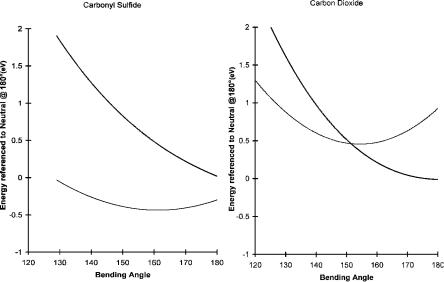
The reported electron affinities of COS are about 0.5 eV determined from ECD and alkali metal beam data. Two electron affinities of COS have been obtained from ECD data by fitting to the two state models. The ground state is assigned a value of 0.40 0.1 eV and the excited state one of 0.25 0.1 eV. Except for the A1 the parameters used to calculate the curves are similar to those for CS2. The Qan for the ground state is less than 1, and the A1 values are less than the Debroglie A1. The CURES-EC Ea are 0.5 eV and 0.3 eV. The angular dependence of the energies of the anions and neutrals is illustrated in Figure 9.25, along with those for CO2. The negative ions have a lower energy than the neutrals in the calculated range of angles. The minimum for the anion data is not as deep as for the other curves, which might be due to the two different types of bonds. The dissociation in the C O dimension has two limits below the dissociation limit of the neutral: one leading to CS þ O( ) and the other leading to CS( ) þ O. In the C S dimension only one limit leading to CO þ S( ) is below the dissociation limit. Since the C S bond should be weaker than the C O bond, this should be the least endothermic dissociation. In this dimension two bonding curves, one for the bent form and the other
TRIATOMIC MOLECULES AND ANIONS |
223 |
Figure 9.25 CURES-EC AM1 calculations of the energy for the neutral and negative ions of CO2 and COS as a function of the bending angle.
for the linear form of the anion, can be constructed. In addition, a dissociative curve may be drawn. In the other two dimensions five curves could be drawn, as in the case of CS2( ). This gives nine M states and three D states.
In the case of CO2 the linear anion is less stable than the bent anion. The valence-state Ea of CO2 has been reported as 0.6 eV to 0.8 eV and 1.1 eV to 2.2 eV. The CURES-EC calculations give Ea of 0.5 eV and 0.9 eV for the bent and linear forms. The variation of the energies with the bending angle can be calculated using CURES-EC. These curves are shown in Figure 9.25 along with curves for COS. The reference point for the energy scale is the linear neutral at 180 . The negative-ion curve crosses the neutral curve at an angle of about 150 . At smaller angles the anion will be stable to autodetachment, but still higher than the ground-state neutral. The CO2( ) anion has been observed in the electron impact spectra of anhydrides.
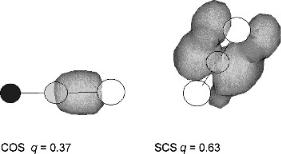
The relative electron affinities of these four compounds in the linear and bent forms were evaluated using READS-TCT and geometry restraints. The charge density on the bent CS2 anion is greater than on the linear CS2 anion in agreement with experiment. In a comparison of the bent COS anion with the linear CS2 anion the larger charge density resides on linear CS2( ). The bent COS anion is more stable than the linear or bent N2O anion. Thus, the order of the electron affinities is CS2 (b) > CS2 (l) > COS (b) > N2O (b) ¼ COS (l) > N2O (l) > CO2 (b) > CO2 (l). This is the same order as experiment and the CURES-EC calculated Ea. Figure 9.26 presents an example of the CS2 (l) > COS (l) spin density difference of 0.63 versus 0.37.
224 DIATOMIC AND TRIATOMIC MOLECULES AND SULFUR FLUORIDES
Figure 9.26 Three-dimensional spin densities for electron added to CS2 (l) and COS (l). The spin density difference is 0.63 versus 0.37, indicating that the Ea of linear CS2 is greater than the Ea of linear COS.
The charge density is automatically calculated when one of the molecules is selected in HYPERCHEM.
9.4 ELECTRON AFFINITIES AND MORSE POTENTIAL ENERGY CURVES: SULFUR FLUORIDES AND ANIONS
The reactions of electrons with the SFn compounds provide a nice transition between the smaller molecules and larger ones [103–126]. In this section the Ea for the SFn will be assigned. The only electron impact data available are for SF6. Using the curves for SF6 as a prototype, we can utilize the electron affinities measured for the other SFn to construct qualitative Morse potentials. Curves are drawn dissociating to each of the two lowest limits. In Figures 9.27 and 9.28 Morse potentials for SF, SF4, SF5, and SF6 and their anions are given. The bonding and antibonding curves are easily distinguished in both illustrations.
The electron affinities of all the SFn from n ¼ 0 to 7 have been measured or calculated theoretically. The NIST tables contain the Ea for many of these compounds, but do not assign or evaluate them. A. E. S. Miller and coworkers evaluated the available ground-state values but did not consider excited states [106]. The assignment of Ea for SF6 to excited states was used in Chapter 5 as an example. The ground-state value is 1.07 0.07 eV, and excited-state values are 0.75, 0.5, 0.3, and 0.0 eV.
The Ea of S, F, SF3, SF5, and SF6 were determined using the magnetron method. The differences between the values obtained by the magnetron method and the current ‘‘best’’ values are 0.2, þ0.2, 0.2, 0.14, and þ0.3 eV, respectively, indicating no systematic uncertainties and a random uncertainty on the order of 0.2 eV. Except for SF6 these Ea were determined by dissociative reactions. Two measures of the Ea of SF5 were obtained: one by the initial dissociation of S2F10 and the other by the determination of the energy of dissociation of SF6( ) to F þ SF5( ). This energy of 0.0 0.1 eV combined with the current S F bond dissociation energy

ELECTRON AFFINITIES AND MORSE POTENTIAL ENERGY CURVES |
225 |
Figure 9.27 Morse potential energy curves for the neutral and negative-ion states of SF5 and SF6.
Figure 9.28 Morse potential energy curves for the neutral and negative-ion states of SF and SF4.
226 DIATOMIC AND TRIATOMIC MOLECULES AND SULFUR FLUORIDES
yields Ea(SF5) ¼ DðS FÞ ¼ 4.0 0.2 eV. More recently, this energy has been determined to be 0.15 eV by NIMS and electron attachment reactions. Dissociative electron attachment to SF4 determined the magnetron Ea of SF3 to be 2.71(15) eV. By using the current best S F dissociation energy, the Ea is 2.91(15) eV, the same as the more recent experimental and theoretical values. With these modifications the differences between the magnetron values and most recent values are reduced and the random uncertainties are 0.15 eV [109, 117].
The electron affinity of SF, the difference in the bond energies of the neutral and anion, and the internuclear distance and vibrational frequency of the ground-state anion were determined using PES and confirmed by theoretical calculations [104]. One larger value of the Ea is listed in the NIST table. Since it is a lower limit of 4.0 eV and is larger than the Ea of F, the value is not used here. Such a large value would require a relative bond order of 1.2 for the addition of an electron to an antibonding orbital. Two excited states with positive Ea have been predicted but not observed.
The Ea of SF2 is the least certain of any of the values, bracketed between 0.2 eV and 1.6 eV. The NIST values are 0.9(6) eV or 3.1 eV. The latter value was determined using the same technique that resulted in an Ea of greater than 4.0 eV for SF. Therefore, this value is not used in the current analysis. Theoretical values are about 2.0 eV and two nondetaching anion states are predicted. The CURES-EC value is 1.45 eV. The weighted average of the NIST value for the Ea of SF3 is 2.9(1) eV. Four Ea of SF4 have been reported: 2.35(10), 1.5(2), 1.26(10), and 0.8(2) eV. The reported Ea of SF5 are 3.80(3) eV and 3.0(1) eV.
Thermal electron attachment to SF6 has been studied in the ECD and NIMS at atmospheric pressure and in a chemical ionization mass spectrometer at lower pressures. From these data rate constants for thermal electron attachment and detachment to SF6, and the Qan values and electron affinities of SF6 and SF5 have been determined. The Morse potential energy curves for multiple negative-ion states were calculated using electron impact data and electron affinities.
The Morse potential energy curve for the ground state of SF6( ) has been calculated by ab initio methods. The recommended electron affinity is 1.39 eV, but values ranging from 0.49 eV to 1.39 eV were reported. The theoretical curve differs from the semi-empirical one in that the internuclear distances and frequencies are smaller for the ground-state anion [126]. By using the theoretical ground-state curve, an additional excited-state curve is required to account for the electron impact data and reactions with thermal electrons. This is not a problem since multiple negative-ion states have been observed for SF6. The curves shown in Figure 9.27 have been drawn with the Ea, the vertical Ea, and the ion distributions. There can also be many other curves since SF5( ) has a large number of excited states. The ground-state curve is Mð2Þ with positive Ea and VEa and negative EDEA. The upper bonding curve is Mð1Þ since the curve crosses the neutral at the zero point vibrational level, making VEa negative. The excited-state antibonding curves are Dð1Þ since Ea is positive, but the other metrics are negative and the vertical transition leads to dissociation.
The Morse curves for SF5( ) shown in Figure 9.27 are drawn with positive Ea. The ground-state curve is Mð3Þ and has a large activation energy. The first excited