

Chen The electron capture detector
.pdfTHE CALCULATION OF THE ECD AND NIMS TEMPERATURE DEPENDENCE |
317 |
Figure 12.11 The calculated ECD temperature dependence for AGCUT if we assume nondissociative capture.
Figure 12.12 The calculated ECD temperature dependence for AGCUT if we assume dissociative capture.

318 BIOLOGICALLY SIGNIFICANT MOLECULES
12.8ELECTRON AFFINITIES OF AT AU AND GC
In 1998 a unique model for electron transport in DNA was proposed based on the role of anionic donor acceptor complexes [49, 50]. DNA has a covalent backbone and an inner anhydrous p stacked core. This core consists of hydrogen-bonded base pairs. Conduction can occur along the backbone or through space via the inner core. The p system can be modeled as a series of donor acceptor complexes. In the neutral state there will be little charge transfer. Once an electron is added to a base pair, rapid, length-independent electron transfer will take place through the p way. This will occur since the electron affinities of the base pairs are within the range of thermal activation. The changes in geometry and hydrogen bonding will make up for the fundamental differences in the Ea.
In order to establish a donor acceptor mechanism for electron transport in DNA, values for the electron affinities and ionization potentials of the hydrogen-bonded base pairs are required. As early as 1962 the importance of such interactions was considered:
From molecular orbital calculations on the adenosine-thymidine and guanosinecytidine base pairs of DNA. . . . the second pair is both a better electron acceptor and electron donor than the first. . . . There is considerable overlap between the electron systems resulting in the conjugated electrons extending over both bases in the pair. This point needs to be investigated further as it is of considerable significance. [51]
In 1998 the Ea of AT, AU, and GC were calculated using the CURES-EC method. These were the first to give positive values for the electron affinities. Subsequently, all the calculations emphasize the positive nature of the Ea. The CURESEC Ea are given in Table 12.9 and compared with the experimental values for the individual bases and values calculated using the density functional theory available in 2002 [52–54]. Although the density functional values are lower than the CURESEC values, the difference between the Ea of GC and AT is about the same, 0.20 eV. This activation energy is very small for an electron transfer reaction. This difference supports the possibility of thermal activation of electron conduction.
TABLE 12.9 Electron Affinities (in eV) of Purines and Pyrimidines and Watson Crick Hydrogen-Bonded Base Pairs
Molecule |
Exp |
CEC |
B3P86 |
BP86 |
B3LYP |
|
|
|
|
|
|
Adenine |
0.95(5) |
0.96 |
0.01 |
0.05 |
0.28 |
Guanine |
1.51(5) |
1.50 |
0.36 |
0.11 |
0.10 |
Cytosine |
0.56(5) |
0.58 |
0.54 |
0.13 |
0.03 |
Uracil |
0.80(5) |
0.80 |
0.75 |
0.31 |
0.24 |
Thymine |
0.79(5) |
0.76 |
0.71 |
0.28 |
0.20 |
G-C |
— |
1.35 |
1.15 |
0.71 |
0.60 |
A-T |
— |
1.15 |
0.88 |
0.58 |
0.30 |
A-U |
— |
1.05 |
— |
— |
0.32 |
|
|
|
|
|
|
The density functional values are from [40–42].
ELECTRON AFFINITIES OF AT AU AND GC |
319 |
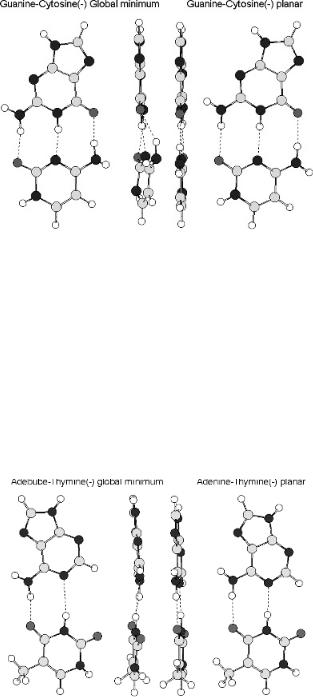
Figure 12.13 Planar and global minimum anions of GC calculated using AM1. Note the twisted NH2 group and the differences in the lengths of the hydrogen bonds in the global minimum.
The geometry of the anions of GC and AT is significantly different from that of the neutral. The anions and neutrals are shown in the side and top view for AT and GC in Figures 12.13 and 12.14. The change for GC is larger than for AT. Both are distorted from planarity and the lengths of hydrogen bonds change. The changes for AT are smaller than those for GC. The energetics and geometry changes show that the hydrogen-bonded base pairs can act as both donors and acceptors of electrons. Pairwise electron transfer down the p stack via an anion complex is possible. When
Figure 12.14 Planar and global minimum anions of AT calculated using AM1. The distortions in the base pair are still present, but are smaller for AT than for GC.
320 BIOLOGICALLY SIGNIFICANT MOLECULES
the electron is added to one base pair, the anion becomes the donor and the adjacent base pair the acceptor. The charge transfer energy is related to the quantity IP Ea. For anion complexes the IP of the donor is the Ea of the first base pair, while the Ea of the acceptor is that of the adjacent base pair. The anion stabilization energy is related to the differences in the Ea. This is only about 0.2 eV, as shown in Table 12.9. It is much smaller than the energy required for many biological processes such as hydrogen bonding. The net effect is rapid charge transfer through the p stack after an electron is added to the system. This model merely shows that conduction is thermodynamically and geometrically feasible, but it requires that the bases be aligned so the proper overlap is achieved. These interactions are noncovalent and occur through space. The model requires that hydrogen-bonded base pairs be present. In the cases where rapid electron transfer does not take place, the breakage of the hydrogen bonds or an irreversible geometry change could slow down the electrons and lead to DNA damage.
The electron affinities and charge distributions in stacked hydrogen-bonded base pairs in the B form of DNA were calculated and used to test the model. Not surprisingly, for a stack of the same base pairs, GC/GC or AT/AT, READS-TCT ¼ q(GC1)/q(GC2) ¼ q(AT1)/q(AT2) ¼ 1. A greater proportion of the charge resides on the GC in the stacked GC/AT, or AT/GC: READS (GC/AT) ¼ 1.5; and READS (AT/GC) ¼ 0.65. However, it was surprising that the charge resides primarily on the pyrimidine and not the purine, if we consider the larger adiabatic electron affinity of the purines. In the isolated Watson Crick hydrogen-bonded base pairs the READS(G/C) ¼ 0.05 and READS(A/U) ¼ READS(A/T) ¼ 0.2 at the global minimum. Density functional calculations give similar results [52–54]. Based on this observation, it was postulated that the geometry of G and A in the hydrogen-bonded base pair exists for an excited anion state. The inverted charge distribution for the Watson Crick hydrogen-bonded base pairs is responsible for the pyrimidine anions observed in radiation-damaged DNA [55].
12.9RADIATION DAMAGE IN DNA
When DNA is irradiated, the resulting anions are primarily C( ) and T( ) [49]. However, the adiabatic electron affinities A Ea are Pu > Pyr. The abundance of the Pyr( ) could imply inaccurate values of the AEa or lower-energy excited states of A( ) and G( ) in DNA. The CURES-EC A Ea of G, at 1.5 eV, agrees with the experimental value, but an Ea of 0:3 0:05 eV is obtained for the local minimum dipolar planar anion. The dipole moment of G is similar to that of C and thus the DBEA should be about the same, 0.25 eV. The Ea and the predicted DBEA are approximately the same.
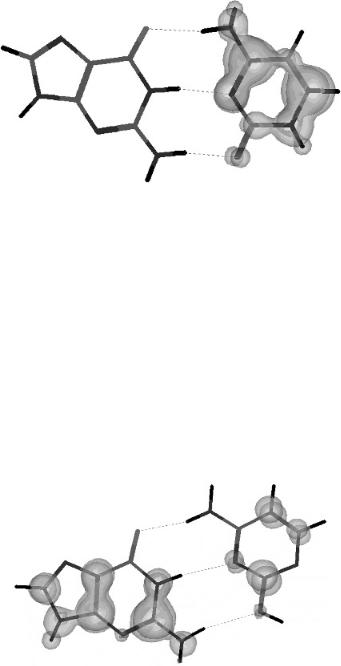
In Figure 12.15 the planar local minimum form of G( ) is shown with a threedimensional spin density plot. The spin density is localized on the hydrogen bonding sites and is similar to a dipole bound anion. Figure 12.16 presents a similar plot for the global minimum form of G( ). The NH2 group is twisted out of the plane,

RADIATION DAMAGE IN DNA |
321 |
Figure 12.15 Three-dimensional spin densities for the planar guanine anion calculated using AM1. The spin density is localized on the hydrogen bonding sites and is similar to a dipole bound state.
the N H bond is bent, and the spin distribution is distributed over the complete molecule as expected for a valence-state anion. The twisting of the NH2 group requires the addition of energy. The local minimum planar form is formed initially, and when the bond twists, the global minimum is formed.
Figure 12.16 Three-dimensional spin densities for the global minimum guanine anion calculated using AM1. The spin density is distributed over the complete molecule, as expected for a valence state.

322 BIOLOGICALLY SIGNIFICANT MOLECULES
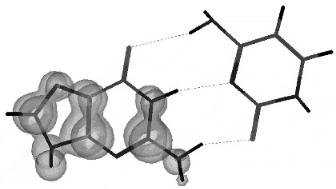
Figure 12.17 Three-dimensional spin densities for the planar adenine anion calculated using AM1. The spin density is localized away from the major structure and is similar to a dipole bound state.
The CURES-EC AEa of A, at 0.95 eV, agrees with experimental value, but an Ea of 0.0 eV is obtained for the local minimum planar anion. This is close to the DBEA measured for A. The lower DBEA is expected because of the lower dipole moment for A, 2.18 Debye. In Figures 12.17 and 12.18 the planar local minimum
Figure 12.18 Three-dimensional spin densities for the global minimum adenine anion calculated using AM1. The spin density is distributed over the complete molecule, as expected for a valence state.
RADIATION DAMAGE IN DNA |
323 |
Figure 12.19 Three-dimensional spin densities for the GC anion keto cytosine calculated using AM1. READS(G/C) ¼ 0.05. In this structure the guanine is in an excited state with an Ea of 0.3 eV, as compared to the global minimum with an Ea of 1.51 eV.
and global minimum forms of A( ) are shown with a three-dimensional spin density plot. The ground-state anion of A, like that of G and C, is nonplanar with a twisted NH2 group, as seen in Figure 12.18. Unlike G( ) the spin density is localized away from the hydrogen bonding sites for A( ) in the planar state, as shown in Figure 12.17. This spin density is also similar to a dipole bound anion. In the global minimum for A( ) the spin distribution involves the complete molecule.
In Figure 12.19 the three-dimensional spin densities of the anion with a GC keto form are shown. This is compared to a similar plot in Figure 12.20 for the anion of the GC enol base pair. In the GC keto( ) form of cytosine READS(G/C) ¼ 0.05, or 95% of the spin occurs in the cytosine. For the GC enol( ) READS(G/C) ¼ 3.0, or
Figure 12.20 Three-dimensional spin densities for the GC anion enol cytosine anion calculated using AM1. READS(G/C) ¼ 3.0. The Ea of the cytosine in the enol form is lower and therefore the spin density is distributed to the planar guanine.
324 BIOLOGICALLY SIGNIFICANT MOLECULES
Figure 12.21 Three-dimensional spin densities for the GC( 3) anion keto cytosine anion calculated using AM1. As more electrons are added to the hydrogen-bonded base pair, the spin distribution is distributed to the guanine.
67% of the spin resides on G. The spin density on the cytosine in the GC keto( ) form is similar to the spin density of the isolated anion of cytosine in that it is distributed over the complete molecule. The spin density in the GC enol( ) form is different in that the spin density is localized on a few atoms.
The spin density of the isolated GC( 3) is shown in Figure 12.21. The charge is distributed to the G across the hydrogen bonds and the net spin density is localized on the G( ) rather than distributed to both the G( ) and C( ). The NH2 bond is twisted to a greater degree than in the singly charged species. The three structures shown in Figures 12.19 through 12.21 were obtained by starting with the global minimum of the normal keto hydrogen-bonded GC( ), (see Figure 12.19) changing the keto structure to the enol structure and geometry optimizing to generate Figure 12.20. The GC(-3) was generated by starting with the GC( ), changing the charge to 3, and then geometry optimizing to obtain Figure 12.21.
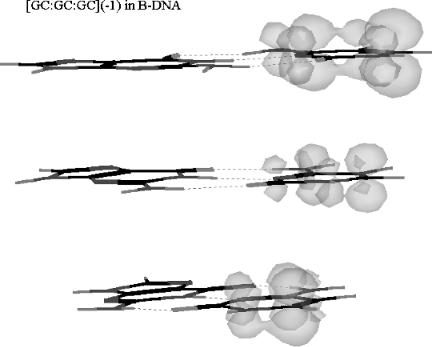
This suggested that similar calculations should be made for stacked [GC:GC:GC]( 1) in the B DNA form. These structures are generated by first using the HYPERCHEM database to build a DNA segment of three GCs in the B form. Then the sugars and phosphates are removed and the bases terminated with hydrogens at the standard N H distance. Then the stack is geometryoptimized in the neutral form. The last step is to geometry-optimize the stack with a single negative charge. Starting with this optimized form, additional electrons are added and the geometry optimized.
The calculations of the charge and spin densities are a part of the HYPERCHEM program. The following data are obtained: READS ðGi=CiÞ ¼ 0:05; READS(GC1/ GC2) ¼ 1.05, and READS(GC2/GC3) ¼ 1.25. Since the base pairs are the same, these latter ratios should be 1. In Figure 12.22 the three-dimensional spin densities of GC1:GC2:GC3( 1) are shown. In GC1:GC2:GC3( 3) the charge moves down the stack to the first and third base pairs. The larger charge density and spin density
RADIATION DAMAGE IN DNA |
325 |
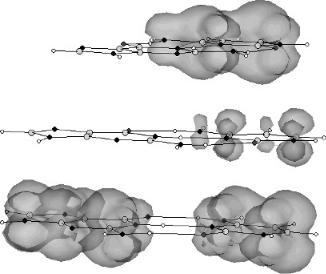
Figure 12.22 Three-dimensional spin densities for the GC:GC:GC( 1) anion stacked in the B DNA form calculated using AM1. The spin distribution in the individual base pairs is inverted, but the spin density down the stack is distributed equally.
on the first and third GC are indicated in Figure 12.23. In addition, the spin distribution is moved from the C( ) in GC( 1) to both the G and C in GC( 3). The spin density on the middle GC is much lower than that on the first and third GC. A similar behavior is obtained with AT:AT:AT. Only two electrons are required to begin moving spin to the A side, and with three electrons the spin density resides more on the A side than on the T side.
Although these data were generated to explain the nonadiabatic spin distribution in radiation-damaged DNA, the effect of adding multiple electrons to a stacked sequence can be extended to electron transport. One electron is delocalized down the stack, but when multiple electrons are added, the charge moves to the purines. Figures 12.22 and 12.23 clearly show the movement of the electrons down the stack without a bridge or bond. This demonstrates that there is no thermodynamic barrier when the base pairs are the same. In addition, even with a small barrier the movement can occur by geometrical changes and thermal activation. The projection of these movements to longer pieces of DNA supports the proposed mechanism of electron transport through the p electron system in DNA without a bridge or bonded backbone.
326 BIOLOGICALLY SIGNIFICANT MOLECULES
Figure 12.23 Three-dimensional spin densities for the GC:GC:GC( 3) anion stacked in the B DNA form calculated using AM1. When additional electrons are added to the stack, the spin density moves down the stack and across the hydrogen bonds.
12.10SUMMARY
The electron affinities of biologically significant molecules—NO, O2, the purines and pyrimidines, and heterocyclic aromatic molecules—have been systematically evaluated. The highest precise value is assigned to the adiabatic electron affinity. Significantly lower values are assigned to excited states. The Ea of AGCUT were obtained by scaling half-wave reduction potentials. Interpreting the PES of isolated anions and anion hydrates gives the Ea of C, U, and T. The Ea of heterocyclic aromatic molecules and the uracil radical have been determined by TCT. The NIMS method has been applied to the estimation of the gas phase acidities of AGCUT. Vertical electron affinities of AGCUT have been determined by electron transmission spectra and for C and T from electron impact spectra. Morse potential energy curves in two dimensions have been constructed to explain differences in the electron impact spectra of C and T. All these have been confirmed by CURES-EC calculations. The temperature dependence of ECD and NIMS spectra has been predicted. A proposed electron conduction model based on pairwise electron bound complexes was reviewed and supported by the CURES-EC calculated electron affinities of Watson Crick GC, AT, and AU. The CURES-EC values were compared with the density functional values.
One of the most important conclusions of this chapter is that there remains much to be done to characterize the thermal electron reactions of even the nucleic acids