

vk.com/id446425943
Thermal coal
Increased energy demand in emerging markets continues to drive growth in thermal coal demand. Ironically, China’s environmental clean-up effort is increasing demand for electricity (electric vehicles etc.). Given that thermal coal is perceived to be a “dirty” commodity from an environmental perspective, very few Western mining companies are building new thermal coal mines. We believe that some banks may also not be willing to lend to companies that wish to build new coal mines. We believe a shortage of capital invested in new thermal coal supply against a stable demand backdrop over the medium term could support favourable prices.
We believe the Chinese authorities may regulate thermal coal prices in a range of around $70-100/t, to maintain profitability for coal miners and electricity generators.
Renaissance Capital
14 January 2019
Metals & Mining
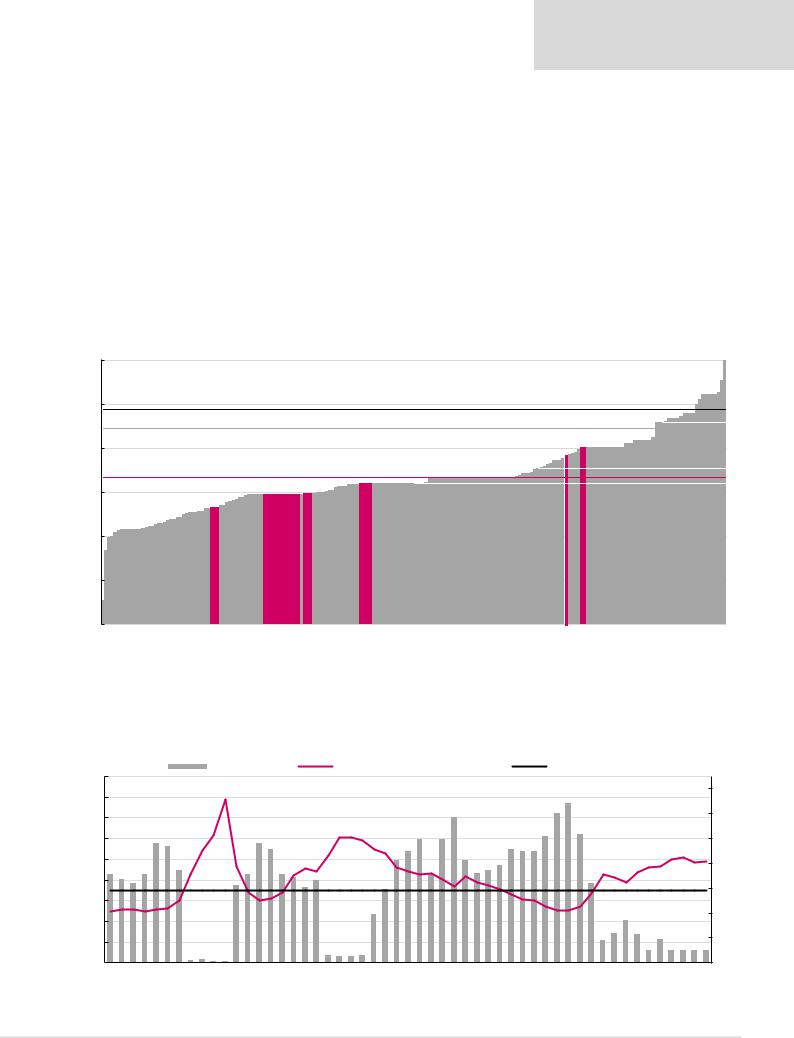
Thermal coal cost curve (1,640mnt)
Figure 70: 2018E thermal coal cash costs plus sustaining capex, $/t
120
|
100 |
Spot price: $98/t* |
|
|
|
|
|
Incentive price: $89/t |
|
|
|
|
80 |
|
|
|
|
|
|
Average cash cost: $67/t |
|
|
|
$/t |
60 |
|
|
|
64 |
|
|
Glencore,59 |
American,Anglo 59 |
||
|
40 |
BHP,53 |
RainbowAfricanMinerals, |
||
|
|
|
|
|
|
|
20 |
|
|
|
|
|
0 |
|
|
|
|
Note: Coal consists of seaborne supply, including coastal trade in China (i.e. coal that is shipped from northern Chinese ports to southern ports). *Priced as at 8 January 2019
90th percentile: $92/t
South32,76 Exxaro,80 |
70th percentile: $71/t |
|
50th percentile: $64/t |
||
|
Source: Bloomberg, CRU, Renaissance Capital estimates
Around 7% of the thermal coal industry is cash-burning at spot prices. This is very low compared with historical levels and could point to downside to coal prices.
Figure 71: Percentage of thermal coal cost curve that is cash-burning over time
|
|
|
|
|
|
|
|
|
|
% Cash burning |
|
|
|
|
Thermal coal (FOB Richard's Bay), $/t |
|
|
|
Average LT cash burn |
|
|
|
|
|
||||||||||||||||||||
|
180 |
|
|
|
|
|
|
|
|
157 |
|
|
|
|
|
|
|
|
|
|
|
|
|
|
|
|
|
|
|
|
|
|
60.0% |
64.0% |
|
|
|
|
|
|
|
|
|
|
|
|
|
|
|
|
|
|
|
|
|
|
|
|
|
|
|
|
|
|
|
|
|
|
|
58.5% |
|
|
|
|
|
|
|
|
|
|
|
|
|
|
|
70% |
|||
|
160 |
|
|
|
|
|
|
|
|
|
|
|
|
|
|
|
|
|
|
|
|
|
|
|
|
|
|
|
|
|
|
|
|
|
|
|
|
|
|
|
||||
|
|
|
|
|
|
|
|
|
|
|
|
|
|
|
|
|
|
|
|
|
|
|
|
|
|
|
|
|
|
51.0% |
51.5% |
|
|
|
|
|
|
|
|
|
||||
|
140 |
|
|
|
|
48.0% |
47.0% |
|
|
|
|
48.0% |
45.5% |
|
|
|
|
121 |
|
|
|
45.0% |
49.5% |
|
49.5% |
|
|
|
|
45.5% 45.0% 45.0% |
|
|
|
|
|
|
|
|
60% |
|||||
|
|
|
|
|
|
|
|
|
|
|
|
|
|
|
|
|
|
|
|
|
|
|
|
|
|
|
|
|
|
|||||||||||||||
|
|
|
|
|
|
|
|
|
|
|
|
|
|
|
|
41.0% |
|
41.0% |
|
|
|
|
|
|
|
|
|
|
|
|
||||||||||||||
|
120 |
35.5% |
|
|
35.5% |
37.0% |
|
|
35.5% |
35.5% |
34.5% |
|
|
|
|
|
35.5% |
36.0% |
37.0% |
39.0% |
|
|
|
|
|
|
102 |
98 |
50% |
|||||||||||||||
|
|
33.5% |
|
|
|
|
33.0% |
|
|
|
|
|
|
|
|
|
|
|||||||||||||||||||||||||||
|
|
32.0% |
|
31.0% |
30.5% |
|
|
|
32.0% |
|
|
|
|
|
|
|
||||||||||||||||||||||||||||
$/t |
100 |
|
|
|
29.5% |
|
|
|
|
|
|
|
40% |
|||||||||||||||||||||||||||||||
|
|
|
|
|
|
|
|
|
|
|
||||||||||||||||||||||||||||||||||
80 |
|
|
|
|
|
|
|
|
|
|
|
|||||||||||||||||||||||||||||||||
|
|
|
|
|
|
|
|
|
|
|
|
|
|
|
|
|
|
|
19.5% |
|
|
|
|
|
|
|
|
|
|
|
|
|
|
Average LT cash burn, 29.0% |
|
30% |
||||||||
|
|
|
|
|
|
|
|
|
|
|
|
|
|
|
|
|
|
|
|
|
|
|
|
|
|
|
|
|
|
|
|
|
|
|
|
|
17.0% |
|
|
|
|
|
||
|
60 |
|
|
|
|
|
|
|
|
|
|
|
|
|
|
|
|
|
|
|
|
|
|
|
|
|
|
|
|
|
|
|
|
|
|
12.0% |
11.5% |
|
|
|
|
|
||
|
40 |
|
|
|
|
|
|
|
|
|
|
|
|
|
|
|
|
|
|
|
|
|
|
|
|
|
|
|
|
|
|
|
|
|
9.0% |
|
9.5% |
|
|
20% |
||||
|
|
|
|
|
|
53 |
|
|
|
|
|
|
|
|
|
|
3.0% 2.5% 2.5% 3.0% |
|
|
|
|
|
|
|
|
|
|
|
|
51 |
|
|
5.0% |
5.0% 5.0% 5.0% 5.0% |
|
|||||||||
|
|
|
|
|
|
|
|
1.0% 1.5% |
0.5% 0.5% |
|
|
|
|
|
|
|
|
|
|
|
|
|
|
|
|
|
|
|
|
|
|
|||||||||||||
|
20 |
|
|
|
|
|
|
|
|
|
|
|
|
|
|
|
|
|
|
|
|
|
|
|
|
|
|
|
|
|
10% |
|||||||||||||
|
|
|
|
|
|
|
|
|
|
|
|
|
|
|
|
|
|
|
|
|
|
|
|
|
|
|
|
|
|
|
||||||||||||||
|
|
|
|
|
|
|
|
|
|
|
|
|
|
|
|
|
|
|
|
|
|
|
|
|
|
|
|
|
|
|
|
|||||||||||||
|
0 |
Mar 06 |
|
Sep 06 |
|
Mar 07 |
|
Sep 07 |
Mar 08 |
Sep 08 |
Mar 09 |
|
Sep 09 |
|
Mar 10 |
|
Sep 10 |
Mar 11 |
Sep 11 |
Mar 12 |
|
Sep 12 |
|
Mar 13 |
|
Sep 13 |
|
Mar 14 |
|
Sep 14 |
Mar 15 |
Sep 15 |
|
Mar 16 |
|
Sep 16 |
Mar 17 |
|
Sep 17 |
|
Mar 18 |
Sep 18 |
Spot |
0% |
|
|
|
|
|
|
|
|
|
|
|
|
|
|
|
|
|
|
|||||||||||||||||||||||||||
Source: Bloomberg, CRU, Renaissance Capital estimates
41
vk.com/id446425943
Renaissance Capital
14 January 2019
Metals & Mining
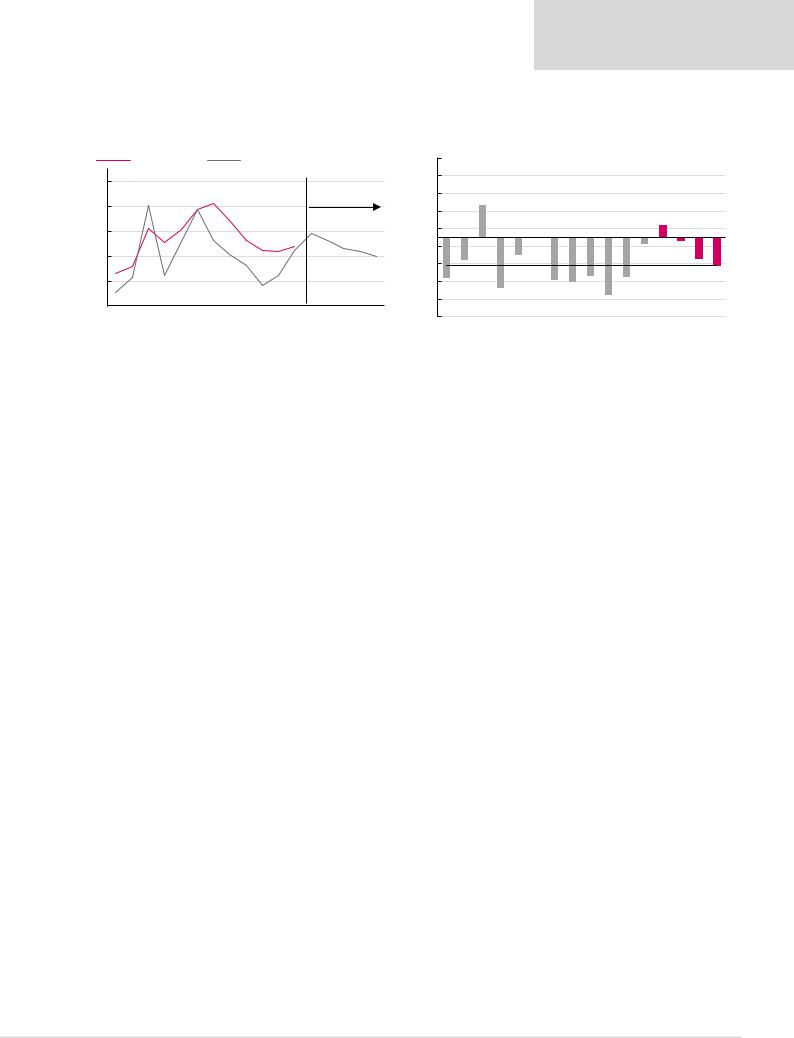
Our long-term thermal coal price of $80/t is around 13% below the 90th percentile of the cost curve.
Figure 72: Thermal coal price vs cash costs* at the 90th percentile |
Figure 73: Thermal coal price premium (discount) to the 90th percentile |
||
Cash costs, $/t |
Thermal coal average price. $/t |
45% |
|
|
|||
|
140 |
|
|
|
|
|
122 |
|
|
|
|
|
|
|
|
|
|
35% |
|
18% |
|
|
|
|
|
|
|
|
|
$/t |
|
102 |
91 |
102 |
117 |
109 |
93 |
85 |
83 |
88 |
|
|
86 |
84 |
|
|
|
|
|
0% |
|
|
7% |
|
|
|
|||
|
|
|
|
|
25% |
|
|
|
|
|
|
|
|
||||||||||||||||
|
|
|
|
|
|
|
|
|
|
|
|
|
Forecasts |
|
|
|
|
|
|
|
|
|
|
|
|
||||
|
120 |
|
|
|
|
|
|
|
|
|
|
|
|
|
|
|
|
|
|
|
|
|
|
|
|
||||
|
|
|
|
|
|
|
|
|
|
|
|
|
|
|
|
|
15% |
|
|
|
|
|
|
|
|
|
|
|
|
|
|
|
|
|
|
|
|
|
|
|
|
|
98 |
|
|
|
|
|
|
|
|
|
|
|
|
|
|
|
|
|
100 |
|
|
|
|
|
|
|
|
|
|
|
93 |
|
|
|
5% |
|
|
|
|
|
|
|
|
|
|
|
|
|
|
|
|
|
|
|
|
|
|
|
|
|
|
|
|
80 |
|
|
|
|
|
|
|
|
|
|
|
||
|
|
2007 72 |
|
|
|
|
|
|
|
|
|
|
|
|
|
|
-5% |
|
|
|
|
|
|
|
|
|
|
|
|
|
80 |
|
|
|
|
|
|
|
|
|
|
|
|
|
|
|
|
|
|
Historical average, -16% |
2017 -4% |
|
2019E -2% |
|
|
||||
|
|
|
|
|
|
|
|
|
|
85 |
|
|
|
|
|
|
|
|
|
|
|
||||||||
|
|
|
|
|
|
|
|
|
|
|
|
|
|
-15% |
|
|
|
|
|
|
|
|
|
||||||
|
|
|
|
|
|
|
|
|
|
|
|
|
|
|
|
|
|
|
|
|
|
|
|
||||||
|
|
|
|
|
|
|
|
|
|
|
|
|
|
|
|
|
|
|
|
|
|
|
|
|
|
||||
|
60 |
|
|
|
|
|
|
|
|
|
|
|
|
|
|
|
-25% |
|
|
|
|
|
|
|
|
|
|||
|
40 |
|
|
|
|
|
|
|
|
|
|
|
|
|
|
|
-35% |
|
|
|
|
|
|
|
|
|
|||
|
|
|
|
|
|
|
|
|
|
|
|
|
|
|
|
|
|
|
|
|
|
|
|
|
|
||||
|
200666 |
|
|
|
|
|
|
|
|
|
|
|
|
|
|
|
-45% |
200713%- |
|
200929%- |
201010%- |
|
201224%- 201326%- 201422%- 201533%- 201623%- |
|
2020E12%- |
2021E16%- |
|||
|
2008 |
2009 |
2010 |
2011 |
2012 |
2013 |
2014 |
2015 |
2016 |
2017 |
2018E |
2019E |
2020E |
2021E |
LT(real) |
200623%- |
2008 |
2011 |
2018E |
||||||||||
*Cash costs net of by-product credits plus sustaining capex.
Source: Bloomberg, CRU, Renaissance Capital estimates |
Source: Bloomberg, CRU, Renaissance Capital estimates |
42
vk.com/id446425943
Platinum group metals (13mn oz)
We see downside risk to the spot PGM basket price, which is trading above cost support and could suffer from escalating fears of a global slowdown and falling vehicles sales.
However, we believe the price differential between platinum and palladium is unsustainable, and forecast this to close over the medium term as platinum is substituted for palladium in gasoline auto catalysts.
Longer-term, we continue to see a risk that low-cost supply and recycling growth could outstrip incremental demand growth and effectively displace some of the high-cost South African mine supply, potentially lowering cost support.
Renaissance Capital
14 January 2019
Metals & Mining
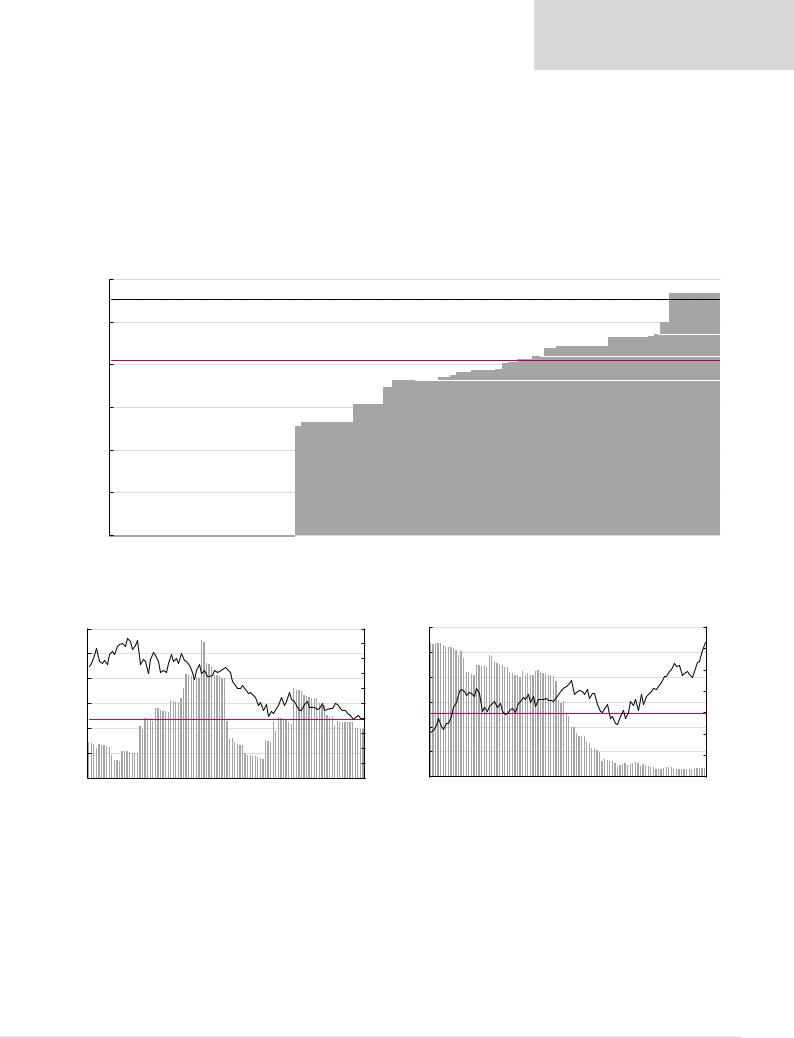
Figure 74: 2018E 3PGM cash costs plus sustaining capex, $/oz
1,200 |
|
|
|
|
|
|
|
|
|
|
|
3PGM price: $1,107/oz* |
|
|
|
|
|
|
|
|
|
1,000 |
|
|
|
|
|
|
|
90th percentile: $943/oz |
||
|
|
|
|
|
|
|
|
|||
|
Average cash cost: $822/oz |
|
|
|
|
|
RiversTwo(ARI), 813 Zondereinde(NHM), 827 BRPM(RBP), 842 Kroondal(SGL), 879 |
Lonmin, 888 |
Rustenburg(SGL), 928 |
Union (AMS), 935 |
800 |
|
509(THA),Tharisa |
528(AMS),Mogalakwena |
613(SGL),Stillwater (NHM),Booysendal692 (AMS),Amandelbult726 |
(AMS),Amandelbult726 (AMS),Kroondal739 (AMS),Unki749 (IMP),RiversTwo 767 |
(IMP),Zimplats776 |
||||
600 |
Norilsk |
|||||||||
|
|
|
|
|
|
|
|
|
|
|
400 |
|
|
|
|
|
|
|
|
|
|
200 |
|
|
|
|
|
|
|
|
|
|
0 |
|
|
|
|
|
|
|
|
|
|
Marula (IMP), 997
Rustenburg lease (IMP), 1,134
*Priced as at 8 January 2019; 3PGM basket (57% Pt, 36% Pd, 7% Rh).
Source: Bloomberg, CRU, Renaissance Capital estimates
Figure 75: NYMEX platinum inventory days and price, $/oz (RHS) |
Figure 76: NYMEX palladium inventory days and price, $/oz (RHS) |
16 |
1,737 |
|
1,846 |
|
15 |
|
|
|
|
|
|
|
2,000 |
30 |
27 |
|
|
|
|
|
|
|
|
|
|
|
1,2621,400 |
|||
|
|
|
1,662 |
|
|
|
|
|
|
|
|
|
|
|
|
|
|
|
|
|
|
|
|
|
|
|
||||
|
|
|
|
|
|
|
|
|
|
|
|
|
1,800 |
|
|
|
24 |
24 |
|
|
|
|
|
|
|
|
1,064 |
|
1,200 |
|
14 |
|
|
|
|
|
|
|
|
|
|
|
|
|
25 |
|
|
|
|
|
|
|
|
|
|
|
|||||
|
|
|
|
|
|
|
|
|
|
|
|
|
1,600 |
|
|
|
|
|
|
20 |
|
|
|
|
|
|
|
|
||
|
|
|
|
|
|
|
|
|
|
|
|
|
|
|
|
|
20 |
|
|
|
|
906 |
|
|
|
|
|
|
||
|
|
|
|
|
|
1,241 |
|
|
|
|
|
|
1,400 |
|
|
|
|
|
|
|
|
|
827 |
|
1,000 |
|||||
12 |
|
|
|
|
|
|
11 |
|
|
|
|
20 |
|
|
|
|
|
|
|
|
|
|
|
|
||||||
|
|
|
|
|
|
|
|
|
|
|
|
|
|
|
|
|
|
|
|
|
|
|
|
|
||||||
|
|
|
|
10 |
|
|
|
|
10 |
|
|
|
|
|
|
|
|
|
|
|
|
|
|
|
|
|
|
|||
|
|
|
|
|
|
|
|
|
|
983 |
|
1,200 |
|
|
|
|
|
|
|
|
|
15 |
677 |
|
|
|
|
800 |
||
10 |
|
|
|
|
9 |
|
|
|
|
|
|
|
796 |
1,000 |
15 |
|
|
|
|
|
|
|
|
Average exchange stock days, 13 |
|
|
||||
|
Average exchange stock days, 9 |
|
9 |
|
|
|
|
|
|
|
|
|
|
|
|
|
600 |
|||||||||||||
|
|
|
|
|
|
8 |
|
|
|
|
|
|
|
|
|
|
|
|
||||||||||||
|
|
|
|
8 |
|
|
|
|
|
|
|
8 |
800 |
|
|
|
|
|
|
|
|
|
|
|
|
|
|
|
||
|
|
|
|
|
|
|
|
|
|
|
|
10 |
|
|
|
|
|
|
|
|
|
|
|
|
|
|
|
|||
8 |
|
7 |
|
|
|
|
7 |
|
|
|
|
|
|
600 |
|
|
|
|
|
|
|
|
7 |
|
|
|
|
|
400 |
|
|
|
|
|
|
|
|
|
|
|
|
|
|
|
|
|
|
|
|
|
|
|
|
|
|
|
|
||||
6 |
|
|
5 |
|
|
|
6 |
|
|
|
|
|
400 |
5 |
|
|
|
|
|
|
|
|
|
3 |
|
2 |
1 |
2 |
200 |
|
|
|
|
|
|
|
|
|
|
|
|
|
|
|
|
|
|
|
|
|
|
|
|
|
|||||||
|
|
|
|
|
|
|
|
|
|
|
|
|
200 |
|
|
|
|
|
|
|
|
|
|
|
|
|||||
|
|
|
|
|
|
|
|
|
|
|
|
|
|
|
|
|
|
|
|
|
|
|
|
|
|
|
|
|
|
|
4 |
Jan-10 |
Jun-10 |
Nov-10 |
Apr-11 Sep-11 Feb-12 |
Jul-12 Dec-12 May-13 |
Oct-13 Mar-14 Aug-14 |
Jan-15 Jun-15 |
Nov-15 Apr-16 |
Sep-16 |
Feb-17 |
Jul-17 |
Dec-17 May-18 |
Oct-18 |
0 |
0 |
Jan-10 |
Jun-10 |
Nov-10 Apr-11 Sep-11 |
Feb-12 |
Jul-12 |
Dec-12 |
May-13 |
Oct-13 |
Mar-14 Aug-14 Jan-15 |
Jun-15 Nov-15 Apr-16 |
Sep-16 |
Feb-17 |
Jul-17 Dec-17 May-18 |
Oct-18 |
0 |
|
|
|
|
|||||||||||||||||||||||||||
Note: Calculated as exchange inventory/global platinum demand*365. |
|
|
|
|
|
|
|
Note: Calculated as exchange inventory/global palladium demand*365. |
|
|
|
|
|
|||||||||||||||||
|
|
|
|
|
|
|
|
Source: Bloomberg, Renaissance Capital |
|
|
|
|
|
|
|
|
|
|
Source: Bloomberg, Renaissance Capital |
|||||||||||
43

vk.com/id446425943
Renaissance Capital
14 January 2019
Metals & Mining
Figure 77: Percentage of 3PGM cost curve that is cash-burning over time
|
|
|
|
|
|
|
% Cash burning |
|
|
|
3PGM basket price, $/oz |
|
|
Average LT cash burn |
|
|
|
|
|
|
|
|||||||||||||||||||
|
2,500 |
|
|
|
|
|
|
|
74.5% |
|
|
|
|
|
|
|
|
|
|
|
|
|
|
|
|
|
|
|
|
|
|
|
|
|
|
|
|
|
|
90% |
|
|
|
|
|
|
|
1,973 |
|
|
|
|
|
|
|
|
|
|
|
|
|
|
|
|
|
|
|
|
|
|
|
|
|
|
|
|
|
|
80% |
||
|
|
|
|
|
|
|
|
|
|
|
|
|
|
|
|
|
|
|
|
|
|
|
|
|
|
|
|
|
|
|
|
|
|
|
|
|
|
|
||
|
2,000 |
|
|
|
|
|
|
|
|
|
|
|
|
|
|
|
|
|
|
|
|
|
|
|
|
|
|
|
|
|
|
|
|
|
|
|
|
|
|
70% |
|
|
|
|
|
|
|
|
|
|
|
|
|
|
|
|
|
|
|
|
|
|
|
|
|
|
|
|
|
|
|
|
|
|
|
|
|
|
|
|
|
|
|
|
|
|
|
|
|
|
|
|
|
|
|
|
1,476 |
|
|
|
|
|
|
|
|
|
|
|
|
|
47.0% |
|
|
|
|
|
|
|
|
|
|
60% |
|
1,500 |
|
|
|
|
|
|
|
41.0% |
|
|
|
|
|
|
|
|
|
37.0% 37.0% |
|
|
|
|
|
|
|
|
|
|
|
|
|
|
|
|
|
|
1,107 50% |
||
$/oz |
|
|
|
|
|
|
|
|
|
|
|
|
|
|
|
|
|
31.0% |
|
|
|
|
33.5% |
|
|
28.5% |
|
|
|
|
|
|
|
|
|
|||||
1,000 |
|
|
|
|
|
|
|
|
26.0% |
|
|
|
|
|
|
|
22.0% |
|
|
24.0% |
|
|
22.5% |
23.0% |
|
|
|
|
|
|
|
|
|
40% |
||||||
|
|
|
|
|
|
|
|
|
|
|
|
|
|
|
|
|
21.5% 21.5% |
|
|
|
|
21.5% 21.5% |
|
|
|
|
|
|
||||||||||||
667 |
|
|
|
|
|
|
|
|
12.0% |
|
|
|
|
|
13.5% |
|
12.0% 12.5% 12.5% |
12.0% |
12.0% |
|
12.0% |
|
|
|
|
|
30% |
|||||||||||||
500 |
Average LT cash burn, 13.1% |
679 |
|
|
|
|
|
10.5% |
11.0% |
11.0% |
10.0% |
8.5% 8.5% |
10.0% |
8.5% 8.5% |
20% |
|||||||||||||||||||||||||
|
|
|
|
|
|
|||||||||||||||||||||||||||||||||||
2.5% 2.5% |
1.0% 1.0% 1.5% |
0.0% 0.0% 0.0% 0.0% 0.0% 0.0% 0.0% 0.0% 0.0% |
7.0% |
|
0.5% |
2.0% 2.0% 2.0% 2.0% 1.5% 1.5% 1.5% |
10% |
|||||||||||||||||||||||||||||||||
|
|
|||||||||||||||||||||||||||||||||||||||
|
0 |
|
|
|
|
|
|
|
|
|
|
|
|
|
|
|
|
|
|
|
|
|
|
|
|
|
|
|
|
|
|
|
|
|
|
|
|
|
Spot |
0% |
|
Mar 05 |
Sep 05 |
Mar 06 |
Sep 06 |
Mar 07 |
Sep 07 |
Mar 08 |
Sep 08 |
Mar 09 |
|
Sep 09 |
|
Mar 10 |
Sep 10 |
Mar 11 |
Sep 11 |
|
Mar 12 |
Sep 12 |
|
Mar 13 |
Sep 13 |
Mar 14 |
Sep 14 |
|
Mar 15 |
|
Sep 15 |
|
Mar 16 |
|
Sep 16 |
|
Mar 17 |
Sep 17 |
|
Mar 18 |
Sep 18 |
|
|
Source: Bloomberg, CRU, Renaissance Capital estimates
Our long-term 3PGM price forecast of $1,127/oz is around 20% above the 90th percentile of the 3PGM cost curve.
Figure 78: 3PGM price vs cash costs* at the 90th percentile |
Figure 79: 3PGM price premium (discount) to the 90th percentile |
|
|
90th percentile of 3PGM cost curve* |
|
|
|
3PGM basket price** |
100% |
|
87% |
81% |
|
|
|
|
|
|
|
|
|
|
|
|
|
|
|||||||||||||
|
|
|
|
|
|
|
|
|
|
|
|
|
|
|
|
|
|
|
|
|
|
||||||||||||||||
|
1,800 |
|
|
|
|
|
|
|
1,421 |
|
|
|
|
|
Forecasts |
|
80% |
|
|
|
|
|
|
|
|
|
|
|
|
|
|
|
|
|
|||
|
|
|
|
|
|
|
|
|
1,370 |
|
|
|
|
|
|
|
|
|
|
|
|
|
|
|
|
|
|
|
|
|
|
||||||
$/oz |
|
|
|
720 |
1,226 |
946 |
1,053 |
1,339 |
1,320 |
1,088 |
947 |
970 |
1,127 |
|
42% |
|
|
21% |
|
21% |
3% |
|
|
|
|
|
|
9% |
3% |
10% |
3% |
||||||
1,600 |
|
|
1,028 |
1,100 |
1,153 |
1,182 |
60% |
|
|
|
|
|
|
|
|
|
|||||||||||||||||||||
|
|
|
|
|
|
|
|
|
|
|
|
|
|
|
|
|
|
|
|
|
|
|
|
|
|
|
|
|
|
|
|
|
|
|
|
||
|
|
|
|
|
|
|
|
|
|
|
|
|
|
|
|
|
|
|
|
|
|
|
|
|
|
|
|
|
|
|
|
|
|
|
|
|
|
|
1,400 |
|
|
|
|
|
|
|
|
|
|
|
|
|
|
|
|
|
|
|
|
|
|
|
|
|
|
|
|
|
|
|
|
|
|
|
|
|
1,200 |
|
|
|
|
|
|
|
|
|
|
|
|
|
|
|
|
|
|
40% |
|
|
|
|
|
|
|
|
|
|
|
|
|
|
|
|
|
|
|
|
|
|
|
|
|
|
|
|
|
|
|
|
|
|
|
|
|
|
|
|
|
|
|
|
|
Historical average, 14% |
|
|
|
||||||
|
|
|
|
|
|
|
|
|
|
|
|
|
|
|
|
|
|
|
|
20% |
|
|
|
|
|
|
|
|
|
|
|
||||||
|
1,000 |
|
|
|
|
|
|
|
|
|
|
|
|
|
|
|
|
|
|
|
|
|
|
|
|
|
|
|
|
|
|
|
|
|
|
|
|
|
|
|
|
|
|
|
|
|
|
|
|
|
|
|
|
|
|
|
|
|
|
|
|
|
|
|
|
|
|
|
|
|
|
|
|
|
|
|
800 |
514 |
580 |
|
|
|
|
|
|
|
|
|
|
933 |
|
|
|
|
|
0% |
|
|
|
|
-6% |
|
|
15%- |
14%- |
12%- |
16%- |
12%- |
-4% |
|
|
|
|
|
400 |
|
|
|
|
|
|
|
|
|
|
|
|
|
|
|
|
|
|
|
|
|
|
|
|
|
|
||||||||||
|
600 |
|
|
|
|
|
|
|
|
|
|
|
|
|
|
|
|
|
|
-20% |
|
|
|
|
|
|
|
|
|
|
|
|
|
|
|
|
|
|
|
2005 |
2006 |
2007 |
2008 |
2009 |
2010 |
2011 |
2012 |
2013 |
2014 |
2015 |
2016 |
2017 |
2018E |
2019E |
2020E |
2021E |
LT (real) |
-40% |
2005 |
2006 |
2007 |
2008 |
2009 |
2010 |
2011 |
2012 |
2013 |
2014 |
2015 |
2016 |
2017 |
2018E |
2019E |
2020E |
2021E |
|
|
|
|||||||||||||||||||||||||||||||||||
*Cash costs net of by-product credits plus sustaining capex. |
Source: Bloomberg, Renaissance Capital estimates |
Source: Bloomberg, Renaissance Capital estimates
44