

vk.com/id446425943
Fears of an economic slowdown
Equity markets pricing in a slowdown?
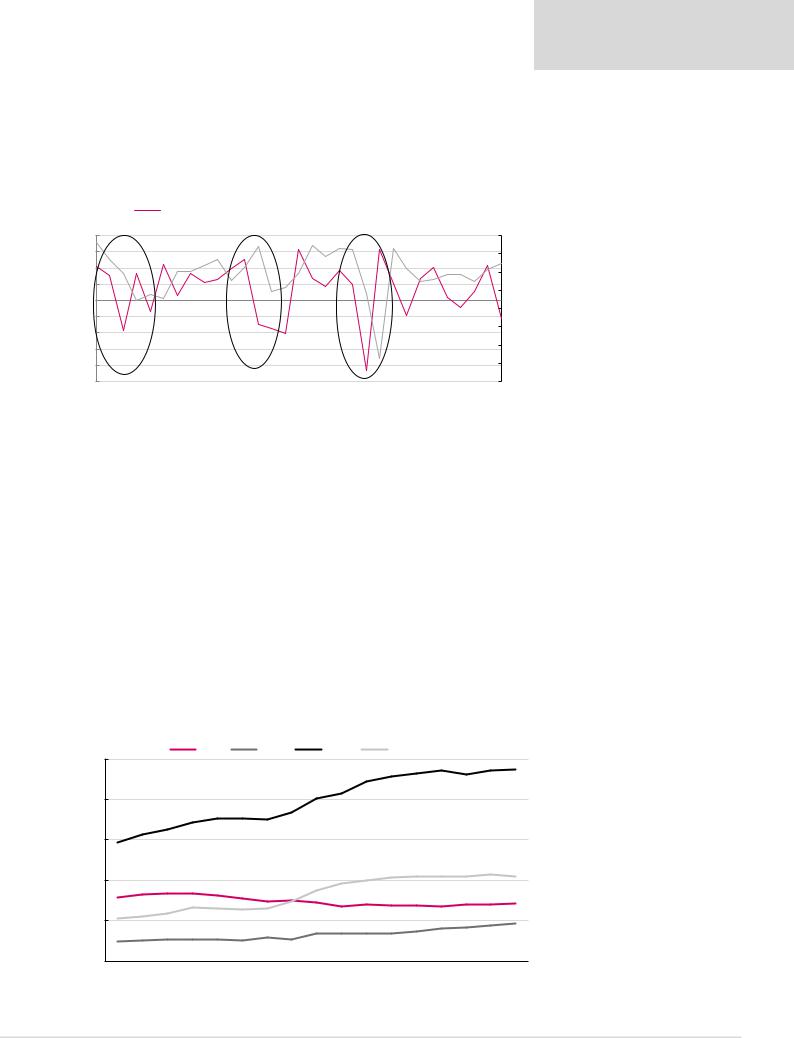
We remain concerned about the potential negative impact of a trade war on the global economy. Falling equity markets have already provided a warning of slower global growth expectations.
Figure 3: MSCI Global Index vs global GDP
MSCI Global Share price index (LHS) |
|
Global GDP growth (RHS) |
|
40% |
|
|
|
|
|
|
|
|
|
|
|
|
|
|
|
|
|
|
|
|
|
|
|
|
|
|
|
|
|
5% |
30% |
|
|
|
|
|
|
|
|
|
|
|
|
|
|
|
|
|
|
|
|
|
|
|
|
|
|
|
|
|
4% |
20% |
|
|
|
|
|
|
|
|
|
|
|
|
|
|
|
|
|
|
|
|
|
|
|
|
|
|
|
|
|
3% |
|
|
|
|
|
|
|
|
|
|
|
|
|
|
|
|
|
|
|
|
|
|
|
|
|
|
|
|
|
|
|
10% |
|
|
|
|
|
|
|
|
|
|
|
|
|
|
|
|
|
|
|
|
|
|
|
|
|
|
|
|
|
2% |
|
|
|
|
|
|
|
|
|
|
|
|
|
|
|
|
|
|
|
|
|
|
|
|
|
|
|
|
|
|
|
0% |
|
|
|
|
|
|
|
|
|
|
|
|
|
|
|
|
|
|
|
|
|
|
|
|
|
|
|
|
|
1% |
-10% |
|
|
|
|
|
|
|
|
|
|
|
|
|
|
|
|
|
|
|
|
|
|
|
|
|
|
|
|
|
|
|
|
|
|
|
|
|
|
|
|
|
|
|
|
|
|
|
|
|
|
|
|
|
|
|
|
|
|
|
|
|
-20% |
|
|
|
|
|
|
|
|
|
|
|
|
|
|
|
|
|
|
|
|
|
|
|
|
|
|
|
|
|
0% |
|
|
|
|
|
|
|
|
|
|
|
|
|
|
|
|
|
|
|
|
|
|
|
|
|
|
|
|
|
|
|
-30% |
|
|
|
|
|
|
|
|
|
|
|
|
|
|
|
|
|
|
|
|
|
|
|
|
|
|
|
|
|
-1% |
|
|
|
|
|
|
|
|
|
|
|
|
|
|
|
|
|
|
|
|
|
|
|
|
|
|
|
|
|
|
|
-40% |
|
|
|
|
|
|
|
|
|
|
|
|
|
|
|
|
|
|
|
|
|
|
|
|
|
|
|
|
|
-2% |
-50% |
|
|
|
|
|
|
|
|
|
|
|
|
|
|
|
|
|
|
|
|
|
|
|
|
|
|
|
|
|
-3% |
1988 |
1989 |
1990 |
1991 |
1992 |
1993 |
1994 |
1995 |
1996 |
1997 |
1998 |
1999 |
2000 |
2001 |
2002 |
2003 |
2004 |
2005 |
2006 |
2007 |
2008 |
2009 |
2010 |
2011 |
2012 |
2013 |
2014 |
2015 |
2016 |
2017 |
2018 |
Source: Bloomberg, Renaissance Capital
Rising interest rates
Renaissance Capital
14 January 2019
Metals & Mining
Falling equity markets could signal an economic slowdown
Rising interest rates could affect asset values and erode consumption, in our view. The US Federal Reserve has stopped its asset purchase programme and interest rates have been rising against the backdrop of high global debt levels. The European Central Bank (ECB) has tapered its asset purchase programme and may stop it by the end of this year. Bloomberg consensus is undecided about whether it may raise rates by 25 bpts in 4Q19.
High debt levels
Government debt levels have been rising since 2008, which may start limiting fiscal stimulus capacity, in our view. This is particularly concerning against the backdrop of rising interest rates.
Figure 4: Government debt to GDP ratios
|
|
|
|
India |
|
China |
|
|
Japan |
|
United States |
|
|
238% |
||
250% |
|
|
|
|
|
|
|
|
|
|
|
|
|
|
|
|
|
|
|
|
|
|
|
|
|
|
|
|
|
|
|
|
|
200% |
|
|
|
|
|
175% |
|
|
|
|
|
|
|
|
|
|
|
|
|
|
|
|
|
|
|
|
|
|
|
|
|
|
|
150% |
|
|
|
|
|
|
|
|
|
|
|
|
|
|
|
|
|
|
|
|
|
|
|
|
|
|
|
|
|
|
|
|
105% |
100% |
|
|
|
|
|
74% |
|
|
|
|
|
|
|
|
|
71% |
|
|
|
|
|
|
|
|
|
|
|
|
|
|
|
||
50% |
|
|
|
|
|
65% |
|
|
|
|
|
|
|
|
|
|
|
|
|
|
|
|
|
|
|
|
|
|
|
|
|
|
|
|
|
|
|
|
|
|
|
|
|
|
|
|
|
|
|
47% |
|
|
|
|
|
|
29% |
|
|
|
|
|
|
|
|
|
|
0% |
|
|
|
|
|
|
|
|
|
|
|
|
|
|
|
|
2001 |
2002 |
2003 |
2004 |
2005 |
2006 |
2007 |
2008 |
2009 |
2010 |
2011 |
2012 |
2013 |
2014 |
2015 |
2016 |
2017 |
Source: IMF, Renaissance Capital
Rising interest rates against the backdrop of high debt levels
6
vk.com/id446425943
Renaissance Capital
14 January 2019
Metals & Mining
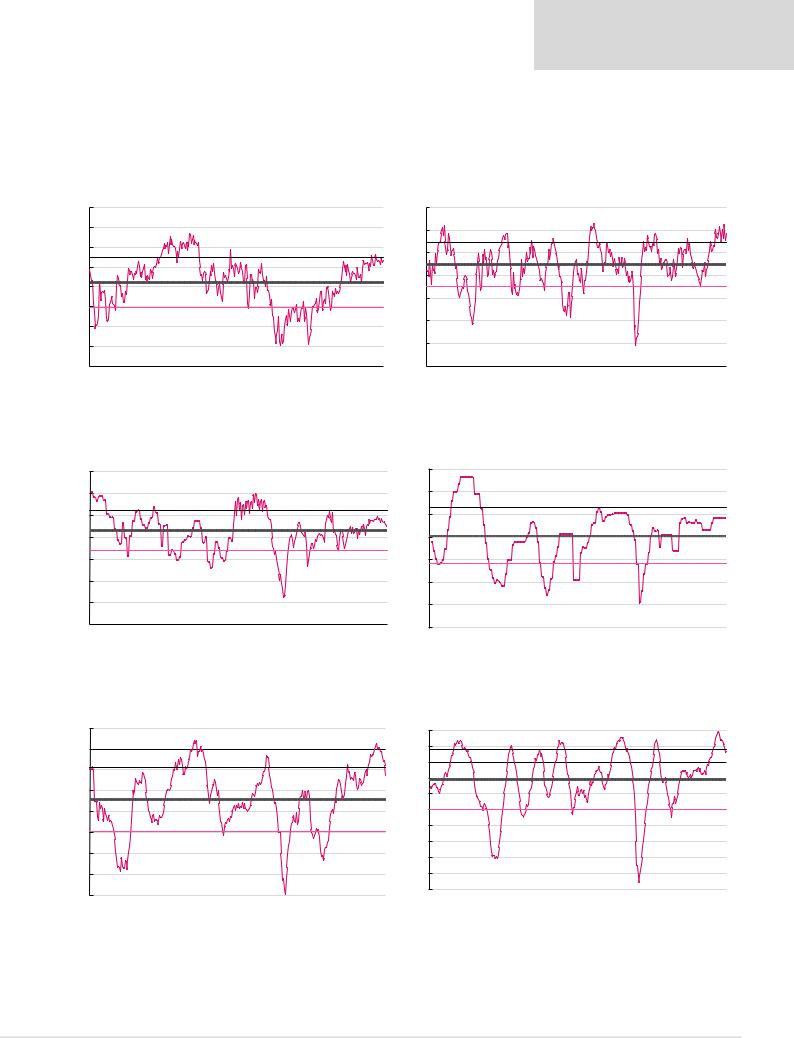
Disappointing Chinese PMI
The worst since 2012
China’s headline official PMI figures have shown a big decline in nearly every month since
May 2018. The December 2018 figure was the worst since at least 2012.
Figure 5: Chinese Purchasing Manager Index (PMI)
2011 |
2012 |
2013 |
|
2014 |
2015 |
2016 |
|
2017 |
2018 |
Expansion above 50 |
|
54 |
|
|
|
|
|
|
|
|
|
|
|
53 |
|
|
|
|
|
|
|
|
|
|
|
52 |
|
|
|
|
|
|
|
|
|
|
|
51 |
|
|
|
|
|
|
|
|
|
|
|
50 |
|
|
|
|
|
|
|
|
|
|
|
|
|
|
|
|
|
|
|
2012, 49.2 |
2011, 49.0 |
|
49.4 |
49 |
|
|
|
|
|
|
|
|
|
||
|
|
|
|
|
|
|
|
|
|
|
|
Jan |
Feb |
Mar |
Apr |
May |
Jun |
Jul |
Aug |
Sep |
Oct |
Nov |
Dec |
Source: IMF, Renaissance Capital
Chinese new export orders, which is a PMI measure of future activity, as it measures the demand for China’s exports by trade partners or other countries, was the worst December figure on record since at least 2011, also echoing the weak October figure.
Figure 6: Chinese new export orders
2011 |
|
2012 |
2013 |
2014 |
2015 |
2016 |
|
2017 |
2018 |
|
Expansion above 50 |
53 |
|
|
|
|
|
|
|
|
|
|
|
52 |
|
|
|
|
|
|
|
|
|
|
|
51 |
|
|
|
|
|
|
|
|
|
|
|
50 |
|
|
|
|
|
|
|
|
|
|
|
49 |
|
|
|
|
|
|
|
|
|
|
|
48 |
|
|
|
|
|
|
|
|
|
|
|
47 |
|
|
|
|
|
|
|
|
|
|
|
|
|
|
|
|
|
|
|
|
|
|
46.6 |
46 |
|
|
|
|
|
|
|
|
|
|
|
45 |
|
|
|
|
|
|
|
|
|
|
|
Jan |
Feb |
Mar |
Apr |
May |
Jun |
Jul |
Aug |
Sep |
Oct |
Nov |
Dec |
Source: IMF, Renaissance Capital
7
vk.com/id446425943
Renaissance Capital
14 January 2019
Metals & Mining
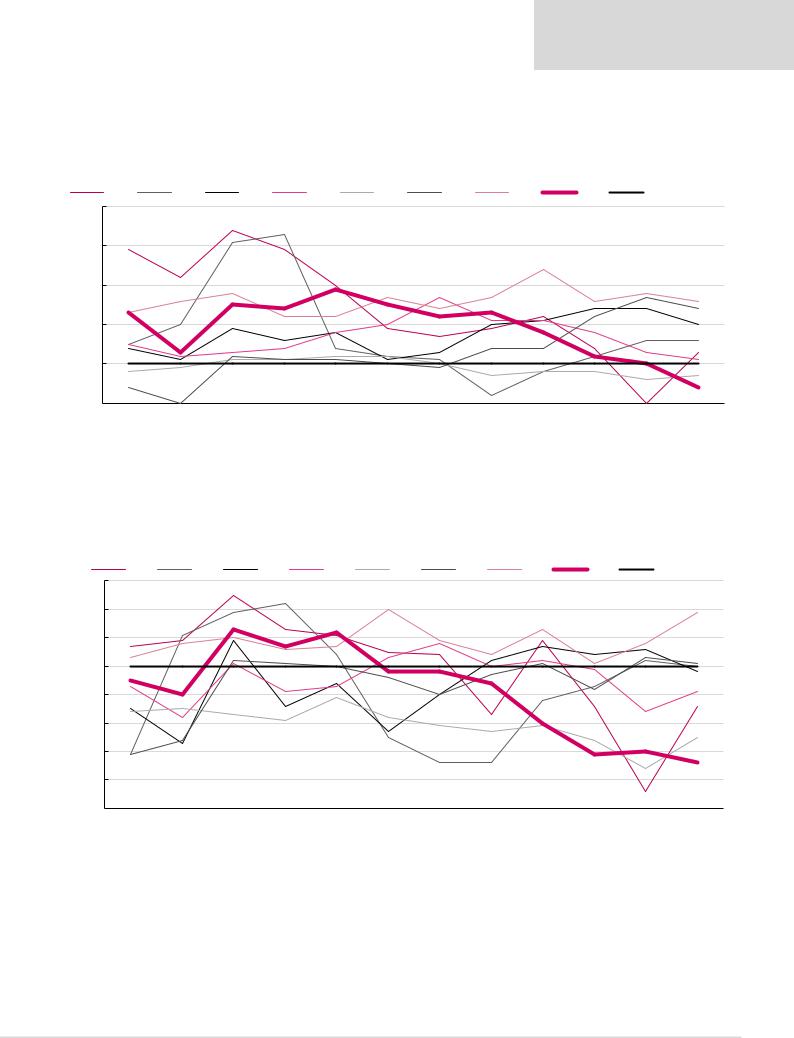
Optimistic sentiment could wane
Sentiment has recovered to optimistic levels since 2009’s lows but is starting to roll over in some countries. We believe if sentiment wanes due to trade war concerns or rising interest rates, economic growth could slow.
Figure 7: US consumer confidence |
Figure 8: US business sentiment |
125 |
|
|
|
|
|
|
|
|
|
|
|
|
|
65 |
115 |
|
|
|
|
|
|
|
|
|
|
|
|
|
60 |
|
|
|
|
|
|
|
|
|
|
|
|
|
|
|
105 |
|
|
|
|
|
|
|
|
|
|
|
|
|
55 |
|
|
|
|
|
|
|
|
|
|
|
|
|
|
|
95 |
|
|
|
|
|
|
|
|
|
|
|
|
|
50 |
|
|
|
|
|
|
|
|
|
|
|
|
|
|
|
85 |
|
|
|
|
|
|
|
|
|
|
|
|
|
|
75 |
|
|
|
|
|
|
|
|
|
|
|
|
|
45 |
|
|
|
|
|
|
|
|
|
|
|
|
|
|
|
65 |
|
|
|
|
|
|
|
|
|
|
|
|
|
40 |
|
|
|
|
|
|
|
|
|
|
|
|
|
|
|
55 |
|
|
|
|
|
|
|
|
|
|
|
|
|
35 |
|
|
|
|
|
|
|
|
|
|
|
|
|
|
|
45 |
|
|
|
|
|
|
|
|
|
|
|
|
|
30 |
1990 |
1992 |
1994 |
1996 |
1998 |
2000 |
2002 |
2004 |
2006 |
2008 |
2010 |
2012 |
2014 |
2016 |
2018 |
1986 |
1988 |
1990 |
1992 |
1994 |
1996 |
1998 |
2000 |
2002 |
2004 |
2006 |
2008 |
2010 |
2012 |
2014 |
2016 |
2018 |
Source: Bloomberg, Renaissance Capital Source: Bloomberg, Renaissance Capital
Figure 9: Japan consumer confidence Figure 10: Japan business sentiment
55 |
|
|
|
|
|
|
|
|
|
|
|
|
|
|
60 |
|
|
|
|
|
|
|
|
|
|
|
|
|
|
|
|
|
|
|
|
|
|
|
|
|
|
|
|
|
|
|
|
|
|
|
|
|
|
|
|
|
|
|
|
|
|
|
|
50 |
|
|
|
|
|
|
|
|
|
|
|
|
|
|
40 |
|
|
|
|
|
|
|
|
|
|
|
|
|
|
|
|
45 |
|
|
|
|
|
|
|
|
|
|
|
|
|
|
20 |
|
|
|
|
|
|
|
|
|
|
|
|
|
|
|
|
40 |
|
|
|
|
|
|
|
|
|
|
|
|
|
|
0 |
|
|
|
|
|
|
|
|
|
|
|
|
|
|
|
|
35 |
|
|
|
|
|
|
|
|
|
|
|
|
|
|
-20 |
|
|
|
|
|
|
|
|
|
|
|
|
|
|
|
|
30 |
|
|
|
|
|
|
|
|
|
|
|
|
|
|
-40 |
|
|
|
|
|
|
|
|
|
|
|
|
|
|
|
|
25 |
|
|
|
|
|
|
|
|
|
|
|
|
|
|
-60 |
|
|
|
|
|
|
|
|
|
|
|
|
|
|
|
|
20 |
|
|
|
|
|
|
|
|
|
|
|
|
|
|
-80 |
|
|
|
|
|
|
|
|
|
|
|
|
|
|
|
|
1990 |
1992 |
1994 |
1996 |
1998 |
2000 |
2002 |
2004 |
2006 |
2008 |
2010 |
2012 |
2014 |
2016 |
2018 |
|
|
|
|
|
|
|
|
|
|
|
|
|
|
|
|
|
1986 |
1988 |
1990 |
1992 |
1994 |
1996 |
1998 |
2000 |
2002 |
2004 |
2006 |
2008 |
2010 |
2012 |
2014 |
2016 |
2018 |
|||||||||||||||
|
|
|
|
|
|
|
|
|
Source: Bloomberg, Renaissance Capital |
|
|
|
|
|
|
|
|
|
|
|
Source: Bloomberg, Renaissance Capital |
||||||||||
Figure 11: EU consumer confidence |
Figure 12: EU business sentiment |
5 |
|
|
|
|
|
|
|
|
|
|
|
|
|
|
10 |
|
|
|
|
|
|
|
|
|
|
|
|
|
|
|
|
0 |
|
|
|
|
|
|
|
|
|
|
|
|
|
|
5 |
|
|
|
|
|
|
|
|
|
|
|
|
|
|
|
|
|
|
|
|
|
|
|
|
|
|
|
|
|
|
|
|
|
|
|
|
|
|
|
|
|
|
|
|
|
|
|
|
-5 |
|
|
|
|
|
|
|
|
|
|
|
|
|
|
0 |
|
|
|
|
|
|
|
|
|
|
|
|
|
|
|
|
|
|
|
|
|
|
|
|
|
|
|
|
|
|
-5 |
|
|
|
|
|
|
|
|
|
|
|
|
|
|
|
|
|
|
|
|
|
|
|
|
|
|
|
|
|
|
|
|
|
|
|
|
|
|
|
|
|
|
|
|
|
|
|
|
|
-10 |
|
|
|
|
|
|
|
|
|
|
|
|
|
|
-10 |
|
|
|
|
|
|
|
|
|
|
|
|
|
|
|
|
|
|
|
|
|
|
|
|
|
|
|
|
|
|
|
|
|
|
|
|
|
|
|
|
|
|
|
|
|
|
|
|
-15 |
|
|
|
|
|
|
|
|
|
|
|
|
|
|
-15 |
|
|
|
|
|
|
|
|
|
|
|
|
|
|
|
|
-20 |
|
|
|
|
|
|
|
|
|
|
|
|
|
|
-20 |
|
|
|
|
|
|
|
|
|
|
|
|
|
|
|
|
|
|
|
|
|
|
|
|
|
|
|
|
|
|
-25 |
|
|
|
|
|
|
|
|
|
|
|
|
|
|
|
|
|
|
|
|
|
|
|
|
|
|
|
|
|
|
|
|
|
|
|
|
|
|
|
|
|
|
|
|
|
|
|
|
|
-25 |
|
|
|
|
|
|
|
|
|
|
|
|
|
|
-30 |
|
|
|
|
|
|
|
|
|
|
|
|
|
|
|
|
|
|
|
|
|
|
|
|
|
|
|
|
|
|
|
|
|
|
|
|
|
|
|
|
|
|
|
|
|
|
|
|
-30 |
|
|
|
|
|
|
|
|
|
|
|
|
|
|
-35 |
|
|
|
|
|
|
|
|
|
|
|
|
|
|
|
|
-35 |
|
|
|
|
|
|
|
|
|
|
|
|
|
|
-40 |
|
|
|
|
|
|
|
|
|
|
|
|
|
|
|
|
|
|
|
|
|
|
|
|
|
|
|
|
|
|
1986 |
1988 |
1990 |
1992 |
1994 |
1996 |
1998 |
2000 |
2002 |
2004 |
2006 |
2008 |
2010 |
2012 |
2014 |
2016 |
2018 |
|
1990 |
1992 |
1994 |
1996 |
1998 |
2000 |
2002 |
2004 |
2006 |
2008 |
2010 |
2012 |
2014 |
2016 |
2018 |
Source: Bloomberg, Renaissance Capital |
Source: Bloomberg, Renaissance Capital |
8

vk.com/id446425943
Biggest contraction in vehicle sales since 2008
The chart below highlights the recent declining trend in global vehicle sales, with sales contracting the most since the global financial crisis.
Figure 13: Global vehicle sales growth, YoY
30% |
|
|
|
|
|
|
|
|
|
|
|
|
|
|
|
|
|
20% |
|
|
|
|
|
|
|
|
|
|
|
|
|
|
|
|
|
10% |
|
|
|
|
|
|
|
|
|
|
|
|
|
|
|
9% |
|
|
|
|
|
|
|
|
|
|
|
|
|
|
|
|
|
|
|
|
|
|
|
|
|
|
|
|
|
|
|
|
Average, 4% |
|
|
||
0% |
|
|
|
|
|
|
|
|
|
|
|
|
|
|
|
|
|
|
|
|
|
|
|
|
|
|
|
|
|
|
|
-3% |
|
|
-5% |
-10% |
|
|
|
|
|
|
|
|
|
|
|
|
|
|
|
|
|
|
|
|
|
|
|
|
|
|
|
|
|
|
|
|
|
|
|
-20% |
|
|
|
|
|
|
|
|
|
|
|
|
|
|
|
|
|
-30% |
|
|
|
|
|
|
|
|
|
|
|
|
|
|
|
|
|
2001 |
2002 |
2003 |
2004 |
2005 |
2006 |
2007 |
2008 |
2009 |
2010 |
2011 |
2012 |
2013 |
2014 |
2015 |
2016 |
2017 |
2018 |
Source: Bloomberg
China’s rising debt levels may eventually limit stimulus
Renaissance Capital
14 January 2019
Metals & Mining
We believe the recent raft of stimulus measures from China, including cuts to the reserve requirement ratio (RRR) and major railway infrastructure approvals, is an attempt to offset the weakening economy, as evidenced by its poor PMI data.
Our global chief economist, Charles Robertson, believes China is following the same economic model as Japan did in the 1980s, and that it is now in about the same position as Japan was in 1984 (Japanese trade war with US).
Figure 14: China total debt and GDP |
|
|
|
|
|
|
|
|
|
|
|
|
|
||||
210 |
|
|
|
Total debt to GDP, % |
|
|
|
|
Real GDP growth rate, % (RHS) |
|
206 |
16 |
|||||
|
|
|
|
|
|
|
|
||||||||||
|
|
|
|
|
|
|
|
|
|
|
|
|
|
|
|||
|
|
|
14.2 |
|
|
|
|
|
|
|
|
|
|
|
|
||
|
|
|
|
|
|
|
|
|
|
|
|
|
|
|
|
|
|
200 |
|
|
|
|
|
|
|
|
|
|
|
|
|
|
|
|
14 |
|
|
|
|
|
|
|
|
|
|
|
|
|
|
|
|
||
190 |
|
|
|
|
|
|
|
|
|
|
|
|
|
|
|
|
|
|
|
|
|
|
|
10.6 |
|
|
|
|
|
|
|
|
12 |
||
|
|
|
|
|
|
|
|
|
|
|
|
|
|
|
|||
180 |
|
|
|
|
|
|
|
|
|
|
|
|
|
|
|
|
10 |
|
|
|
|
|
|
|
|
|
|
|
|
|
|
|
|
||
|
|
|
|
|
|
|
|
|
|
|
|
|
|
|
|
|
|
170 |
|
|
|
|
|
|
|
|
|
|
|
|
|
|
|
|
|
|
|
|
|
|
158 |
|
|
|
|
|
|
|
|
|
6.9 |
8 |
|
|
|
|
|
|
|
|
|
|
|
|
|
|
|
|
|||
160 |
|
|
|
|
|
|
|
|
|
|
|
|
|
|
|
|
|
|
|
|
|
|
|
|
|
|
|
|
|
|
|
|
|
6 |
|
|
|
|
|
|
|
|
|
|
|
|
|
|
|
|
|
||
150 |
|
|
|
|
|
|
|
|
|
|
|
|
|
|
|
|
|
|
|
|
|
|
|
|
|
|
|
|
|
|
|
|
|
4 |
|
140 |
|
|
|
|
|
|
|
|
|
|
|
|
|
|
|
|
|
|
|
|
|
|
|
|
|
|
|
|
|
|
|
|
|
2 |
|
130 |
|
|
|
|
|
|
|
|
|
|
|
|
|
|
|
|
|
|
|
|
|
129 |
|
|
|
|
|
|
|
|
|
|
|
||
120 |
|
|
|
|
|
|
|
|
|
|
|
|
|
|
|
0 |
|
|
|
|
|
|
|
|
|
|
|
|
|
|
|
|
|
||
2004 |
2006 |
2007 |
2007 |
2008 |
2009 |
2010 |
|
2011 |
2012 |
2013 |
2014 |
2015 |
2016 |
2017 |
|
||
Source: IMF, Renaissance Capital
However, we believe we would need to see higher interest rates to trigger a crash. With high savings, the loan to deposit ratio is around 70% in China. China now has a surplus of savings, so interest rates are low and excess savings get exported abroad – which we are seeing in cheap Chinese financing to Africa/Asia/etc.
Higher interest rates could trigger a crash
9
vk.com/id446425943
Renaissance Capital
14 January 2019
Metals & Mining
Higher interest rates triggered Japan’s crash when its total debt ratio was around 250-300% of GDP. This was a policy choice of Japan in 1989-1990 because inflation was picking up.
The Japanese tend to save in cash, not equities, so higher inflation erodes their savings. When inflation picked up – due to a property boom that saw the Imperial Palace in Tokyo become more expensive in real estate terms than all of California – Japan had to put the brakes on, even though this damaged a highly indebted economy.
However, we do not think we are there yet. In fact, falling oil prices and slowing growth point to subdued inflation and no obvious reason for interest rates to soar. Debt could topple the economy if growth disappears, but in a low inflation environment we think China can afford a bit more stimulus.
Our economist pencils in a China crash in 2024, partly due to debt levels and funding costs reaching unsustainable levels.
When Chinese inflation increases to 5-10%, we see a risk of a material slowdown. We are not there yet…
Figure 15: Chinese GDP % change and $bn increase (if CNY6.6/$ in China’s lending – rolling 12M cumulative 2018 and CNY6.8/$ in 2019)
|
$bn rise in Chinese GDP (LHS) |
|
Real GDP % ch Rencap forecasts (RHS) |
|
Real GDP % IMF (RHS) |
|
|
|
2,200 |
|
|
|
|
|
|
|
|
|
|
|
|
|
|
|
|
|
|
|
|
|
|
|
16 |
|
|
|
|
|
Commodity boom |
|
|
|
|
|
|
|
|
|
|
|
|
|
|
|
|
|||
1,700 |
|
|
|
|
|
|
|
|
|
|
|
|
|
|
|
|
|
|
|
|
|
|
|
14 |
1,200 |
|
|
|
|
|
|
|
|
|
|
|
|
|
|
|
|
|
|
|
|
|
|
|
12 |
700 |
|
|
|
|
|
|
|
|
|
|
|
|
|
|
|
|
|
|
|
|
|
|
|
10 |
200 |
|
|
|
|
|
|
|
|
|
|
|
|
|
|
|
|
|
|
|
|
|
|
|
8 |
-300 |
|
|
|
|
|
|
|
|
|
|
|
|
|
|
|
|
|
|
|
|
|
|
|
6 |
-800 |
|
|
|
|
|
|
|
|
|
Commodities fell until 2016 |
|
|
|
|
|
|
|
|
4 |
|||||
|
|
|
|
|
|
|
|
|
|
|
|
|
|
|
|
|
|
|
|
|
|
|
||
-1,300 |
|
|
|
|
|
|
|
|
|
|
|
|
|
|
|
|
|
|
|
|
|
|
|
2 |
-1,800 |
|
|
|
|
|
|
|
|
|
|
|
|
|
|
|
|
|
|
|
|
|
|
|
0 |
2001 |
2002 |
2003 |
2004 |
2005 |
2006 |
2007 |
2008 |
2009 |
2010 |
2011 |
2012 |
2013 |
2014 |
2015 |
2016 |
2017 |
2018E |
2019E |
2020E |
2021E |
2022E |
2023E |
2024E |
2025E |
Source: IMF, Renaissance Capital
India’s debt levels present risk and limit its growth potential
Our economist’s base case for India is that is about to industrialise and grow at 7-9% a year for the next 20 years, thanks to literacy, electricity and investment. India has little external debt – just 20% of GDP, which limits risk. India will be increasingly important for commodity demand from the mid-2020s onwards, in our view.
However, India’s budget and public debt has always been a focus area. We believe this contributed to India’s weakness in the 2013 taper tantrum. India needs high GDP growth to keep its debt ratios in check. Efforts to get rid of high-value cash notes recently were partly about trying to improve tax collection.
Our base case
India’s debt makes it vulnerable
10
vk.com/id446425943
Renaissance Capital
14 January 2019
Metals & Mining
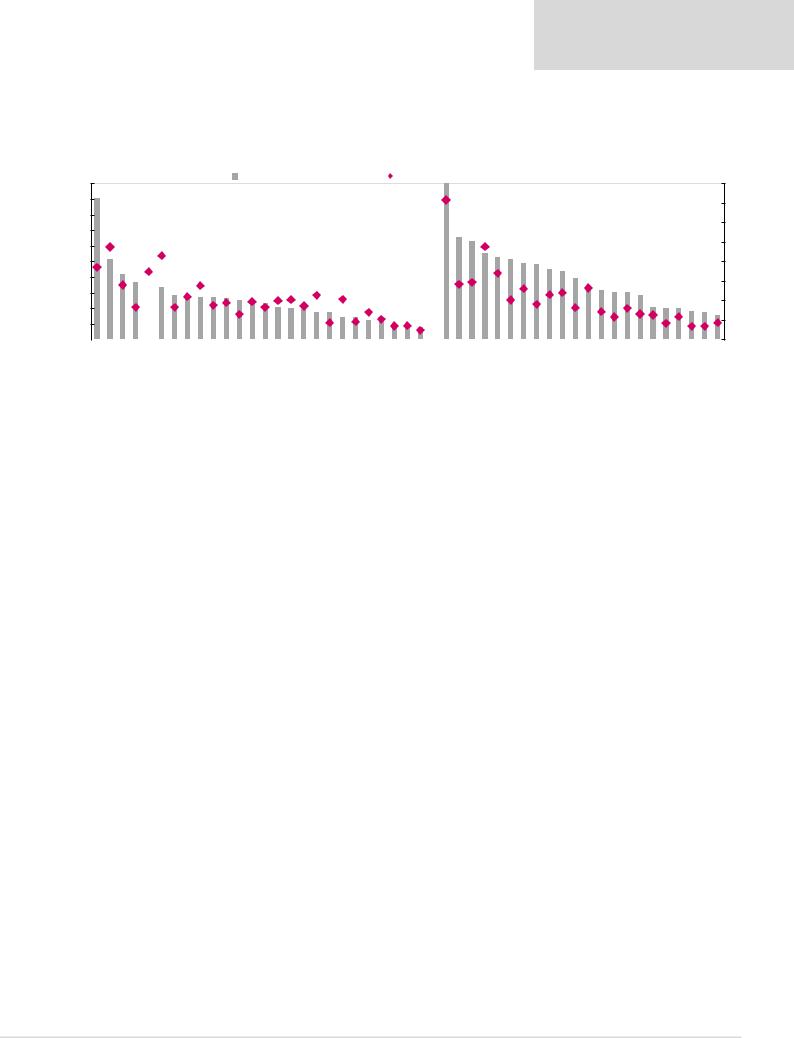
India has the fifth-highest government debt/GDP in emerging markets (EM), but the fourth-highest debt as a proportion of government revenue – i.e. worse than Brazil and much worse than Hungary (which has low interest rates) but better than Pakistan.
Figure 16: Debt/GDP (LHS) and debt/revenue (RHS), in EM and DM (excluding Hong Kong)
India has the fourth-highest government debt to revenue in emerging markets
200
180
160
140
120
100
80
60
40
20
0
Government debt, %GDP, 2017 Government debt to revenue (x), 2017 (RHS)
8
|
|
|
|
|
|
|
|
|
|
7 |
||
|
|
|
|
|
|
|
|
Japan is 238% (LHS) and 7.2 (RHS) |
|
|||
|
|
|
|
|
|
|
|
|
|
|
|
|
|
|
|
|
|
|
|
|
|
|
6 |
||
|
|
|
|
|
|
|
|
|
|
|
|
|
|
|
|
|
4.3x |
|
|
|
|
|
5 |
||
2.8x |
3.5x |
|
1.9x |
1.7x |
2.8x |
3.4x |
2.4x |
|
4 |
|||
|
|
|
|
|
|
|
|
|
|
|
||
|
|
|
|
|
|
|
|
|
|
|
3 |
|
|
|
|
|
|
|
|
|
|
|
|
||
|
|
|
|
|
|
|
|
|
|
|
|
|
|
|
|
|
|
|
|
|
|
|
2 |
||
|
|
|
|
|
|
|
|
|
|
|
|
|
|
|
|
|
|
|
|
|
|
|
|
1 |
|
|
|
|
|
|
|
|
|
|
|
|
0 |
|
|
Hungary India |
|
|
Poland Colombia China Thailand Philippines Korea Taiwan CzechRepublic Indonesia Turkey Peru Chile UAE Saudi Arabia Russia |
|
Portugal Singapore US Belgium |
Spain France Canada UK Austria Ireland Germany Finland |
|
||||
Greece Egypt Brazil |
Pakistan Argentina Mexico Malaysia |
Qatar South Africa |
Japan Italy |
Israel Netherlands Switzerland Sweden Australia Norway Denmark New Zealand |
||||||||
|
|
|
|
|
|
|
|
|
|
Source: IMF, Renaissance Capital |
||
Interest rates matter in this analysis, and they are low for Greece (thanks to EU support) and Hungary. In Brazil they are now in the single digits, but are still very high in Egypt. India has just replaced its central bank governor, so its central bank may become more dovish.
When looking at total debt, India’s private sector debt is just around 50% of GDP, while China is 159% of GDP. So total debt in India is around 120% of GDP, while in China it is about 206% of GDP using the same methodology.
India therefore looks to be in a better position than China on total debt. However, India’s public debt to public government revenue ratio is worse than China’s and its interest rates are higher. Debt funding costs therefore consume a bigger proportion of India’s revenue.
India’s public debt to public government revenues ratio is worse than China’s
11