

vk.com/id446425943
Nickel
Renaissance Capital
14 January 2019
Metals & Mining
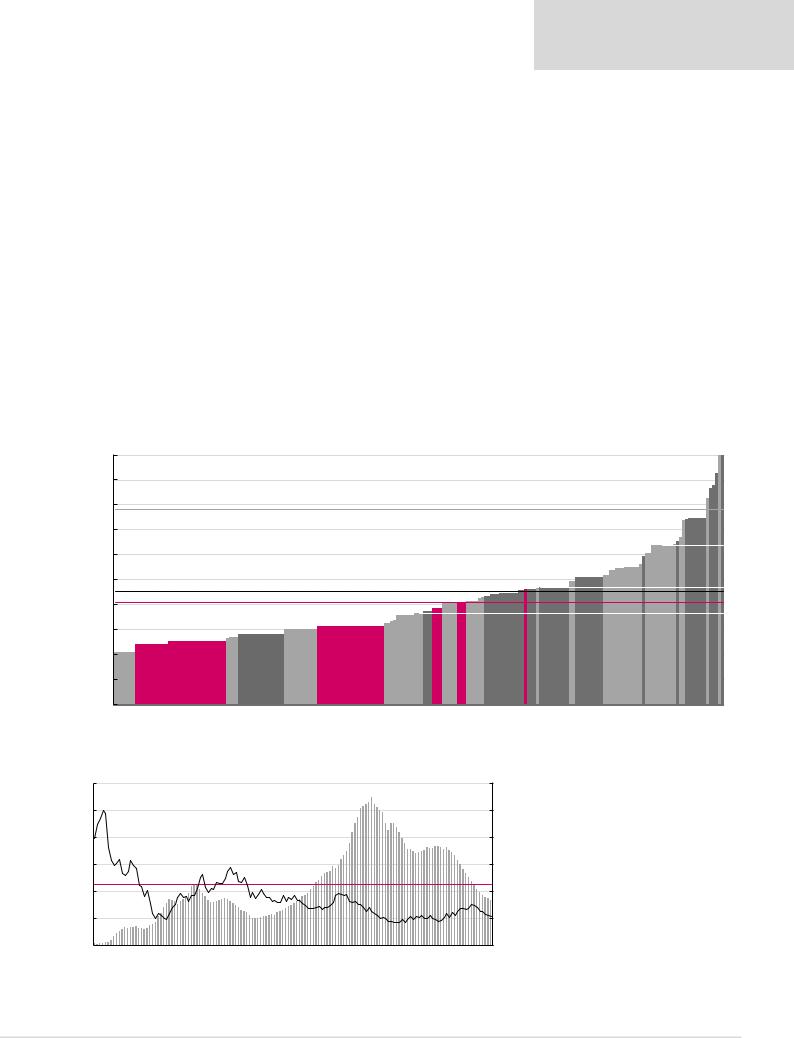
We are constructive on the outlook for nickel prices, given rapidly declining inventory days coupled with a continued market deficit forecast over the medium term, as continued growth in nickel pig iron production is broadly matched by strong nickel demand in stainless steel from Indonesia and China. Nickel prices have been under pressure and now render around 46% of the industry cash-burning. We believe this could lead to supply cuts, which could support higher nickel prices. From a longer-term perspective, we believe the electrification of the drive train could support increased demand for batterygrade nickel. Glencore and CRU forecast that nickel demand could grow by around 55% (c.1.1mn t) between 2017 and 2030 due to the metal requirements to enable the Electric Vehicle Initiative target of 30% EV market share by 2030.
We believe supply growth could be limited as we calculate the incentive price for new projects at $17,400/t. We see limited growth in nickel in pig iron, which remains at the upper end of the cost curve. We therefore believe supply could struggle to keep up with growing demand. The key downside risk is a cyclical demand downturn, driven by a potential pullback in global GDP growth rates due to escalating trade wars and higher interest rates and oil prices, which could put further pressure on over-indebted emerging markets.
Nickel cost curve (2.3mnt)
Figure 62: 2018E nickel cash costs plus sustaining capex, $/t
22,000 |
|
|
|
|
|
|
|
|
|
20,000 |
|
|
|
|
|
|
|
|
|
18,000 |
Incentive price: $17,600/t |
|
|
|
|
|
|
|
|
|
|
|
|
|
|
|
|
|
|
16,000 |
|
|
|
|
|
|
|
|
|
14,000 |
|
|
|
|
|
|
|
|
|
$/t |
|
|
|
|
|
|
|
|
|
12,000 |
Spot price: $11,081/t* |
|
8,283Vale, |
|
South32,9,665 |
American,Anglo10,212 |
|
ARM, 11,232 |
|
10,000 |
6,836Glencore, |
7,009Norilsk, |
|
|
|
||||
|
Average cash cost: $10,160/t |
|
|
|
|
|
|
|
|
8,000 |
|
|
|
|
|
|
|
|
|
6,000 |
|
|
|
|
|
|
|
|
|
4,000 |
|
|
|
|
|
|
|
|
|
2,000 |
|
|
|
|
|
|
|
|
|
*Priced as at 8 January 2019 |
|
|
|
|
|
|
|
|
|
Figure 63: Nickel LME inventory days and price, $/t (RHS) |
|
|
|
|
|
|
|||
120 |
|
|
|
110 |
|
|
|
|
60,000 |
49,825 |
|
|
|
|
|
|
|
|
|
100 |
|
|
|
|
|
|
|
|
50,000 |
80 |
31,325 |
|
|
70 |
71 |
|
|
|
40,000 |
|
28,972 |
|
|
|
|
60 |
|
|
|
|
|
|
|
|
|
|
|
||
60 |
|
|
20,774 |
|
|
|
|
|
30,000 |
Average exchange stock days, 45 |
|
|
|
|
|
|
|||
|
|
|
|
|
|
|
|||
40 |
31 |
31 |
|
|
|
|
|
33 |
20,000 |
|
|
|
21 |
|
|
|
|
10,605 |
|
|
|
|
|
|
|
|
|
|
|
20 |
13 |
|
|
|
|
|
|
|
10,000 |
2 |
|
|
|
|
|
|
|
|
|
0 |
|
|
|
|
|
|
|
|
0 |
Jan-07 Jun-07 |
Nov-07 Apr-08 Sep-08 Feb-09 Jul-09 |
Dec-09 May-10 Oct-10 Mar-11 Aug-11 Jan-12 Jun-12 Nov-12 Apr-13 Sep-13 Feb-14 |
Jul-14 Dec-14 May-15 Oct-15 |
Mar-16 Aug-16 |
Jan-17 Jun-17 |
Nov-17 Apr-18 |
Sep-18 |
|
|
Note: Calculated as exchange inventory/global refined nickel demand*365.
Source: Bloomberg, Renaissance Capital
90th percentile: $14,776/t
70th percentile: $11,348/t
50th percentile: $9,314/t
Source: Bloomberg, CRU, Renaissance Capital estimates
Nickel inventory has reduced closer to long-term average levels. Further reduction in inventory may become price-supportive
37
vk.com/id446425943
Renaissance Capital
14 January 2019
Metals & Mining
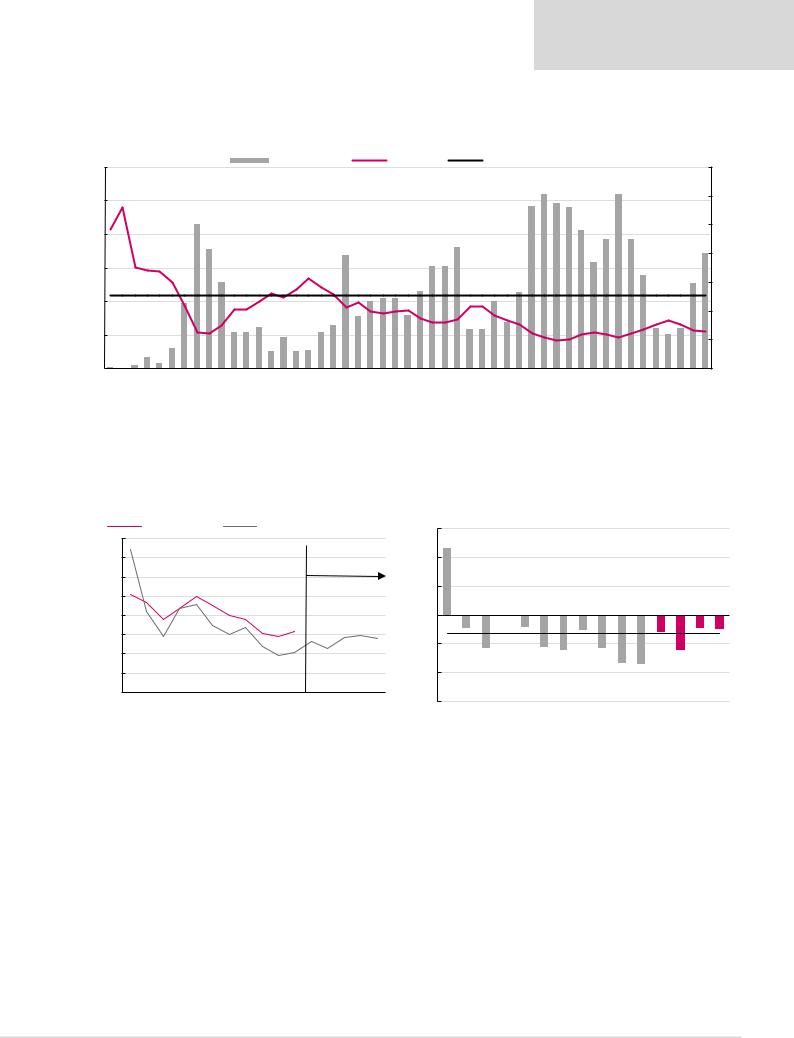
Nickel prices have been under pressure and now render around 46% of the industry cashburning. We believe this could lead to supply cuts, which could support higher nickel prices.
Figure 64: Percentage of Nickel cost curve that is cash-burning over time
59,999 |
|
|
|
|
|
|
|
|
|
|
|
|
|
% Cash burning |
|
|
|
|
Nickel, $/t |
|
|
|
Average LT cash burn |
|
|
|
|
|
|
|
|
|
|
|
70% |
|||||||||||||||
|
|
|
|
|
|
|
|
|
|
|
|
|
|
|
|
|
|
|
|
|
|
|
|
|
|
|
|
|
|
|
|
|
|
56.5% |
60.5% |
57.5% |
56.0% |
|
|
|
60.5% |
|
|
|
|
|
|
|
||
49,999 |
48,055 |
|
|
|
|
50.0% |
|
|
|
|
|
|
|
|
|
|
|
|
|
|
|
|
|
|
|
|
|
|
|
|
|
|
48.0% |
|
|
|
|
|
|
|
|
|
60% |
|||||||
|
|
|
|
|
|
|
|
|
|
|
|
|
|
|
|
|
|
|
|
|
|
|
|
|
|
|
|
|
|
|
|
|
|
|
|
|
|
|
|
|
|
|||||||||
|
|
|
|
|
|
|
|
|
|
|
|
|
|
|
|
|
|
|
|
|
|
|
|
|
|
|
|
|
|
|
|
|
|
45.0% |
45.0% |
|
|
|
|
|
|
|
||||||||
39,999 |
|
|
|
|
|
|
|
41.5% |
|
|
|
|
|
|
|
|
|
|
39.5% |
|
|
|
|
|
|
|
|
42.0% |
|
|
|
|
|
37.0% |
|
|
|
|
|
40.0% |
50% |
|||||||||
|
|
|
|
|
|
|
|
|
|
|
|
|
|
|
|
|
|
|
|
|
|
|
35.5% |
35.5% |
|
|
|
|
|
|
|
|
|
|
|
|||||||||||||||
|
|
|
|
|
|
|
|
30.0% |
|
|
|
|
|
26,899 |
|
|
|
|
|
|
27.0% |
|
|
|
|
26.5% |
32.5% |
|
|
|
29.5% |
40% |
||||||||||||||||||
29,999 |
|
|
|
|
|
|
|
|
|
|
|
|
|
|
23.5% |
24.5% |
24.5% |
|
|
|
23.5% |
|
|
|
|
|
||||||||||||||||||||||||
|
|
|
|
|
|
22.5% |
|
|
|
|
|
|
|
|
|
|
|
|
|
|
|
|
|
|
||||||||||||||||||||||||||
|
|
|
|
|
|
|
|
|
|
|
|
|
|
|
|
|
|
|
|
|
|
|
|
|
||||||||||||||||||||||||||
|
|
|
|
|
|
|
|
|
|
|
|
|
|
|
|
|
|
|
18.0% |
18.5% |
|
|
16.0% |
|
Average LT cash burn, 25.4% |
|
|
|
|
30% |
||||||||||||||||||||
|
|
|
|
|
|
|
|
|
|
|
|
14.5% |
|
|
|
|
|
15.0% |
|
|
|
|
|
|
|
|
||||||||||||||||||||||||
19,999 |
|
|
|
|
|
|
|
|
|
12.5% |
12.5% |
|
11.0% |
|
|
12.5% |
13.5% |
13.5% |
|
|
|
|
|
|
|
|
|
|
14.0% |
12.0% |
14.0% |
11,081 20% |
||||||||||||||||||
|
|
|
|
|
|
7.0% |
|
|
|
6.0% |
6.0% |
6.5% |
|
|
|
|
|
|
|
|
|
|
||||||||||||||||||||||||||||
9,999 |
0.5% |
0.0% |
1.0% |
4.0% |
2.0% |
|
|
|
|
|
|
|
|
|
|
|
|
|
|
|
10% |
|||||||||||||||||||||||||||||
|
10,459 |
|
|
|
|
|
|
|
|
|
|
|
|
|
||||||||||||||||||||||||||||||||||||
|
|
|
|
|
|
|
|
|
|
|
|
|
|
|
|
|
||||||||||||||||||||||||||||||||||
-1 |
Mar 07 |
Jun 07 |
Sep 07 |
Dec 07 |
Mar 08 |
Jun 08 |
Sep 08 |
Dec 08 |
Mar 09 |
Jun 09 |
Sep 09 |
Dec 09 |
Mar 10 |
Jun 10 |
Sep 10 |
Dec 10 |
Mar 11 |
Jun 11 |
Sep 11 |
Dec 11 |
Mar 12 |
Jun 12 |
Sep 12 |
Dec 12 |
Mar 13 |
Jun 13 |
Sep 13 |
Dec 13 |
Mar 14 |
Jun 14 |
Sep 14 |
Dec 14 |
Mar 15 |
Jun 15 |
Sep 15 |
Dec 15 |
Mar 16 |
Jun 16 |
Sep 16 |
Dec 16 |
Mar 17 |
Jun 17 |
Sep 17 |
Dec 17 |
Mar 18 |
Jun 18 |
Sep 18 |
Dec 18 |
Spot |
0% |
|
|
|||||||||||||||||||||||||||||||||||||||||||||||||
Source: Bloomberg, CRU, Renaissance Capital estimates
Our long-term nickel price forecast of $14,000/t is around 5% below the 90th percentile of the nickel cost curve.
Figure 65: Nickel price vs cash costs* at the 90th percentile |
Figure 66: Nickel price premium (discount) to the 90th percentile |
|
40,000 |
|
Cash costs, $/t |
|
|
|
Nickel average price. $/t |
|
|
60% |
46% |
|
|
|
|
|
|
|
|
|
|
|
|
|
|
||||||
|
|
|
|
|
|
|
|
|
|
|
|
|
|
|
|
|
|
|
|
|
|
|
|
|
|
|
|
|
|
||
|
|
|
|
|
|
|
|
|
|
|
|
|
|
|
|
|
|
|
|
|
|
|
|
|
|
|
|
|
|
|
|
$/t |
35,000 |
25,461 |
23,297 |
19,074 |
21,898 |
24,934 |
22,585 |
19,893 |
18,877 |
15,436 |
14,508 |
10,404 13,130 |
11,530 14,285 |
14,680 |
14,000 |
40% |
|
9%- |
23%- |
0% |
8%- |
22%- |
24%- |
11%- |
23%- |
34%- |
34%- |
11%- |
24%- |
9%- |
9%- |
|
|
|
|
|
|
|
|
|
|
|
|
|
Forecasts |
|
|
|
|
|
|
|
|
|
|
|
|
|
|
|
|
|
|
|
30,000 |
|
|
|
|
|
|
|
|
|
|
|
|
|
|
20% |
|
|
|
|
|
|
|
|
|
|
|
|
|
|
|
|
|
|
|
|
|
|
|
|
|
|
|
|
|
|
|
|
|
|
|
|
|
|
|
|
|
|
|
|
|
|
|
|
25,000 |
|
|
|
|
|
|
|
|
|
|
15,833 |
|
|
|
|
|
|
|
|
|
|
|
|
|
|
|
|
|
|
|
|
20,000 |
|
|
|
|
|
|
|
|
|
|
|
|
|
0% |
|
|
|
|
|
|
|
|
|
|
|
|
|
|
|
|
|
|
|
|
|
|
|
|
|
|
|
|
|
|
|
|
|
|
|
|
|
|
|
|
|
|
|
|
|
|
||
|
15,000 |
|
|
|
|
|
|
|
|
|
|
|
|
|
|
|
|
|
|
|
|
Historical average, -13% |
|
|
|
|
|||||
|
|
|
|
|
|
|
|
|
|
|
|
|
|
|
-20% |
|
|
|
|
|
|
|
|
|
|
|
|
|
|
|
|
|
|
|
|
|
|
|
|
|
|
|
|
|
|
|
|
|
|
|
|
|
|
|
|
|
|
|
|
|
|
|
|
|
10,000 |
|
|
|
|
|
|
|
|
|
|
|
|
|
|
|
|
|
|
|
|
|
|
|
|
|
|
|
|
|
|
|
5,000 |
|
|
|
|
|
|
|
|
|
|
|
|
|
|
-40% |
|
|
|
|
|
|
|
|
|
|
|
|
|
|
|
|
0 |
2007 |
2008 |
2009 |
2010 |
2011 |
2012 |
2013 |
2014 |
2015 |
2016 |
2017 2018E |
2019E 2020E |
2021E |
LT (real) |
-60% |
|
|
|
|
|
|
|
|
|
|
|
|
|
|
|
|
|
2007 |
2008 |
2009 |
2010 |
2011 |
2012 |
2013 |
2014 |
2015 |
2016 |
2017 |
2018E |
2019E |
2020E |
2021E |
|||||||||||||||
|
|
|
|||||||||||||||||||||||||||||
*Cash costs net of by-product credits plus sustaining capex.
Source: Bloomberg, CRU, Renaissance Capital estimates |
Source: Bloomberg, CRU, Renaissance Capital estimates |
38
vk.com/id446425943
Zinc
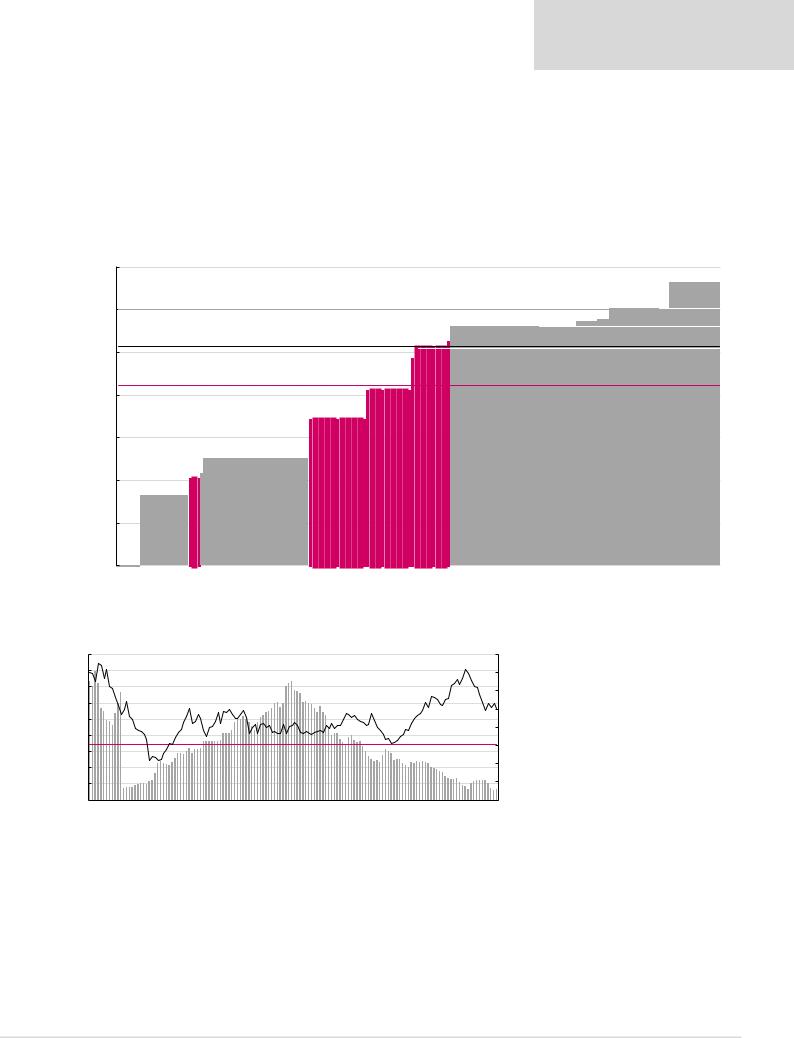
Low inventory levels of around five days are supportive for zinc prices at around $2,633/t. We forecast our long-term zinc price at $2,600/t, which is below our estimate of $3,017/t at the 90th percentile of the cost curve. We believe the incentive price to build new zinc projects is around $3,000/t. Glencore has around 400kt of latent zinc capacity that could come back over the medium term, and Gamsberg is ramping up to around 250k tpa by 2020.
Renaissance Capital
14 January 2019
Metals & Mining
Zinc cost curve (6mnt out of global supply of around 14mnt)
Figure 67: 2017 zinc cash costs plus sustaining capex, $/t
3,500
3,000
2,500
2,000
$/t
1,500
1,000
500
0
Incentive price: $3,000/t |
90th percentile: $3,017/t |
|
828Boliden, |
AmericaNorth |
1,253,(Vedanta)Hindustan |
1,705(TECK),MineDogRed |
(GLEN),Australia2,039 |
(SCCO)unitIMMSAMexican, 2,414 |
TrailMine (TECK), 2,541 |
(TECK),MineOreillePend 2,616 |
Nyrstar, 2,805 |
Noranda, 2,864 |
Manitoba, 2,889 |
Votorantim, 3,017 |
Spot price: $2,575/t* |
|
|
|
|
|
|
|
|
|
|
|
Average cash cost: $2,116/t |
|
|
|
|
|
|
|
|
|
||
|
(GLEN),1,011 |
|
|
|
|
|
|
|
|
|
|
|
Griffin,1,079 |
|
|
|
|
|
|
|
|
|
|
Estimated top, 3,318
*Priced as at 8 January 2019.
Source: Bloomberg, Company data, Renaissance Capital
Figure 68: LME inventory days of zinc slab demand and price, $/t
45 |
3,587 |
|
|
|
|
|
|
|
|
|
|
|
|
|
|
|
|
3,596 |
|
|
4,000 |
||
40 |
|
33 |
|
|
|
|
|
|
37 |
|
|
|
|
|
|
|
|
2,853 |
|
|
|
|
3,500 |
35 |
|
|
|
|
|
|
|
|
|
|
|
|
|
|
|
|
|
|
|
|
3,000 |
||
|
|
|
2,529 |
|
|
|
|
|
|
29 |
|
|
|
|
|
|
|
|
|
|
|
||
|
28 |
|
|
|
|
|
|
|
|
|
|
2,367 |
|
|
|
|
|
|
|
||||
30 |
|
|
|
|
|
|
|
|
|
|
|
|
|
|
|
|
|
|
|
||||
|
|
|
|
|
|
|
|
|
|
|
|
|
|
|
|
|
|
|
|
|
|
2,500 |
|
|
|
|
1,897 |
|
|
|
|
|
|
|
|
|
|
|
|
|
|
|
|
|
|
|
|
25 |
|
|
|
20 |
|
|
|
|
|
|
|
|
|
|
|
|
|
|
|
2,5192,000 |
|||
|
|
|
|
|
|
|
|
|
|
|
|
|
|
|
|
|
|
|
|||||
|
|
|
|
|
|
|
|
|
|
|
|
|
18 |
|
|
|
|
|
|
||||
20 |
|
|
|
|
|
|
|
|
|
|
|
|
|
|
|
|
|
|
|
||||
|
Average exchange stock days, 17 |
|
|
|
|
|
|
|
|
|
|
|
|
|
|
|
|
|
|||||
|
|
|
|
|
|
|
|
|
|
|
|
|
|
|
|
|
|
|
|||||
|
|
|
|
|
|
|
|
|
|
|
|
|
|
|
|
|
|
|
1,500 |
||||
15 |
|
|
|
11 |
|
|
|
|
|
|
|
|
|
|
|
|
11 |
|
|
|
|
|
|
|
|
|
|
|
|
|
|
|
|
|
|
|
|
|
|
|
|
|
|
1,000 |
|||
10 |
|
|
|
|
|
|
|
|
|
|
|
|
|
|
|
|
|
|
|
6 |
5 |
|
|
|
|
4 |
|
|
|
|
|
|
|
|
|
|
|
|
|
|
|
4 |
3 |
500 |
|||
5 |
|
|
|
|
|
|
|
|
|
|
|
|
|
|
|
|
|
|
|
|
|
||
|
|
|
|
|
|
|
|
|
|
|
|
|
|
|
|
|
|
|
|
|
|
||
0 |
|
|
|
|
|
|
|
|
|
|
|
|
|
|
|
|
|
|
|
|
|
|
0 |
Jan-07 |
Jun-07 |
Nov-07 |
Apr-08 Sep-08 |
Feb-09 Jul-09 Dec-09 May-10 |
Oct-10 Mar-11 |
Aug-11 |
Jan-12 |
Jun-12 |
Nov-12 |
Apr-13 |
Sep-13 |
Feb-14 |
Jul-14 |
Dec-14 |
May-15 |
Oct-15 |
Mar-16 |
Aug-16 Jan-17 Jun-17 |
Nov-17 |
Apr-18 |
Sep-18 |
|
|
Note: Calculated as exchange inventory/global zinc slab demand*365.
Source: Bloomberg, CRU, Renaissance Capital
Zinc inventory days are well below long-term average levels
39
vk.com/id446425943
Diamonds
In Alrosa’s view, synthetic diamonds seem to be of little concern to the midstream and jewellery segment, as they are sceptical about this product replacing naturals. The base case, according to people in the industry, is that synthetics will be fashion jewellery for everyday use (Swarovski-like, rather than Tiffany-like products).
Renaissance Capital
14 January 2019
Metals & Mining
Synthetics not seen as a major threat
Diamonds cost curve (106mn cts)
Figure 69: 2017 diamonds all-in sustaining cash costs, $/ct
280
Incentive price: $260/ct
240
Spot price: $207/ct*
200 |
|
|
|
|
|
|
|
|
|
|
|
|
|
|
|
|
90th percentile: $190/ct |
209 |
||
|
|
|
|
|
|
|
|
|
|
|
|
|
|
|
|
|
|
|
||
|
|
|
|
|
|
|
|
|
|
|
|
|
|
|
|
|
|
Catoca mine,195 |
198 |
|
160 |
|
|
|
|
|
|
|
|
|
|
|
|
|
pit |
-1 pipe, 183 |
Aikhal mine, 188 |
Rio Tinto, 190 |
pipe, |
||
|
Average cash cost: $142/ct |
|
|
|
|
|
|
|
|
|
|
180 |
||||||||
|
|
|
|
|
152 153 |
|
153 153 |
|
|
|
|
Petra, |
(JV) Petra,- |
|||||||
|
|
|
|
|
|
|
|
|
|
|
|
|||||||||
120 |
|
|
|
|
|
|
Petra, |
|
pipe, |
|
|
|
|
- |
||||||
|
|
|
|
|
|
|
|
|
|
|
|
|||||||||
|
|
|
|
|
|
|
- |
|
(Nyurba), |
|
|
|
|
underground |
||||||
|
|
|
|
|
|
|
Canada, |
|
|
|
|
|
||||||||
80 |
|
|
|
|
|
|
Finsch |
|
deposits |
|
|
|
|
Cullinan |
mine,182 |
Zapolyarnaya |
||||
|
|
|
|
|
|
|
|
|
|
|
|
|||||||||
40 |
|
|
|
|
|
|
|
Botuobinskaya |
|
|
|
|
||||||||
Namdeb,20 |
Internatsionalnymine,39 deposits(Mirny),Aluvial75 |
Jubileepipe,92 |
Debswana,99 |
mine,122Mir |
Canada,Beers152De |
BeersDe |
Nyurbinsky,153 |
Alluvial |
Africa,BeersSouth156De |
Udachnayamine,open159pit |
AnabaraAlmazyNizhne&- |
Lenskoye,171 |
Udachnaya |
Karpinskogo Arkhangeskayapipe,184 |
KEM |
|||||
|
||||||||||||||||||||
0 |
|
|
|
|
|
|
|
|
|
|
|
|
|
|
|
|
|
|
|
|
*Priced as at 8 January 2019.
Source: Bloomberg, CRU, Renaissance Capital
40