

vk.com/id446425943
Peer comp charts
Renaissance Capital
14 January 2019
Metals & Mining
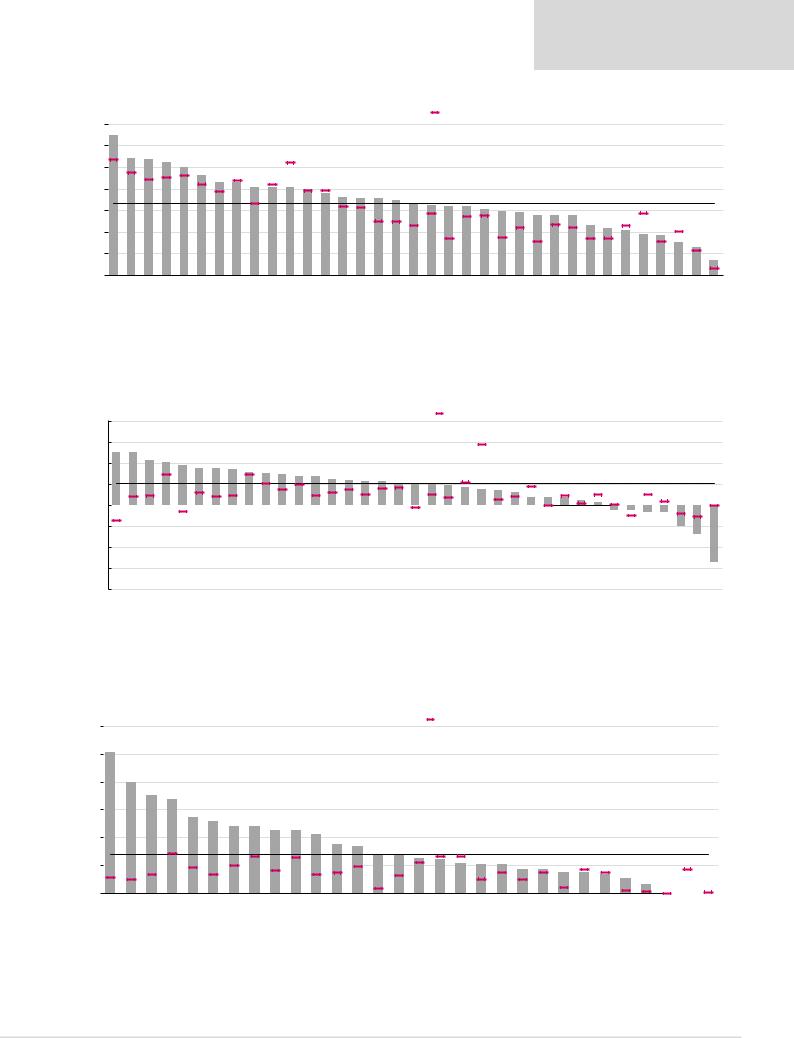
Figure 85: Companies ranked by CY18E EBITDA margins compared with their historical averages
70% |
|
65% |
|
|
|
||
60% |
|
54% |
54% |
50% |
|
|
|
40% |
|
|
|
30% |
|
|
|
20% |
|
|
|
10% |
|
|
|
0% |
|
Polyus BHP |
Alrosa |
|
|||
|
|
*Proportionately consolidated. **Excluding marketing business.
 CY18E EBITDA margins LT average
52% |
50% |
46% |
43% |
43% |
41% |
41% |
41% |
40% |
38% |
36% |
36% |
35% |
35% |
33% |
32% |
32% |
32% |
30% |
30% |
29% |
28% |
28% |
28% |
23% |
22% |
21% |
19% |
19% |
15% |
13% |
|
|
|
|
|
|
|
|
|
|
|
|
|
|
|
|
|
|
|
|
|
|
|
|
|
|
|
Sector average, 33% |
|
|
|||||
|
|
|
|
|
|
|
|
|
|
|
|
|
|
|
|
|
|
|
|
|
|
|
|
|
|
|
|
|
|
|
|
|
|
|
|
|
|
|
|
|
|
|
|
|
|
|
|
|
|
|
|
|
|
|
|
|
|
|
|
|
|
|
|
|
7% |
Norilsk |
Gold Fields |
Vale |
Rio Tinto |
Fortescue |
Russian* |
Polymetal |
Kumba |
Assore* |
AngloGold |
ARM* |
Exxaro* |
Severstal |
South32 |
Glencore** |
PhosAgro |
Evraz |
Anglo |
Others* |
Sasol |
NLMK |
Merafe |
Harmony |
MMK |
Mondi |
Amplats |
RBPlats |
Sibanye |
Northam |
Impala |
Sappi |
AMSA |
|
Source: Company data, Renaissance Capital estimates
Figure 86: Companies ranked by CY18E FCF yield compared with their historical averages
40% |
|
|
|
|
|
CY18E FCF yield |
LT average |
||
|
|
|
|
|
|||||
25.0% 25.0% 21.4% 20.2% 19.1% 17.5% 17.3% 16.9% 15.5% 15.1% 14.8% 13.9% 13.6% 12.2% 11.7% 11.4% 11.3% 10.3% 9.7% |
9.7% 9.7% 8.7% 7.6% 7.1% 6.0% 9%.3 9%.3 3.7% |
||||||||
10% |
|||||||||
30% |
|
|
|
|
|
|
|
|
|
20% |
|
|
|
|
|
|
|
|
|
0% |
|
|
|
|
|
|
|
|
|
|
|
|
|
|
|
|
|
||
|
|
|
|
|
|
|
|
||
-10%
-20%
-30%
-40%
Polymetal
PhosAgro
Glencore
Polyus
AngloGold
South32
Kumba
Others*
Anglo
Impala
Fortescue
Russian*
NLMK
Norilsk
Hulamin
Exxaro
MMK
Rio Tinto
Severstal
Evraz
Vale
BHP
Assore
Sibanye
Alrosa
ARM
Merafe
AMSA
Note: Priced at market close on 7 January 2019.
Figure 87: Miners ranked by CY18E dividend yield compared with their historical averages
30% |
|
25.3% |
|
|
|
|
|
|
|
|
|
|
|
|
|
CY18E Dividend yield |
LT average |
|
|
|
|
|||||||
|
|
|
|
|
|
|
|
|
|
|
|
|
|
|
|
|
|
|||||||||||
|
|
|
|
|
|
|
|
|
|
|
|
|
|
|
|
|
|
|||||||||||
|
|
|
|
|
|
|
|
|
|
|
|
|
|
|
|
|
|
|
|
|
|
|
|
|
|
|
||
25% |
|
|
19.9% |
17.6% |
16.9% |
13.6% |
12.9% |
12.0% |
12.0% |
11.4% |
11.3% |
10.7% |
|
|
|
|
|
|
|
|
|
|
|
|
|
|
||
20% |
|
|
8.8% |
8.4% |
7.0% |
6.8% |
6.3% |
6.2% |
5.4% |
5.2% |
5.2% |
4.4% |
4.2% |
3.9% |
||||||||||||||
|
|
|
|
|
|
|
|
|
|
|
|
|
|
|
|
|
|
|
|
|
|
|
|
|
|
|
|
|
15% |
|
|
|
|
|
|
|
|
|
|
|
|
|
|
|
|
|
|
|
|
|
|
|
|
|
|
|
|
10% |
|
|
|
|
|
|
|
|
|
|
|
|
|
|
|
|
|
|
|
|
|
|
|
|
|
|
|
|
5% |
|
|
|
|
|
|
|
|
|
|
|
|
|
|
|
|
|
|
|
|
|
|
|
|
|
|
|
|
|
|
|
|
|
|
|
|
|
|
|
|
|
|
|
|
|
|
|
|
|
|
|
|
|
|
|
|
|
0% |
|
Merafe |
Evraz |
Alrosa |
Severstal |
NLMK |
MMK |
Russian* |
Kumba |
BHP |
Norilsk |
ARM |
|
Assore |
Exxaro |
South32 |
Glencore |
Vale |
PhosAgro |
Polyus |
Others* |
Rio Tinto |
Anglo |
Polymetal |
Hulamin |
|||
|
|
|||||||||||||||||||||||||||
|
|
|
||||||||||||||||||||||||||
Note: Priced at market close on 7 January 2019.
2.5% |
1.2% |
Sector average, 10.2% |
||||
|
|
|
|
|
||
|
|
|
|
|
|
|
|
|
Sasol -2.3% |
3.1%- |
|
|
|
Amplats |
Mondi |
Northam 2.5%+- Sappi Gold Fields 3.4%- RBPlats -10.0% Lonmin -14.0% Harmony-27.0% |
||||
Source: Company data, Renaissance Capital estimates
3.8% |
3.4% |
|
Sector average, 7.0% |
||||
2.8% |
1.6% |
0.0% |
0.0% |
0.0% |
|||
Mondi |
|
|
|
|
|
|
|
Sasol |
Sappi |
Amplats |
RBPlats |
Sibanye |
AMSA |
||
Source: Company data, Renaissance Capital estimates
51

vk.com/id446425943
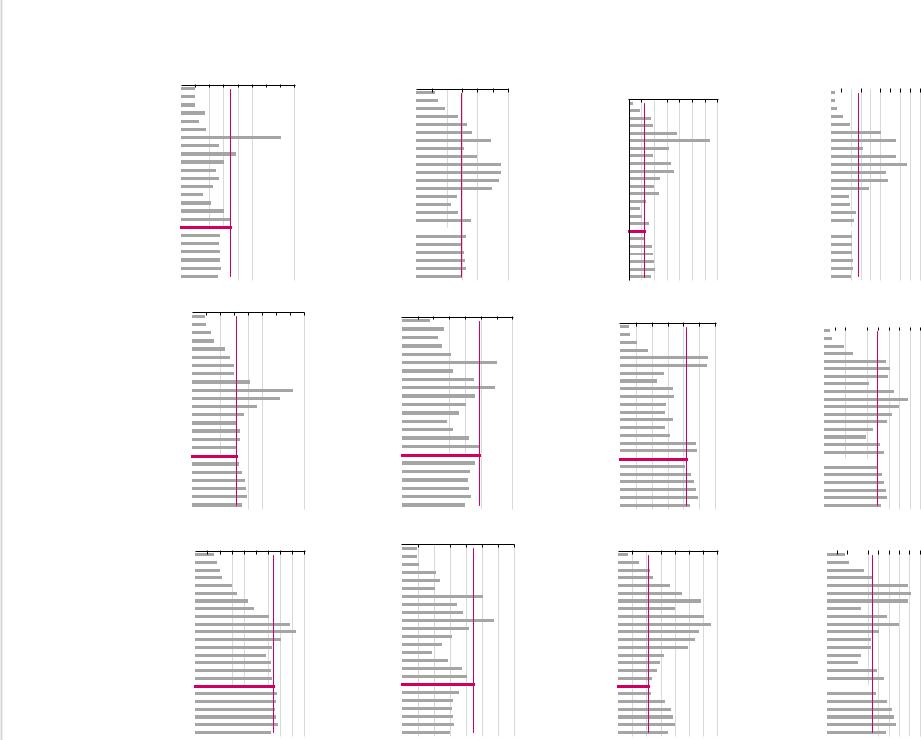
Commodity price and exchange rate forecasts
Figure 88 sets out our average commodity price and exchange rate forecasts per calendar year.
Renaissance Capital
14 January 2019
Metals & Mining
Figure 88: Average commodity prices and exchange rates*
Average per calendar year |
2016 |
2017 |
2018 |
2019E |
2020E |
2021E |
2022E |
2023E |
LT real |
Precious commodities |
|
|
|
|
|
|
|
|
|
Gold, $/oz |
1,248 |
1,258 |
1,269 |
1,350 |
1,338 |
1,311 |
1,337 |
1,364 |
1,250 |
Silver, $/oz |
17 |
17 |
16 |
17 |
18 |
19 |
19 |
20 |
18 |
Platinum, $/oz |
988 |
950 |
880 |
870 |
1,070 |
1,153 |
1,177 |
1,200 |
1,100 |
Palladium, $/oz |
614 |
871 |
1,030 |
1,216 |
1,088 |
1,049 |
1,070 |
1,091 |
1,000 |
Rhodium, $/oz |
694 |
1,108 |
2,218 |
2,379 |
2,163 |
2,097 |
2,139 |
2,182 |
2,000 |
3PGM basket (57% Pt, 36% Pd, 7% Rh), $/oz |
833 |
933 |
1,028 |
1,100 |
1,153 |
1,182 |
1,206 |
1,230 |
1,127 |
Rough diamond index, $/ct |
197 |
198 |
202 |
202 |
208 |
215 |
219 |
224 |
205 |
Base metals |
|
|
|
|
|
|
|
|
|
Aluminium, $/t |
1,604 |
1,968 |
2,110 |
1,953 |
2,166 |
2,254 |
2,300 |
2,346 |
2,150 |
Bauxite, $/t |
40 |
43 |
42 |
41 |
49 |
51 |
52 |
53 |
48 |
Copper, $/t |
4,867 |
6,170 |
6,532 |
6,000 |
6,367 |
6,606 |
6,739 |
6,875 |
6,300 |
Copper, USc/lb |
221 |
280 |
296 |
272 |
289 |
300 |
306 |
312 |
286 |
Nickel, $/t |
9,599 |
10,404 |
13,130 |
11,530 |
14,285 |
14,680 |
14,975 |
15,277 |
14,000 |
Nickel, USc/lb |
435 |
472 |
596 |
523 |
648 |
666 |
679 |
693 |
635 |
Zinc, $/t |
2,091 |
2,891 |
2,923 |
2,543 |
2,732 |
2,831 |
2,888 |
2,946 |
2,700 |
Zinc, USc/lb |
95 |
131 |
133 |
115 |
124 |
128 |
131 |
134 |
122 |
Lead, $/t |
1,867 |
2,314 |
2,241 |
2,033 |
2,459 |
2,548 |
2,599 |
2,652 |
2,430 |
Cobalt (99.8%), $/lb |
12 |
25 |
33 |
25 |
26 |
26 |
27 |
27 |
25 |
Steelmaking materials |
|
|
|
|
|
|
|
|
|
Iron ore fines (62% Fe, CIF China), $/t |
58 |
71 |
66 |
62 |
62 |
63 |
64 |
65 |
60 |
Iron ore fines (58% Fe, CIF China), $/t |
48 |
52 |
45 |
47 |
48 |
49 |
50 |
51 |
47 |
Iron ore lump premium (62% Fe), $/t |
10 |
15 |
20 |
17 |
13 |
14 |
14 |
14 |
13 |
Freight charges, $/t |
|
|
|
|
|
|
|
|
|
- Australia to China |
4.5 |
6.7 |
7.6 |
6.9 |
7.0 |
7.1 |
7.3 |
7.4 |
6.8 |
- Brazil to China |
9.1 |
14.8 |
18.4 |
16.8 |
17.0 |
17.2 |
17.6 |
17.9 |
16.4 |
- South Africa to China |
6.8 |
11.2 |
13.8 |
12.4 |
12.6 |
12.8 |
13.0 |
13.3 |
12.2 |
Hard coking coal - spot, $/t |
144 |
188 |
206 |
178 |
160 |
157 |
160 |
164 |
150 |
Manganese ore (44%, CIF China), $/mtu |
4.30 |
6.00 |
7.11 |
5.48 |
5.33 |
5.45 |
5.56 |
5.67 |
5.20 |
Ferrochrome (EU), $/lb |
1.0 |
1.5 |
1.4 |
1.2 |
1.3 |
1.3 |
1.3 |
1.4 |
1.3 |
Steel |
|
|
|
|
|
|
|
|
|
China HRC, $/t |
377 |
508 |
564 |
471 |
471 |
484 |
494 |
504 |
461 |
China export Rebar, $/t |
348 |
517 |
580 |
445 |
449 |
460 |
469 |
478 |
438 |
Energy |
|
|
|
|
|
|
|
|
|
Brent crude oil, $/bl |
45 |
55 |
72 |
65 |
60 |
63 |
64 |
65 |
60 |
WTI oil, $/bl |
43 |
51 |
65 |
62 |
57 |
60 |
61 |
62 |
57 |
Henry Hub (US) gas, $/MMBtu |
2.5 |
3.0 |
3.2 |
3.4 |
3.5 |
4.2 |
4.3 |
4.4 |
4 |
Thermal coal (FOB Richard's Bay), $/t |
64 |
85 |
98 |
93 |
86 |
84 |
86 |
87 |
80 |
Uranium, $/lb |
26 |
22 |
25 |
33 |
43 |
47 |
48 |
49 |
45 |
Chemicals |
|
|
|
|
|
|
|
|
|
Ethane (US), $/t |
146 |
184 |
244 |
260 |
374 |
419 |
428 |
436 |
400 |
Ethylene (US), $/t |
585 |
613 |
402 |
548 |
831 |
944 |
963 |
982 |
900 |
Paper & packaging |
|
|
|
|
|
|
|
|
|
Testliner, EUR/t |
432 |
476 |
534 |
532 |
507 |
494 |
499 |
504 |
482 |
Uncoated fine paper, EUR/t |
824 |
815 |
869 |
898 |
873 |
860 |
869 |
878 |
840 |
Fertilisers |
|
|
|
|
|
|
|
|
|
MOP Potash Soluble FOB Saskatchewan, $/t |
228 |
230 |
261 |
289 |
283 |
283 |
289 |
295 |
270 |
Baltic sea Urea granular, $/t |
202 |
220 |
251 |
263 |
269 |
273 |
278 |
284 |
260 |
Baltic DAP, $/t |
357 |
358 |
421 |
434 |
429 |
430 |
439 |
447 |
410 |
Black sea 16-16-16, $/t |
324 |
321 |
318 |
340 |
347 |
353 |
360 |
367 |
337 |
Currency exchange rates |
|
|
|
|
|
|
|
|
|
ZAR/$ |
14.70 |
13.31 |
13.24 |
14.31 |
14.14 |
14.17 |
14.45 |
14.74 |
13.00 |
$/AUD |
0.74 |
0.77 |
0.75 |
0.72 |
0.78 |
0.80 |
0.80 |
0.80 |
0.80 |
$/EUR |
1.11 |
1.13 |
1.18 |
1.17 |
1.21 |
1.22 |
1.22 |
1.22 |
1.20 |
CLP/$ |
676 |
649 |
642 |
689 |
674 |
673 |
687 |
701 |
630 |
BRL/$ |
3.49 |
3.19 |
3.65 |
3.78 |
3.50 |
3.42 |
3.49 |
3.56 |
3.20 |
COP/$ |
3,053 |
2,952 |
2,956 |
3,193 |
3,031 |
3,015 |
3,138 |
3,265 |
2,800 |
RUB/$ |
67 |
58 |
63 |
67 |
68 |
67 |
66 |
66 |
58 |
Inflation |
|
|
|
|
|
|
|
|
|
US consumer price index |
240 |
245 |
251 |
256 |
261 |
266 |
272 |
277 |
|
US inflation |
1.3% |
2.1% |
2.5% |
2.0% |
2.0% |
2.0% |
2.0% |
2.0% |
|
*The above amounts represent the average per calendar year.
Source: Bloomberg, Thomson Reuters Datastream, Renaissance Capital estimates
52
53
estimates Capital Renaissance CRU, Bloomberg, Source:
|
|
|
|
2 0 |
||||
Spot |
2002 |
|
|
|
|
|||
|
|
|
|
|||||
2003 (-0%) |
|
|
|
|
||||
(7 |
2004 (-0%) |
|
|
|
|
|||
2005 (+67%) |
|
|
|
|
||||
January), |
|
|
|
|
||||
2006 (-22%) |
|
|
|
|
||||
|
2007 (+36%) |
|
|
|
|
|||
|
2008 (+299%) |
|
|
|
|
|||
7 |
2009 (-61%) |
|
|
|
|
|||
2010 (+42%) |
|
|
|
|
||||
|
|
|
|
|
||||
|
2011 (-21%) |
|
|
|
|
|||
|
2012 (-19%) |
|
|
|
|
|||
|
2013 (+10%) |
|
|
|
|
|||
|
2014 (-17%) |
|
|
|
|
|||
|
2015 (-31%) |
|
|
|
|
|||
|
2016 (+38%) |
|
|
|
|
|||
|
2017 (+40%) |
|
|
|
|
|||
|
2018 (+18%) |
|
|
|
|
|||
|
|
Spot |
|
|
|
|
||
|
|
|
||||||
2019E (26% upside) |
|
|
|
|
||||
2020E (29% upside) |
|
|
|
|
||||
2021E (26% upside) |
|
|
|
|
||||
2022E (24% upside) |
|
|
|
|
||||
2023E (21% upside) |
|
|
|
|
||||
LT real (32% upside) |
|
|
|
|
||||
|
|
|
|
0 |
||||
Spot |
|
|
|
2002 |
|
|
|
|
|
|
|
|
|
|
|||
(7 |
2003 (+8%) |
|
|
|
||||
January), |
2004 (+36%) |
|
|
|
||||
2005 (+13%) |
|
|
|
|||||
|
2006 (+54%) |
|
|
|
||||
|
2007 (+16%) |
|
|
|
||||
.15 |
2008 |
(+11%) |
|
|
|
|||
2009 (-2%) |
|
|
|
|||||
6 |
2010 (+40%) |
|
|
|
||||
|
|
|
|
|||||
|
2011 (+74%) |
|
|
|
||||
|
2012 (-12%) |
|
|
|
||||
|
2013 (-26%) |
|
|
|
||||
|
2014 (-21%) |
|
|
|
||||
|
2015 (-15%) |
|
|
|
||||
|
2016 (+9%) |
|
|
|
||||
|
2017 |
(-0%) |
|
|
|
|||
|
2018 |
(-8%) |
|
|
|
|||
|
|
|
|
Spot |
|
|
||
2019E (6% downside) |
|
|
||||||
2020E (12% downside) |
|
|
||||||
2021E (17% downside) |
|
|
||||||
2022E (19% downside) |
|
|
||||||
2023E (20% downside) |
|
|
||||||
LT real (13% downside) |
|
|
||||||
Spot |
|
|
|
0 |
||||
(7 |
|
|
|
2002 |
|
|
|
|
|
|
|
|
|
|
|||
January), |
2003 (+17%) |
|
|
|
||||
2004 (+13%) |
|
|
|
|||||
|
2005 (+9%) |
|
|
|
||||
|
2006 |
(+36%) |
|
|
|
|||
1,281 |
2007 (+15%) |
|
|
|
||||
2008 (+25%) |
|
|
|
|||||
|
2009 (+12%) |
|
|
|
||||
|
2010 (+26%) |
|
|
|
||||
|
2011 |
(+28%) |
|
|
|
|||
|
2012 (+6%) |
|
|
|
||||
|
2013 (-15%) |
|
|
|
||||
|
2014 (-10%) |
|
|
|
||||
|
2015 (-8%) |
|
|
|
||||
|
2016 (+8%) |
|
|
|
||||
|
2017 (+1%) |
|
|
|
||||
|
2018 (+1%) |
|
|
|
||||
|
|
|
|
Spot |
|
|||
2019E (5% downside) |
|
|||||||
2020E (4% downside) |
|
|||||||
2021E (2% downside) |
|
|||||||
2022E (4% downside) |
|
|||||||
2023E (6% downside) |
|
|||||||
LT real (2% upside) |
|
|||||||
|
|
|
|
|
|
|
|
|
4 |
6 |
8 |
10 |
|
12 |
|
14 |
16 |
|
|
Manganese |
||||||||||||||||
2.0 |
|
|
|
|
|
|
|
|
|
|
|
|
|
|
|
|
|
|
|
|
|
|
|
|
|
||
|
|
|
|
|
|
|
|
|
|
|
|
|
|
|
|
|
|
|
|
|
|
|
|
|
|||
2.0 |
|
|
|
|
|
|
|
|
|
|
|
|
|
|
|
|
|
|
|
|
|
|
|
|
|
||
2.0 |
|
|
|
|
|
|
|
|
|
|
|
|
|
|
|
|
|
|
|
|
|
|
|
|
|
||
3.3 |
|
|
|
|
|
|
|
|
|
|
|
|
|
|
|
|
|
|
|
|
|
|
ore |
||||
2.6 |
|
|
|
|
|
|
|
|
|
|
|
|
|
|
|
|
|
|
|
|
|
|
|
||||
|
|
3.5 |
|
|
|
|
|
|
|
|
|
|
|
|
|
|
|
|
14.1 |
|
(44%, |
||||||
|
|
|
|
|
|
5.4 |
|
|
|
|
|
|
|
|
|
|
|
|
|
||||||||
|
|
|
|
|
|
|
|
7.7 |
|
|
|
|
|
|
|
|
|
|
|
|
|
|
|
CIF |
|||
|
|
|
|
|
|
|
6.1 |
|
|
|
|
|
|
|
|
|
|
|
|
|
|
|
|
||||
3.1 |
|
|
|
|
|
|
|
|
|
|
|
|
|
|
|
|
|
|
China), |
||||||||
4.5 |
|
|
|
|
|
|
|
|
|
|
|
|
|
|
|
|
|
|
|
||||||||
|
|
|
|
|
4.9 |
|
|
|
|
|
|
|
|
|
|
|
|
|
|
|
|
|
|
|
|
||
|
|
|
|
|
|
5.4 |
|
|
|
|
|
|
|
|
|
|
|
|
|
|
|
|
|
|
$/mtu |
||
|
|
|
4.3 |
|
|
|
|
|
|
|
|
|
|
|
|
|
|
|
|
|
|
|
|||||
|
|
|
|
|
|
|
6.0 |
|
|
|
|
|
|
|
|
|
|
|
|
|
|
|
|
|
|||
|
|
|
|
|
|
|
7.1 |
|
|
|
|
|
|
|
|
|
|
|
|
|
|
|
|
||||
|
|
|
|
|
|
5.56.9 |
|
|
|
|
|
|
|
|
|
|
|
|
|
|
|
|
|||||
|
|
|
|
|
|
|
|
|
|
|
|
|
|
|
|
|
|
|
|
|
|
||||||
|
|
|
|
|
|
5.3 |
|
|
|
|
|
|
|
|
|
|
|
|
|
|
|
|
|
|
|
||
|
|
|
|
|
|
5.5 |
|
|
|
|
|
|
|
|
|
|
|
|
|
|
|
|
|
|
|||
|
|
|
|
|
|
5.6 |
|
|
|
|
|
|
|
|
|
|
|
|
|
|
|
|
|
|
|||
|
|
|
|
|
|
|
5.7 |
|
|
|
|
|
|
|
|
|
|
|
|
|
|
|
|
|
|
||
|
|
|
|
|
|
5.2 |
|
|
|
|
|
|
|
|
|
|
|
|
|
|
|
|
|
|
|
||
5 |
|
10 |
|
15 |
|
20 |
|
25 |
|
30 |
35 |
|
40 |
Silver, |
|||||||||||||
5 |
|
|
|
|
|
|
|
|
|
||||||||||||||||||
|
|
|
|
|
|
|
|
|
|
|
|
|
|
|
|
|
|
|
|
|
|
|
|
|
|||
|
|
5 |
7 |
|
|
|
|
|
|
|
|
|
|
|
|
|
|
|
|
|
|
|
|
|
|
$/oz |
|
|
|
|
|
8 |
|
|
12 |
|
|
|
|
|
|
|
|
|
|
|
|
|
|
|
|
|
|||
|
|
|
|
|
|
|
|
|
|
|
|
|
|
|
|
|
|
|
|
|
|
|
|
|
|||
|
|
|
|
|
|
|
|
14 |
|
|
|
|
|
|
|
|
|
|
|
|
|
|
|
|
|||
|
|
|
|
|
|
|
|
|
|
15 |
|
|
|
|
|
|
|
|
|
|
|
|
|
|
|
|
|
|
|
|
|
|
|
|
|
|
|
15 |
21 |
|
|
|
|
|
|
|
|
|
|
|
|
||||
|
|
|
|
|
|
|
|
|
|
|
|
|
|
|
|
|
|
|
|
|
36 |
|
|||||
|
|
|
|
|
|
|
|
|
|
|
|
|
|
|
23 |
|
|
|
32 |
|
|
||||||
|
|
|
|
|
|
|
|
|
|
|
19 |
|
|
|
|
|
|
|
|
|
|||||||
|
|
|
|
|
|
|
|
|
|
|
16 |
|
|
|
|
|
|
|
|
|
|
|
|
|
|
|
|
|
|
|
|
|
|
|
|
|
|
|
17 |
|
|
|
|
|
|
|
|
|
|
|
|
|
|
||
|
|
|
|
|
|
|
|
|
|
|
17 |
|
|
|
|
|
|
|
|
|
|
|
|
|
|
||
|
|
|
|
|
|
|
|
|
|
|
16 |
|
|
|
|
|
|
|
|
|
|
|
|
|
|
|
|
|
|
|
|
|
|
|
|
|
|
|
16 |
|
|
|
|
|
|
|
|
|
|
|
|
|
|
|
|
|
|
|
|
|
|
|
|
|
|
|
|
|
|
|
|
|
|
|
|
|
|
|
|
|
|
|
|
|
|
|
|
|
|
|
|
|
|
|
17 |
|
|
|
|
|
|
|
|
|
|
|
|
|
|
|
|
|
|
|
|
|
|
|
|
|
|
|
18 |
|
|
|
|
|
|
|
|
|
|
|
|
|
|
||
|
|
|
|
|
|
|
|
|
|
|
|
19 |
|
|
|
|
|
|
|
|
|
|
|
|
|
||
|
|
|
|
|
|
|
|
|
|
|
|
19 |
|
|
|
|
|
|
|
|
|
|
|
|
|
||
|
|
|
|
|
|
|
|
|
|
|
|
20 |
|
|
|
|
|
|
|
|
|
|
|
|
|||
|
|
|
|
|
|
|
|
|
|
|
18 |
|
|
|
|
|
|
|
|
|
|
|
|
|
|
||
200 |
|
400 |
600 |
|
800 |
1,000 |
1,200 |
1,400 |
1,600 |
1,800 |
|||||||||||||||||
|
|
|
|
Gold, |
|||||||||||||||||||||||
|
|
|
|
310 |
|
|
|
|
|
|
|
|
|
|
|
|
|
|
|
|
|
|
|
$/oz |
|||
|
|
|
|
|
|
|
|
|
|
|
|
|
|
|
|
|
|
|
|
|
|
|
|
||||
|
|
|
|
364 |
|
|
|
|
|
|
|
|
|
|
|
|
|
|
|
|
|
|
|
||||
|
|
|
|
|
|
409 |
|
|
|
|
|
|
|
|
|
|
|
|
|
|
|
|
|
||||
|
|
|
|
|
|
|
445 |
|
|
|
|
|
|
|
|
|
|
|
|
|
|
|
|
|
|||
|
|
|
|
|
|
|
|
|
|
604 |
|
|
|
|
|
|
|
|
|
|
|
|
|
|
|
|
|
|
|
|
|
|
|
|
|
|
|
|
697 |
872 |
|
|
|
|
|
|
|
|
|
|
|
|
|||
|
|
|
|
|
|
|
|
|
|
|
|
|
|
|
|
|
|
|
|
|
|
|
|
|
|||
|
|
|
|
|
|
|
|
|
|
|
|
|
|
|
973 |
1,225 |
|
1,571 |
|||||||||
|
|
|
|
|
|
|
|
|
|
|
|
|
|
|
|
|
|
|
|
|
|
|
|
||||
|
|
|
|
|
|
|
|
|
|
|
|
|
|
|
|
|
|
|
|
|
|
|
|
1,668 |
|||
|
|
|
|
|
|
|
|
|
|
|
|
|
|
|
|
|
|
|
|
|
|
1,413 |
|
||||
|
|
|
|
|
|
|
|
|
|
|
|
|
|
|
|
|
|
|
1,266 |
|
|
|
|||||
|
|
|
|
|
|
|
|
|
|
|
|
|
|
|
|
|
|
1,160 |
|
|
|
|
|
||||
|
|
|
|
|
|
|
|
|
|
|
|
|
|
|
|
|
|
1,248 |
|
|
|
||||||
|
|
|
|
|
|
|
|
|
|
|
|
|
|
|
|
|
|
1,258 |
|
|
|
||||||
|
|
|
|
|
|
|
|
|
|
|
|
|
|
|
|
|
|
1,269 |
|
|
|
||||||
|
|
|
|
|
|
|
|
|
|
|
|
|
|
|
|
|
|
1,281 |
|
|
|
||||||
|
|
|
|
|
|
|
|
|
|
|
|
|
|
|
|
|
|
|
|
|
|||||||
|
|
|
|
|
|
|
|
|
|
|
|
|
|
|
|
|
|
1,350 |
|
||||||||
|
|
|
|
|
|
|
|
|
|
|
|
|
|
|
|
|
|
1,338 |
|
|
|||||||
|
|
|
|
|
|
|
|
|
|
|
|
|
|
|
|
|
|
1,311 |
|
|
|||||||
|
|
|
|
|
|
|
|
|
|
|
|
|
|
|
|
|
|
1,337 |
|
|
|||||||
|
|
|
|
|
|
|
|
|
|
|
|
|
|
|
|
|
|
|
|
|
1,364 |
|
|||||
|
|
|
|
|
|
|
|
|
|
|
|
|
|
|
|
|
|
1,250 |
|
|
|
||||||
|
|
|
|
|
|
|
|
|
|
|
|
|
|
|
|
|
|
|
|
|
|
|
|
|
|
|
|
Spot |
|
|
2002 |
|||
(7 |
2003 (+14%) |
|||||
2004 (+33%) |
||||||
January), |
||||||
2008 (+35%) |
||||||
|
2005 (+45%) |
|||||
|
2006 (+20%) |
|||||
|
2007 |
(+10%) |
||||
58 |
2009 (-37%) |
|||||
2010 (+29%) |
||||||
|
||||||
|
2011 (+39%) |
|||||
|
2012 (+1%) |
|||||
|
|
2013 (-3%) |
||||
|
|
2014 (-8%) |
||||
|
2015 (-46%) |
|||||
|
2016 (-16%) |
|||||
|
2017 (+21%) |
|||||
|
2018 (+31%) |
|||||
|
|
|
Spot |
|||
2019E (11% downside) |
||||||
2020E (3% downside) |
||||||
2021E (8% downside) |
||||||
2022E (9% downside) |
||||||
2023E (11% downside) |
||||||
LT real (3% downside) |
||||||
Spot |
|
|
0 |
|||
|
2003 |
|
|
|||
|
|
|
|
|||
(7 |
2004 (+52%) |
|
|
|||
2005 (-15%) |
|
|
||||
January), |
|
|
||||
2006 (+11%) |
|
|
||||
|
2007 |
(+24%) |
|
|
||
|
2008 (+93%) |
|
|
|||
|
2009 (-46%) |
|
|
|||
98 |
2010 (+42%) |
|
|
|||
|
2011 (+28%) |
|
|
|||
|
2012 (-21%) |
|
|
|||
|
2013 (-13%) |
|
|
|||
|
2014 |
(-11%) |
|
|
||
|
2015 (-22%) |
|
|
|||
|
2016 (+14%) |
|
|
|||
|
2017 |
(+31%) |
|
|
||
|
2018 (+16%) |
|
|
|||
|
|
Spot |
|
|||
2019E (5% upside) |
|
|||||
2020E (14% upside) |
|
|||||
2021E (16% upside) |
|
|||||
2022E (14% upside) |
|
|||||
2023E (12% upside) |
|
|||||
LT real (22% upside) |
|
|||||
Spot |
|
|
0 |
|||
|
2002 |
|
|
|||
|
|
|
|
|||
|
2003 (-3%) |
|
|
|||
(7 |
2004 (+16%) |
|
|
|||
January), |
2005 (+99%) |
|
|
|||
2008 (+147%) |
|
|
||||
|
2006 (+9%) |
|
|
|||
|
2007 (-13%) |
|
|
|||
222 |
2009 (-32%) |
|
|
|||
2010 (+11%) |
|
|
||||
|
2011 (+52%) |
|
|
|||
|
2012 (-27%) |
|
|
|||
|
2013 (-25%) |
|
|
|||
|
2014 (-21%) |
|
|
|||
|
2015 (-25%) |
|
|
|||
|
2016 (+52%) |
|
|
|||
|
2017 (+30%) |
|
|
|||
|
2018 (+10%) |
|
|
|||
|
|
Spot |
|
|
||
2019E (25% upside) |
|
|
||||
2020E (39% upside) |
|
|
||||
2021E (41% upside) |
|
|
||||
2022E (38% upside) |
|
|
||||
2023E (36% upside) |
|
|
||||
LT real (48% upside) |
|
|
||||
|
|
|
|
|
|
|
0 |
20 |
|
40 |
60 |
80 |
|
100 |
Brent 120 |
||||||||||||
|
|
|
|
|
25 |
|
|
|
|
|
|
|
|
|
|
|
|
|
,oil |
|
|
|
|
|
|
28 |
|
|
|
|
|
|
|
|
|
|
|
|
|
||
|
|
|
|
|
38 |
55 |
66 |
|
|
|
|
|
|
$/bl |
||||||
|
|
|
|
|
|
|
|
|
|
|
|
|
|
|
|
|
|
|||
|
|
|
|
|
|
|
|
|
|
|
73 |
|
98 |
|
|
|||||
|
|
|
|
|
|
|
|
|
|
62 |
|
|
|
|
|
|||||
|
|
|
|
|
|
|
|
|
|
|
80 |
|
|
|
111 |
|||||
|
|
|
|
|
|
|
|
|
|
|
|
|
|
|
|
|
|
|
||
|
|
|
|
|
|
|
|
|
|
|
|
|
|
|
|
|
|
|
112 |
|
|
|
|
|
|
|
|
|
|
|
|
|
|
|
|
|
|
|
|
109 |
|
|
|
|
|
|
|
|
|
|
54 |
|
|
|
|
|
100 |
|||||
|
|
|
|
|
|
|
|
|
|
|
|
|
|
|
|
|
|
|
||
|
|
|
|
|
|
|
4555 |
72 |
|
|
|
|
|
|
||||||
|
|
|
|
|
|
|
|
|
58 |
|
|
|
|
|
|
|
|
|
||
|
|
|
|
|
|
|
|
|
|
65 |
|
|
|
|
|
|
|
|||
|
|
|
|
|
|
|
|
|
60 |
|
|
|
|
|
|
|
|
|||
|
|
|
|
|
|
|
|
|
|
63 |
|
|
|
|
|
|
|
|
||
|
|
|
|
|
|
|
|
|
|
64 |
|
|
|
|
|
|
|
|||
|
|
|
|
|
|
|
|
|
|
65 |
|
|
|
|
|
|
|
|||
|
|
|
|
|
|
|
|
|
60 |
|
|
|
|
|
|
|
|
|||
|
|
40 |
60 |
|
|
|
|
100 |
120 |
140 |
||||||||||
20 |
4 |
|
35 |
|
80 |
|
|
|
Thermal |
|||||||||||
|
|
|
|
|
54 |
|
|
|
|
|
|
|
|
|
|
|
|
$/tcoal, |
||
|
|
|
|
|
|
51 |
63 |
|
|
|
|
|
|
|
|
|
|
|||
|
|
|
|
|
45 |
|
|
|
|
|
|
|
|
|
|
|
|
|
|
|
|
|
|
|
|
|
|
65 |
|
|
|
|
|
|
|
|
120 |
||||
|
|
|
|
|
|
|
|
|
|
92 |
|
|
|
|
|
|||||
|
|
|
|
|
|
|
|
|
|
|
|
|
118 |
|||||||
|
|
|
|
|
|
|
|
|
|
|
|
|
|
|
|
|||||
|
|
|
|
|
|
|
|
|
|
81 |
93 |
|
|
|
|
|
||||
|
|
|
|
|
57 |
72 |
|
|
|
|
|
|
|
|
|
|||||
|
|
|
|
|
|
|
64 |
|
85 98 |
|
|
|
|
|||||||
|
|
|
|
|
|
|
|
|
|
|
|
|
|
|
||||||
|
|
|
|
|
|
|
|
|
|
|
|
|
|
98 |
|
|
|
|
||
|
|
|
|
|
|
|
|
|
|
|
|
|
|
|
|
|
||||
|
|
|
|
|
|
|
|
|
|
|
93 |
|
|
|
|
|
||||
|
|
|
|
|
|
|
|
|
|
|
86 |
|
|
|
|
|
|
|||
|
|
|
|
|
|
|
|
|
|
|
84 |
|
|
|
|
|
|
|
||
|
|
|
|
|
|
|
|
|
|
|
86 |
|
|
|
|
|
|
|||
|
|
|
|
|
|
|
|
|
|
|
87 |
|
|
|
|
|
|
|||
|
|
|
|
|
|
|
|
|
|
80 |
|
|
|
|
|
|
|
|||
|
|
100 |
150 |
200 |
|
250 |
300 |
350 |
||||||||||||
50 |
8 |
|
|
|
|
|
Hard |
|||||||||||||
|
|
54 |
|
|
|
|
|
|
|
|
|
|
|
|
|
|
|
|
coking |
|
|
|
47 |
|
|
|
|
|
|
|
|
|
|
|
|
|
|
|
|
|
|
|
|
|
|
|
108 |
|
|
|
|
|
|
|
|
|
|
|
|
|
coal, |
|
|
|
|
|
|
118 |
|
|
|
|
|
|
|
|
|
|
|
|
|||
|
|
|
|
|
103 |
|
|
|
|
|
|
|
|
253 |
|
|
|
|||
|
|
|
|
|
|
|
|
|
172 |
|
|
|
|
|
$/t |
|||||
|
|
|
|
|
|
|
|
|
|
|
|
|
|
|
|
|
|
|||
|
|
|
|
|
|
|
|
|
191 |
|
289 |
|||||||||
|
|
|
|
|
|
|
|
|
|
|
|
|
|
|
||||||
|
|
|
|
|
|
|
159 211 |
|
|
|
|
|
||||||||
|
|
|
|
|
95 126 |
|
|
|
|
|
|
|
|
|
|
|
|
|||
144188
206
222
178
160
157
160
164
150
Spot |
|
|
|
|
2002 |
|||
(7 |
|
|
|
|
||||
2003 (+42%) |
||||||||
January), |
||||||||
2007 (+54%) |
||||||||
|
2004 (+44%) |
|||||||
|
2005 |
(+7%) |
||||||
|
2006 |
(+64%) |
||||||
11,081 |
2008 (-43%) |
|||||||
2009 (-31%) |
||||||||
|
2010 (+49%) |
|||||||
|
2011 (+5%) |
|||||||
|
2012 (-23%) |
|||||||
|
2013 (-14%) |
|||||||
|
2014 (+12%) |
|||||||
|
2015 (-30%) |
|||||||
|
2016 (-19%) |
|||||||
|
2017 (+8%) |
|||||||
|
2018 (+26%) |
|||||||
|
|
|
|
|
Spot |
|||
2019E (4% downside) |
||||||||
2020E (22% downside) |
||||||||
2021E (25% downside) |
||||||||
2022E (26% downside) |
||||||||
2023E (27% downside) |
||||||||
LT real (21% downside) |
||||||||
Spot |
|
|
|
|
500 |
|||
(7 |
|
|
|
2002 |
|
|
||
2003 (+6%) |
|
|
||||||
January), |
|
|
||||||
2007 (-1%) |
|
|
||||||
|
2004 (+27%) |
|
|
|||||
|
2005 (+32%) |
|
|
|||||
|
2006 (+137%) |
|
|
|||||
2,575 |
2008 (-42%) |
|
|
|||||
2009 (-12%) |
|
|
||||||
|
2010 (+31%) |
|
|
|||||
|
2011 (+1%) |
|
|
|||||
|
2012 (-11%) |
|
|
|||||
|
2013 (-2%) |
|
|
|||||
|
2014 (+13%) |
|
|
|||||
|
2015 (-11%) |
|
|
|||||
|
2016 (+8%) |
|
|
|||||
|
2017 (+38%) |
|
|
|||||
|
2018 (+1%) |
|
|
|||||
|
|
|
|
Spot |
|
|||
2019E (1% upside) |
|
|||||||
2020E (6% downside) |
|
|||||||
2021E (9% downside) |
|
|||||||
2022E (11% downside) |
|
|||||||
2023E (13% downside) |
|
|||||||
LT real (5% downside) |
|
|||||||
Spot |
|
|
|
|
400 |
|||
(7 |
|
|
2002 |
|
|
|||
2003 (+28%) |
|
|
||||||
January), |
|
|
||||||
2007 (+14%) |
|
|
||||||
|
2004 (+22%) |
|
|
|||||
|
2005 (+6%) |
|
|
|||||
|
2006 |
(+27%) |
|
|
||||
821 |
2008 (+21%) |
|
|
|||||
2009 (-23%) |
|
|
||||||
|
2010 (+34%) |
|
|
|||||
|
2011 |
(+7%) |
|
|
||||
|
2012 (-10%) |
|
|
|||||
|
2013 (-4%) |
|
|
|||||
|
2014 (-7%) |
|
|
|||||
|
2015 (-24%) |
|
|
|||||
|
2016 (-6%) |
|
|
|||||
|
2017 (-4%) |
|
|
|||||
|
2018 (-7%) |
|
|
|||||
|
|
|
|
Spot |
|
|||
2019E (6% downside) |
|
|||||||
2020E (23% downside) |
|
|||||||
2021E (29% downside) |
|
|||||||
2022E (30% downside) |
|
|||||||
2023E (32% downside) |
|
|||||||
LT real (25% downside) |
|
|||||||
|
|
|
|
|
|
|
|
|
5,000 |
10,000 |
|
15,000 |
20,000 |
25,000 |
30,000 |
35,000 |
40,000 |
Nickel, |
|||
|
6 |
|
|
|
|
|
|
$/t |
||||
|
,778 |
|
|
|
|
|
|
|
||||
|
|
9,635 |
|
|
|
|
|
|
|
|||
5 |
|
|
|
|
|
|
|
|
|
|
||
40 |
|
13,834 |
|
|
|
|
|
|
||||
|
|
|
|
|
14,74124,249 |
37,229 |
||||||
|
|
|
|
|
|
21,115 |
|
|
|
|||
|
|
|
|
|
14,653 |
|
|
|
|
|
|
|
|
|
|
|
|
|
21,833 |
|
|
|
|||
|
|
|
|
|
|
22,842 |
|
|
|
|||
|
|
|
|
|
17,525 |
|
|
|
|
|
||
|
|
|
|
|
15,033 |
|
|
|
|
|
|
|
|
|
|
|
|
16,868 |
|
|
|
|
|
||
|
|
|
|
11,864 |
|
|
|
|
|
|
||
|
|
9,599 |
|
|
|
|
|
|
|
|||
|
|
|
10,404 |
|
|
|
|
|
|
|
||
|
|
|
|
13,130 |
|
|
|
|
|
|
||
|
|
|
|
11,081 |
|
|
|
|
|
|
|
|
|
|
|
|
11,530 |
|
|
|
|
|
|
||
|
|
|
|
|
14,285 |
|
|
|
|
|
|
|
|
|
|
|
|
14,680 |
|
|
|
|
|
|
|
|
|
|
|
|
14,975 |
|
|
|
|
|
|
|
|
|
|
|
|
15,277 |
|
|
|
|
|
||
|
|
|
|
|
14,000 |
|
|
|
|
|
|
|
1,000 |
1,500 |
2,000 |
2,500 |
3,000 |
|
3,500 |
Zinc, |
|||||
778 |
|
|
|
|
|
|
|
|
|
$/t |
||
|
828 |
|
|
|
|
|
|
|
|
|
||
|
1,048 |
|
|
|
|
|
|
|
||||
|
|
|
|
1,380 |
|
|
|
|
|
3,275 |
||
|
|
|
|
|
|
|
|
|
|
|
||
|
|
|
|
|
1,876 |
|
|
|
3,243 |
|||
|
|
|
|
|
|
|
|
|
|
|||
|
|
|
|
|
1,654 |
|
|
|
|
|
|
|
|
|
|
|
|
|
2,160 |
|
|
|
|
||
|
|
|
|
|
|
2,190 |
|
|
|
|||
|
|
|
|
|
1,947 |
|
|
|
|
|
||
|
|
|
|
|
1,909 |
|
|
|
|
|
||
|
|
|
|
|
|
2,162 |
|
|
|
|
||
|
|
|
|
|
1,932 |
|
|
|
|
|
||
|
|
|
|
|
|
2,091 |
2,891 |
|
||||
|
|
|
|
|
|
|
|
|
2,923 |
|
||
|
|
|
|
|
|
|
|
2,575 |
|
|||
|
|
|
|
|
|
|
|
2,543 |
|
|||
|
|
|
|
|
|
|
|
2,732 |
|
|||
|
|
|
|
|
|
|
|
|
2,831 |
|
||
|
|
|
|
|
|
|
|
|
2,888 |
|
||
|
|
|
|
|
|
|
|
|
2,946 |
|
||
|
|
|
|
|
|
|
|
2,700 |
Platinum, |
|||
600 |
800 |
1,200 1,000 |
1,400 |
1,600 |
|
1,800 |
||||||
|
691 |
|
|
|
|
|
|
|
$/oz |
|||
|
|
|
|
845 |
|
|
|
|
|
|
||
|
|
|
|
|
897 |
1,139 |
|
|
|
|
||
|
|
|
|
|
|
|
1,3021,572 |
|||||
|
|
|
|
|
|
1,203 |
|
1,612 |
||||
|
|
|
|
|
|
|
|
|
|
|
||
|
|
|
|
|
|
|
|
|
|
|
1,720 |
|
|
|
|
|
|
|
|
|
|
1,551 |
|||
|
|
|
|
|
|
|
|
|
1,488 |
|
||
|
|
|
|
|
1,056 |
1,385 |
|
|||||
|
|
|
|
|
988 |
|
|
|
|
|
|
|
|
|
|
|
|
950 |
|
|
|
|
|
|
|
|
|
|
|
|
880 |
|
|
|
|
|
|
|
|
|
|
|
821 |
|
|
|
|
|
|
|
|
|
|
|
|
|
870 1,070 |
|
|
|
|
|
||
|
|
|
|
|
|
1,153 |
|
|
|
|
||
|
|
|
|
|
|
1,177 |
|
|
|
|||
|
|
|
|
|
|
1,200 |
|
|
|
|||
|
|
|
|
|
|
1,100 |
|
|
|
|
||
|
|
|
|
|
|
|
|
|
|
350 |
|
|
|
|
|
|
|
|
|
|
|
|
|
|
||||||
|
|
|
|
|
|
8 |
, |
|
|
|
|
|
|
|
|
|
|
|
|
|
|
|||||||||
(7 Spot |
|
20 |
60 40 |
|
200 180 160 140 120 100 80 |
ore Iron |
||||||||||||||||||||||||
|
|
2002 |
|
|
2 |
|
|
|
|
|
|
|
|
|
|
|
|
|
|
|
|
|
|
|
|
|
||||
January), |
2003 (+4%) |
|
|
29 |
|
|
|
|
|
|
|
|
|
|
|
122 |
|
|
|
|
|
|
(CIF fines |
|||||||
2007 (+106%) |
|
|
32 |
|
|
|
|
|
|
|
|
|
|
|
|
|
|
|
|
|
||||||||||
|
2004 (+11%) |
|
|
|
|
|
|
|
|
|
|
|
|
|
|
|
|
|
|
|
|
|
|
|
||||||
|
2005 (+41%) |
|
|
|
|
|
|
45 |
|
|
|
|
|
|
|
|
|
|
|
|
|
|
|
|
|
|
||||
|
2006 (+33%) |
|
|
|
|
|
|
|
|
|
59 |
|
|
|
|
|
|
|
|
|
|
|
|
|
|
|
|
|||
74 |
2008 (+25%) |
|
|
|
|
|
|
|
|
|
|
|
|
|
|
|
|
|
|
|
|
|
152 |
|
China), |
|||||
|
2009 (-44%) |
|
|
|
|
|
|
|
|
|
|
|
|
85 |
|
|
|
|
|
|
|
|
|
|
|
|
|
|||
|
2010 (+79%) |
|
|
|
|
|
|
|
|
|
|
|
|
|
|
|
|
|
|
|
|
|
152 |
|
|
|||||
|
2011 (+15%) |
|
|
|
|
|
|
|
|
|
|
|
|
|
|
|
|
|
|
|
|
|
|
175 |
|
|||||
|
2012 (-24%) |
|
|
|
|
|
|
|
|
|
|
|
|
|
|
|
|
|
|
132 |
|
|
|
$/t |
||||||
|
2013 (+3%) |
|
|
|
|
|
|
|
|
|
|
|
|
|
|
|
|
|
|
|
136 |
|
|
|
|
|||||
|
2014 (-29%) |
|
|
|
|
|
|
|
|
|
|
|
|
|
97 |
|
|
|
|
|
|
|
|
|
|
|
||||
|
2015 (-43%) |
|
|
|
|
|
|
56 |
|
|
|
|
|
|
|
|
|
|
|
|
|
|
|
|
||||||
|
2016 (+5%) |
|
|
|
|
|
|
|
|
|
58 |
|
|
|
|
|
|
|
|
|
|
|
|
|
|
|
|
|||
|
2017 (+22%) |
|
|
|
|
|
|
|
|
|
|
71 |
|
|
|
|
|
|
|
|
|
|
|
|
|
|
|
|||
|
2018 (-7%) |
|
|
|
|
|
|
|
|
|
|
66 |
|
|
|
|
|
|
|
|
|
|
|
|
|
|
|
|||
|
|
Spot |
|
,559 |
|
74 |
|
|
|
|
|
|
|
|
|
|
|
|
|
|||||||||||
2019E (20% upside) |
|
62 |
|
|
|
|
|
|
|
|
|
|
|
|
|
|
|
|
||||||||||||
2020E (20% upside) |
|
62 |
|
|
|
|
|
|
|
|
|
|
|
|
|
|
|
|
||||||||||||
2021E (18% upside) |
|
63 |
|
|
|
|
|
|
|
|
|
|
|
|
|
|
|
|||||||||||||
2022E (16% upside) |
|
64 |
|
|
|
|
|
|
|
|
|
|
|
|
|
|
|
|||||||||||||
2023E (14% upside) |
|
65 |
|
|
|
|
|
|
|
|
|
|
|
|
|
|
|
|||||||||||||
LT real (24% upside) |
|
60 |
|
|
|
|
|
|
|
|
|
|
|
|
|
|
|
|
||||||||||||
Spot |
|
1,000 |
|
|
|
|
|
|
|
|
5,000 |
6,000 |
7,000 |
|
8,000 |
9,000 |
10,000 |
Copper, |
||||||||||||
|
|
|
|
|
2,000 |
3,000 |
4,000 |
|
|
|
|
|
|
|
|
|
|
|
|
|
|
|
|
|
||||||
(7 |
|
2002 |
|
|
1 |
|
|
|
|
|
|
|
|
|
|
|
|
|
|
|
|
|
$/t |
|||||||
|
|
|
|
|
|
|
|
|
|
|
|
|
|
|
|
|
|
|
|
|
|
|
|
|
|
|
|
|||
2003 (+14%) |
|
|
|
|
1,779 |
|
|
|
|
|
|
|
|
|
|
|
|
|
|
|
|
|
|
|
||||||
January), |
|
|
|
|
|
|
|
|
|
|
|
|
|
|
|
|
|
|
|
|
|
|
|
|
||||||
2004 (+61%) |
|
|
|
|
|
|
|
|
|
2,865 |
|
|
|
|
|
|
|
|
|
|
|
|
|
|
|
|
||||
|
2005 (+28%) |
|
|
|
|
|
|
|
|
|
|
3,679 |
|
|
|
|
|
|
|
|
|
|
|
|
|
|||||
|
2006 (+83%) |
|
|
|
|
|
|
|
|
|
|
|
|
|
|
|
|
|
6,723 |
|
|
|
|
|||||||
5,904 |
2007 (+6%) |
|
|
|
|
|
|
|
|
|
|
|
|
|
|
|
|
|
|
|
|
7,121 |
|
|
||||||
2008 (-2%) |
|
|
|
|
|
|
|
|
|
|
|
|
|
|
|
|
|
|
|
|
6,961 |
|
|
|
||||||
|
2009 |
(-26%) |
|
|
|
|
|
|
|
|
|
|
|
|
|
|
|
5,148 |
|
|
|
|
|
|
|
|
||||
|
2010 (+46%) |
|
|
|
|
|
|
|
|
|
|
|
|
|
|
|
|
|
|
|
|
7,536 |
|
|
||||||
|
2011 (+17%) |
|
|
|
|
|
|
|
|
|
|
|
|
|
|
|
|
|
|
|
|
|
|
|
|
|
|
8,811 |
||
|
2012 (-10%) |
|
|
|
|
|
|
|
|
|
|
|
|
|
|
|
|
|
|
|
|
|
|
|
7,950 |
|
||||
|
2013 (-8%) |
|
|
|
|
|
|
|
|
|
|
|
|
|
|
|
|
|
|
|
|
7,328 |
|
|
||||||
|
2014 (-6%) |
|
|
|
|
|
|
|
|
|
|
|
|
|
|
|
|
|
|
|
6,861 |
|
|
|
||||||
|
2015 (-20%) |
|
|
|
|
|
|
|
|
|
|
|
|
|
|
|
5,512 |
|
|
|
|
|
|
|||||||
|
2016 (-12%) |
|
|
|
|
|
|
|
|
|
|
|
|
|
|
|
4,867 |
|
|
|
|
|
|
|
|
|
||||
|
2017 (+27%) |
|
|
|
|
|
|
|
|
|
|
|
|
|
|
|
|
6,170 |
|
|
|
|
|
|||||||
|
2018 (+6%) |
|
|
|
|
|
|
|
|
|
|
|
|
|
|
|
|
6,532 |
|
|
|
|||||||||
|
|
Spot |
|
|
|
|
|
|
|
|
|
|
|
|
|
|
|
|
5,904 |
|
|
|
|
|
||||||
2019E (2% downside) |
|
|
|
|
|
|
|
|
|
|
|
|
|
|
|
|
6,000 |
|
|
|
|
|
||||||||
2020E (7% downside) |
|
|
|
|
|
|
|
|
|
|
|
|
|
|
|
|
6,367 |
|
|
|
|
|||||||||
2021E (11% downside) |
|
|
|
|
|
|
|
|
|
|
|
|
|
|
|
|
6,606 |
|
|
|
||||||||||
2022E (12% downside) |
|
|
|
|
|
|
|
|
|
|
|
|
|
|
|
|
6,739 |
|
|
|
||||||||||
2023E (14% downside) |
|
|
|
|
|
|
|
|
|
|
|
|
|
|
|
|
|
|
|
6,875 |
|
|
|
|||||||
LT real (6% downside) |
|
|
|
|
|
|
|
|
|
|
|
|
|
|
|
|
6,300 |
|
|
|
|
|||||||||
(7Spot |
|
1,200 1,000 |
2,000 1,800 1,600 1,400 |
2,800 2,600 2,400 2,200 |
,Aluminium |
|||||||||||||||||||||||||
|
|
|
|
|
|
|
|
1 |
|
|
||||||||||||||||||||
|
|
2002 |
|
|
|
|
|
|
|
|
|
|
|
|
|
|
|
|
|
|
|
|
|
|
|
|
|
|
|
|
|
2003 (+6%) |
|
|
|
|
|
|
|
|
|
|
1,432 |
|
|
|
|
|
|
|
|
|
|
|
|
|
|||||
January), |
2004 (+20%) |
|
|
|
|
|
|
|
|
|
|
|
1,716 |
|
|
|
|
|
|
|
|
2,573 |
||||||||
2008 (-2%) |
|
|
|
|
|
|
|
|
|
|
|
|
|
|
1,899 |
|
|
|
|
|
||||||||||
|
2005 (+11%) |
|
|
|
|
|
|
|
|
|
|
|
|
|
|
|
|
|
|
|
|
$/t |
||||||||
|
2006 |
(+35%) |
|
|
|
|
|
|
|
|
|
|
|
|
|
|
|
|
|
|
|
|
|
|
|
|
|
|
2,570 |
|
|
2007 (+3%) |
|
|
|
|
|
|
|
|
|
|
|
|
|
|
|
|
|
|
|
|
|
|
|
|
|
|
2,639 |
||
1,866 |
2009 (-35%) |
|
|
|
|
|
|
|
|
|
|
|
1,664 |
|
|
|
|
|
|
|
|
|
|
|
||||||
2010 (+31%) |
|
|
|
|
|
|
|
|
|
|
|
|
|
|
|
|
|
|
|
|
|
2,173 |
|
|
|
|
||||
|
2011 |
(+10%) |
|
|
|
|
|
|
|
|
|
|
|
|
|
|
|
|
|
|
|
|
|
|
|
|
2,398 |
|
||
|
2012 (-16%) |
|
|
|
|
|
|
|
|
|
|
|
|
|
|
|
|
2,018 |
|
|
|
|
|
|||||||
|
2013 (-8%) |
|
|
|
|
|
|
|
|
|
|
|
|
|
|
1,847 |
|
|
|
|
|
|
|
|||||||
|
2014 (+1%) |
|
|
|
|
|
|
|
|
|
|
|
|
|
|
1,866 |
|
|
|
|
|
|
|
|||||||
|
2015 (-11%) |
|
|
|
|
|
|
|
|
|
|
|
1,664 |
|
|
|
|
|
|
|
|
|
|
|
||||||
|
2016 (-4%) |
|
|
|
|
|
|
|
|
|
|
|
1,604 |
|
|
|
|
|
|
|
|
|
|
|
||||||
|
2017 (+23%) |
|
|
|
|
|
|
|
|
|
|
|
|
|
|
|
|
1,968 |
|
|
|
|
|
|||||||
|
2018 (+7%) |
|
|
|
|
|
|
|
|
|
|
|
|
|
|
|
|
2,110 |
|
|
|
|
||||||||
|
|
Spot |
|
|
|
|
|
|
|
|
|
|
|
|
|
1,866 |
|
|
|
|
|
|
|
|||||||
2019E (4% downside) |
|
|
|
|
|
|
|
|
|
|
|
|
|
|
|
1,953 |
|
|
|
|
|
|||||||||
2020E (14% downside) |
|
|
|
|
|
|
|
|
|
|
|
|
|
|
|
|
|
|
2,166 |
|
|
|
|
|||||||
2021E (17% downside) |
|
|
|
|
|
|
|
|
|
|
|
|
|
|
|
|
|
|
|
2,254 |
|
|
||||||||
2022E (19% downside) |
|
|
|
|
|
|
|
|
|
|
|
|
|
|
|
|
|
|
|
2,300 |
|
|
||||||||
2023E (20% downside) |
|
|
|
|
|
|
|
|
|
|
|
|
|
|
|
|
|
|
|
2,346 |
|
|||||||||
LT real (13% downside) |
|
|
|
|
|
|
|
|
|
|
|
|
|
|
|
|
|
|
2,150 |
|
|
|
||||||||
|
|
|
|
|
|
|
|
|
|
|
|
|
|
|
|
|
|
|
|
|
|
|
|
|
|
|
|
|
|
|
spot with compared forecasts price Commodity 89: Figure
com/id446425943.vk
Mining & Metals |
Capital Renaissance 2019 January 14 |
|
|

vk.com/id446425943
Important publications
Renaissance Capital
14 January 2019
Metals & Mining
10-Jan-2019 |
Global: Gold – Downgrades despite TP increases |
10-Jan-2019 |
Global: Platinum Group Metals – Momentum could fade |
03-Dec-2018 |
EMEA: Steel companies – Lower input costs could support margin |
26-Nov-2018 |
Global: Chinese fuel cell demand – Clearing the fog |
13-Nov-2018 |
South Africa: Chinese platinum jewellery demand – Down, but definitely not out |
08-Nov-2018 |
South Africa: Platinum Western Limb - Structural headwinds to creating value |
24-Oct-2018 |
South Africa: Exxaro and South32’s SAEC - A match made in heaven? |
18-Oct-2018 |
South Africa/Russia: Gold - Safe-haven appeal back in vogue? |
11-Oct-2018 |
Russia: Acron Group – Quality and growth priced in – HOLD |
6-Sep-2018 |
South Africa: Precious metal miners – Who’s most sensitive to weaker rand? |
4-Sep-2018 |
EMEA Steel: Momentum and yield |
27-Aug-2018 |
South Africa: Mondi Ltd - Tailwinds may dissipate |
23-Aug-2018 |
South Africa: Sasol Ltd – Positive momentum, but can it crack? |
16-Aug-2018 |
Global: Russian Metals & Mining – Victims of their own success? |
15-Aug-2018 |
Russia: Alrosa – Incorporating new dividend policy |
13-Aug-2018 |
South Africa: Impala Platinum – Finally, a plan with defined milestones |
10-Aug-2018 |
Russian Metals & Mining: Proposed tax increases |
23-July-2018 |
Global: Metals & Mining – ESG: Decoding the bigger picture |
13-July-2018 |
Global: Metals & Mining – Results book – 1H18 |
13-July-2018 |
EEMEA: Steel companies – Commodity revisions |
11-July-2018 |
Global: Precious metal miners – Commodity revisions and rating cuts |
27-June-2018 |
Russia: PJSC PhosAgro – Elements for improving yield |
18-June-2018 |
Global: Draft SA Mining Charter – Unlikely to grow value |
8-June-2018 |
Mondi & Sappi – Near-term margin and CF pressure |
14-May-2018 |
Global: Metals & Mining – Not reflecting improved fundamentals |
14-May-2018 |
EEMEA: Steel companies – We still see value |
14-May-2018 |
Alrosa – Tailwinds dissipating –Transfer of coverage |
23-Apr-18 |
Global: Metals & Mining – Evolving nature of the PGM industry |
12-Apr-18 |
Global: Metals & Mining– Unpacking iron ore margins |
8-Feb-18 |
Russia/South Africa: Gold mining – Optionality vs long-term value |
5-Feb-18 |
Russia: PJSC Polyus – Best quality assets – BUY |
5-Feb-18 |
Russia: Polymetal International – Yield underpin, attractive growth – BUY |
17-Jan-18 |
Global: Metals & Mining – The transformers |
2-Nov-17 |
South Africa: ArcelorMittal South Africa – Not a ‘steel’ yet – SELL |
21-Sep-17 |
Global: Metals & Mining – Offering superior IRR |
12-Sep-17 |
South Africa: Sasol Ltd – Unpacking LCCP guidance and market dynamics |
10-Jul-17 |
South Africa: Sappi – Repositioning for growth |
16-Jun-17 |
South Africa: Metals & Mining: SA Mining Charter – Negative for the industry |
13-Jun-17 |
South Africa: Metals & Mining: SA Mining Charter – Measuring exposure and compliance |
7-Jun-17 |
Global: Metals & Mining sensitivities – Yield potential through the cycle |
20-Mar-17 |
Global: Metals & Mining: Copper – Running hard to stand still |
23-Jan-17 |
Global: Metals & Mining – Panning for value: growth vs value |
5-Dec-16 |
Global: Metals & Mining – Less is more |
9-Sep-16 |
Global: Metals & Mining – Wheel of fortune |
23-Aug-16 |
South Africa: Cracking the surface of the gold rally |
4-Jul-16 |
South Africa: Mondi – Boxing clever – BUY |
24-Jun-16 |
South Africa: Sasol Ltd – Growth at the expense of value – HOLD |
20-Jan-16 |
Global: Metals & Mining – The long (term value) and short (term risks) of it |
9-Dec-15 |
Global: Metals & Mining – Quantifying capacity closures |
23-Nov-15 |
Global: Metals & Mining – Efficiency: Survival of the fittest |
14-Sep-15 |
CIS Metals & Mining: Seeing value in challenging times |
14-Sep-15 |
Global: Metals & Mining – Searching for survivors |
3-Jul-15 |
Global: Metals & Mining – Panning for value |
23-Mar-15 |
Global: Metals & Mining – Commodity bear provides long-term value |
19-Jan-15 |
Global: Metals & Mining – Value sector |
4-Dec-14 |
Global: Metals & Mining – Approaching trough margins, but P/Es could de-rate |
13-Oct-14 |
Global: Productivity & efficiency benchmarking – Focus on the platinum sector |
11-Sep-14 |
South Africa: Metals & Mining – Falling iron ore prices outweigh self-help |
20-Jun-14 |
Global: Commodities: Iron ore – Cost support falls to $90/t by 2016E |
20-Jun-14 |
Global: Mining: Tide going out for iron ore – Stick with quality as cash flow evaporates |
24-Mar-14 |
Global: Mining: Harvest time – Cash flowing back to shareholders |
20-Jan-14 |
Global: Nine reasons to be more bullish on miners |
11-Nov-13 |
Global: Mining – Not a growth sector – Struggling to find value |
54