

vk.com/id446425943
Rio Tinto – BUY
Renaissance Capital
14 January 2019
Metals & Mining
Figure 100: Rio Tinto, $mn (unless otherwise stated)
|
|
|
|
Rio Tinto |
RIO.LN |
Target price, GBP: |
46.0 |
Market capitalisation, $mn: |
80,072 |
Share price, GBP: |
38.3 |
Enterprise value, $mn: |
92,623 |
Potential 12-month return: |
25.7% |
Dec-YE |
2016 |
2017 |
2018E |
2019E |
2020E |
Income statement |
|
|
|
|
|
Revenue |
35,318 |
41,857 |
41,989 |
40,979 |
41,910 |
Underlying EBITDA |
13,507 |
18,584 |
18,141 |
16,709 |
16,226 |
Underlying EBIT |
8,187 |
13,561 |
13,425 |
12,221 |
11,624 |
EBIT |
7,116 |
14,474 |
13,264 |
11,901 |
11,269 |
Finance items |
-773 |
-1,658 |
-496 |
-674 |
-645 |
Taxation |
-1,567 |
-3,965 |
-3,996 |
-3,246 |
-3,026 |
Minority interest in profit |
-159 |
-89 |
-326 |
-445 |
-443 |
Net profit for the year |
4,617 |
8,762 |
8,446 |
7,536 |
7,155 |
Underlying earnings |
5,100 |
8,627 |
8,482 |
7,536 |
7,155 |
Underlying EPS, USc |
284 |
483 |
493 |
458 |
437 |
Thomson Reuters consensus EPS, USc |
|
|
505 |
476 |
477 |
DPS declared, USc |
170 |
290 |
270 |
275 |
262 |
Underlying EBIT |
7,065 |
10,488 |
9,981 |
9,313 |
8,246 |
Iron ore |
|||||
EBIT margin |
44% |
52% |
50% |
47% |
43% |
Copper |
-289 |
297 |
1,046 |
1,328 |
1,502 |
EBIT margin |
-5% |
4% |
13% |
15% |
15% |
Energy |
624 |
1,049 |
601 |
9 |
1 |
EBIT margin |
20% |
32% |
42% |
5% |
5% |
Aluminium |
1,222 |
2,224 |
2,372 |
1,749 |
2,066 |
EBIT margin |
13% |
20% |
20% |
16% |
17% |
Minerals |
256 |
493 |
481 |
653 |
708 |
EBIT margin |
11% |
19% |
17% |
19% |
19% |
Other operations |
-691 |
-990 |
-1,054 |
-832 |
-898 |
Underlying EBIT |
8,187 |
13,561 |
13,425 |
12,221 |
11,624 |
Income statement ratios |
|
|
|
|
|
EBITDA margin |
38% |
44% |
43% |
41% |
39% |
EBIT margin |
23% |
32% |
32% |
30% |
28% |
EPS growth |
14% |
70% |
2% |
-7% |
-5% |
Dividend payout ratio |
60% |
60% |
55% |
60% |
60% |
Input assumptions |
|
|
|
|
|
Iron ore fines (62%Fe, CIF China) $/t |
58 |
71 |
66 |
62 |
62 |
Copper, USc/lb |
240 |
244 |
220 |
197 |
199 |
Coking coal, $/t |
79 |
154 |
87 |
- |
- |
Aluminium, $/t |
1,604 |
1,968 |
2,110 |
1,953 |
2,166 |
$/AUD |
0.74 |
0.77 |
0.75 |
0.72 |
0.78 |
Required breakeven prices |
|
|
|
|
|
Iron ore, $/t |
31 |
33 |
30 |
29 |
33 |
Copper, USc/lb |
240 |
244 |
220 |
197 |
199 |
Aluminium, $/t |
1,259 |
1,420 |
1,530 |
1,538 |
1,680 |
Sales volumes (RIO's share) |
|
|
|
|
|
Iron ore, mnt |
281 |
282 |
288 |
302 |
301 |
Copper, kt |
527 |
455 |
585 |
615 |
652 |
Aluminium, kt |
3,649 |
3,552 |
3,471 |
3,544 |
3,544 |
Attributable Cu eq volumes, kt |
5,981 |
5,909 |
5,869 |
6,051 |
6,014 |
Volume growth |
5.0% |
-1.2% |
-0.7% |
3.1% |
-0.6% |
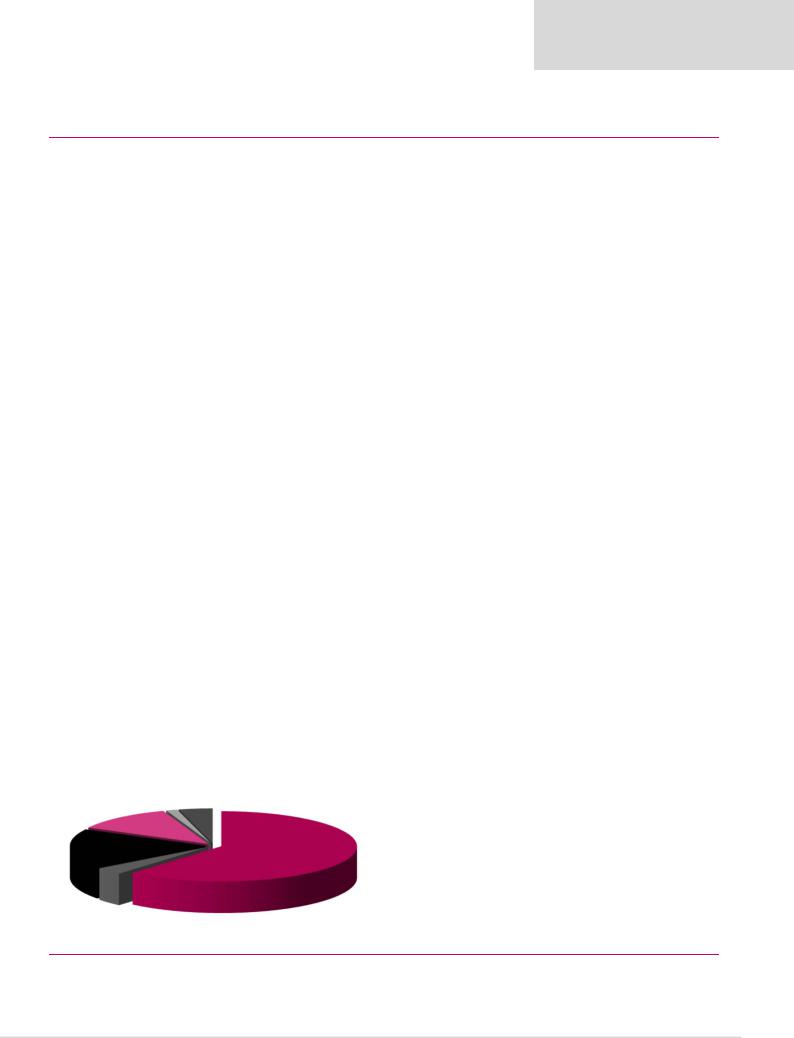
Contribution to FY18E attributable underlying EBITDA
Dec-YE |
|
|
2018E |
2019E |
2020E |
2016 |
2017 |
||||
Balance sheet |
|
|
|
|
|
Net operating assets |
54,740 |
55,023 |
47,789 |
48,909 |
50,300 |
Investments |
577 |
-63 |
225 |
225 |
225 |
Equity |
39,290 |
44,711 |
40,289 |
41,391 |
44,227 |
Minority interest |
6,440 |
6,404 |
6,324 |
6,414 |
6,502 |
Net debt |
9,587 |
3,845 |
1,401 |
1,330 |
-204 |
Balance sheet ratios |
|
|
|
|
|
Gearing (net debt/(net debt+equity)) |
19.6% |
7.9% |
3.4% |
3.1% |
-0.5% |
Net debt to EBITDA |
0.7x |
0.2x |
0.1x |
0.1x |
0.0x |
RoCE |
11.8% |
19.7% |
20.4% |
19.6% |
18.1% |
RoIC (after tax) |
10.2% |
17.6% |
10.7% |
14.4% |
13.7% |
RoE |
12.0% |
20.9% |
19.9% |
18.5% |
16.7% |
Cash flow statement |
|
|
|
|
|
Operating cash flow |
11,872 |
17,007 |
11,211 |
13,652 |
13,514 |
Capex |
-3,309 |
-4,761 |
2,450 |
-6,000 |
-6,500 |
Other |
-308 |
-447 |
638 |
-320 |
-356 |
FCF |
8,255 |
11,799 |
14,299 |
7,332 |
6,658 |
Equity shareholders' cash |
6,921 |
12,075 |
13,233 |
6,504 |
5,853 |
Dividends and share buy backs |
-2,725 |
-6,333 |
-10,789 |
-6,434 |
-4,318 |
Surplus (deficit) cash |
4,196 |
5,742 |
2,444 |
70 |
1,534 |
Cash flow ratios |
|
|
|
|
|
Working capital days |
8 |
8 |
12 |
11 |
10 |
Cash conversion |
1.4x |
1.4x |
1.6x |
0.9x |
0.8x |
FCF yield |
11.5% |
13.3% |
14.7% |
8.3% |
7.7% |
Equity shareholders' yield |
12.4% |
15.3% |
14.8% |
8.1% |
7.3% |
Capex/EBITDA |
24.5% |
25.6% |
-13.5% |
35.9% |
40.1% |
Valuation |
|
|
|
|
|
SoTP DCF valuation and calculation of target price |
|
$mn |
GBP/sh |
||
Iron ore |
|
|
|
85,889 |
41.1 |
Energy |
|
|
|
3,095 |
1.5 |
Aluminium |
|
|
|
17,308 |
8.3 |
Copper |
|
|
|
15,755 |
7.5 |
Diamonds |
|
|
|
170 |
0.1 |
Minerals |
|
|
|
5,469 |
2.6 |
Exploration and other |
|
|
|
-14,370 |
-6.9 |
Total enterprise value |
|
|
|
113,317 |
54.2 |
Net debt as at 31 December 2017 |
|
|
|
-3,845 |
-1.8 |
Cash used in share buy-backs |
|
|
|
-5,401 |
-2.6 |
Other investments |
|
|
|
-63 |
-0.0 |
Minority interest |
|
|
|
-8,706 |
-4.2 |
Equity value as at 8/1/2019 |
|
|
|
95,302 |
45.6 |
Rounded to |
|
|
|
|
46.0 |
Share price on 7/1/2019 |
|
|
|
|
38.3 |
Expected share price return |
|
|
|
|
20.1% |
Plus: expected dividend yield |
|
|
|
|
5.6% |
Total implied one-year return |
|
|
|
|
25.7% |
Share price range, GBP: |
|
|
|
|
|
12-month high on 7/6/2018 |
45.4 |
12-month low on 11/9/2018 |
34.6 |
||
Price move since high |
-15.6% |
Price move since low |
|
10.7% |
|
Copper |
Diamonds |
Minerals |
1% |
4% |
|
12% |
|
|
Aluminium |
Energy |
Iron ore |
|
61% |
|||
18% |
4% |
||
|
Calculation of discount rate |
|
|
|
|
|
|
WACC |
8.8% |
Cost of debt |
|
|
4.5% |
|
Risk-free rate |
4.0% |
Tax rate |
|
|
30% |
|
Equity risk premium |
5.0% After-tax cost of debt |
|
3.2% |
|||
Beta |
1.25 |
Debt weighting |
|
20% |
||
Cost of equity |
10.3% |
Terminal growth rate |
|
2.5% |
||
Valuation ratios |
|
|
|
|
|
|
Dec-YE |
2016 |
2017 |
|
2018E |
2019E |
2020E |
P/E multiple |
10.9x |
9.1x |
|
10.6x |
10.7x |
11.2x |
Dividend yield |
5.5% |
6.6% |
|
5.2% |
5.6% |
5.4% |
EV/EBITDA |
5.3x |
4.8x |
|
5.4x |
5.3x |
5.3x |
P/B |
1.4x |
1.8x |
|
2.2x |
1.9x |
1.8x |
NAV per share, $ |
21.9 |
25.0 |
|
23.4 |
25.2 |
27.0 |
NAV per share, GBP |
16.1 |
19.4 |
|
17.5 |
19.6 |
20.6 |
Source: Bloomberg, Thomson Reuters, Company data, Renaissance Capital estimates
65

vk.com/id446425943
South32 – HOLD
Renaissance Capital
14 January 2019
Metals & Mining
Figure 101: South32, $mn (unless otherwise stated)
|
|
|
|
South32 (Pro forma historic financials) |
S32J.J |
Target price, ZAR: |
37.0 |
Market capitalisation, $mn: |
11,925 |
Share price, ZAR: |
33.2 |
Enterprise value, $mn: |
9,614 |
Potential 12-month return: |
18.4% |
Jun-YE |
|
|
2017 |
2018 |
2019E |
2020E |
2021E |
Income statement |
|
|
|
|
|
|
|
Revenue |
|
|
6,950 |
7,549 |
7,398 |
7,641 |
7,853 |
Underlying EBITDA |
|
|
2,411 |
2,516 |
2,391 |
2,173 |
2,167 |
Underlying EBIT |
|
|
1,648 |
1,774 |
1,630 |
1,384 |
1,385 |
Net interest |
|
|
-171 |
-100 |
-95 |
-93 |
-80 |
Taxation |
|
|
-393 |
-287 |
-337 |
-306 |
-316 |
Minority interest in profit |
|
|
0 |
0 |
0 |
0 |
0 |
Attributable profit |
|
|
1,231 |
1,332 |
1,198 |
985 |
988 |
Underlying earnings |
|
|
1,146 |
1,327 |
1,198 |
985 |
988 |
Underlying EPS, USc |
|
|
21.6 |
25.7 |
23.8 |
19.7 |
19.9 |
Thomson Reuters consensus, USc |
|
|
|
26.8 |
24.5 |
24.6 |
|
DPS declared, USc |
|
|
10.0 |
13.5 |
19.0 |
15.8 |
15.9 |
Underlying EBIT |
|
|
520 |
870 |
848 |
797 |
811 |
Aluminium |
|
|
|||||
EBIT margin |
|
|
16% |
21% |
21% |
19% |
19% |
Manganese |
|
|
577 |
837 |
744 |
461 |
421 |
EBIT margin |
|
|
46% |
52% |
46% |
34% |
30% |
Nickel |
|
|
-16 |
120 |
-7 |
30 |
51 |
EBIT margin |
|
|
-4% |
21% |
-1% |
6% |
9% |
Cannington |
|
|
308 |
183 |
66 |
136 |
168 |
EBIT margin |
|
|
40% |
31% |
14% |
25% |
28% |
Energy Coal South Africa |
|
|
212 |
276 |
234 |
195 |
178 |
EBIT margin |
|
|
19% |
20% |
18% |
14% |
13% |
Illawarra Metallurgical Coal |
|
|
358 |
-62 |
195 |
78 |
52 |
EBIT margin |
|
|
32% |
-9% |
19% |
8% |
5% |
Other |
|
|
-311 |
-450 |
-450 |
-313 |
-296 |
Underlying EBIT |
|
|
1,648 |
1,774 |
1,630 |
1,384 |
1,385 |
Income statement ratios |
|
|
|
|
|
|
|
EBITDA margin |
|
|
35% |
33% |
32% |
28% |
28% |
EBIT margin |
|
|
24% |
23% |
22% |
18% |
18% |
EPS growth |
|
|
731% |
19% |
-7% |
-17% |
1% |
Dividend payout ratio |
|
|
46% |
53% |
80% |
80% |
80% |
Input assumptions |
|
|
|
|
|
|
|
Aluminium, $/t |
|
|
1,772 |
2,133 |
1,946 |
2,071 |
2,228 |
Manganese ore (44%, CIF China), $/mtu |
|
5.72 |
6.79 |
6.32 |
5.24 |
5.41 |
|
Silver, $/oz |
|
|
18 |
17 |
15 |
18 |
18 |
Hard coking coal, $/t |
|
|
190 |
200 |
196 |
166 |
157 |
$/AUD |
|
|
0.75 |
0.78 |
0.72 |
0.75 |
0.80 |
Required breakeven price |
|
|
|
|
|
|
|
Aluminium, $/t |
|
|
1,389 |
1,747 |
1,647 |
1,651 |
1,687 |
Manganese ore, $/dmtu |
|
|
2.36 |
2.96 |
3.14 |
3.07 |
3.25 |
Silver, $/oz |
|
|
-2.34 |
1.90 |
9.03 |
5.68 |
3.54 |
Metallurgical coal, $/t |
|
|
117 |
208 |
141 |
139 |
135 |
Sales volumes (South32's share) |
|
|
|
|
|
|
|
Aluminium, kt |
|
|
986 |
985 |
978 |
988 |
988 |
Silver, mn oz |
|
|
16 |
12 |
12 |
12 |
12 |
Metallurgical coal, mnt |
|
|
6.0 |
2.9 |
4.9 |
5.8 |
6.0 |
Manganese ore (Samancor total), mnt |
|
8.5 |
9.0 |
8.7 |
9.0 |
9.0 |
|
Attributable Cu eq volumes, kt |
|
1,282 |
1,217 |
1,242 |
1,284 |
1,286 |
|
Volume growth |
|
|
-6.7% |
-5.1% |
2.1% |
3.3% |
0.1% |
|
|
|
|
|
|
||
Contribution to FY19E underlying EBITDA |
|
|
|
|
|
||
Energy Coal South |
Illawarra |
|
|
|
|
|
|
Metallurgical Coal |
|
|
|
Aluminium |
|
||
Africa |
13% |
|
|
|
|
|
|
10% |
|
|
|
|
|
41% |
|
Cannington
4%
Nickel
3%
Manganese
29%
Jun-YE |
|
|
|
|
|
|
|
|
2017 |
2018 |
|
2019E |
2020E |
2021E |
|
Balance sheet |
|
|
|
|
|
|
|
Net operating assets |
|
8,027 |
7,977 |
|
9,053 |
8,945 |
8,963 |
Rehab provision net of investments |
|
568 |
691 |
|
705 |
719 |
734 |
Equity |
|
10,236 |
10,710 |
|
10,683 |
10,859 |
11,046 |
Minority interest |
|
-1 |
-1 |
|
-1 |
-1 |
-1 |
Net debt (cash) |
|
-1,640 |
-2,041 |
|
-924 |
-1,194 |
-1,348 |
Balance sheet ratios |
|
|
|
|
|
|
|
Gearing (net debt/(net debt+equity)) |
|
-19.1% |
-23.5% |
|
-9.5% |
-12.3% |
-13.9% |
Net debt to EBITDA |
|
-0.7x |
-0.8x |
|
-0.4x |
-0.5x |
-0.6x |
RoCE |
|
15.7% |
17.3% |
|
15.0% |
12.1% |
12.2% |
RoIC (after tax) |
|
15.1% |
15.5% |
|
13.2% |
8.9% |
9.1% |
RoE |
|
12.5% |
12.7% |
|
11.2% |
9.1% |
9.0% |
Cash flow statement |
|
|
|
|
|
|
|
Operating cash flow |
|
2,350 |
2,015 |
|
2,331 |
1,746 |
1,794 |
Capex (net of disposals) |
|
-316 |
-430 |
|
-2,142 |
-588 |
-767 |
Other cash flow |
|
162 |
-29 |
|
0 |
0 |
0 |
FCF |
|
2,196 |
1,556 |
|
189 |
1,158 |
1,026 |
Equity shareholders' cash |
|
1,783 |
1,363 |
|
108 |
1,079 |
956 |
Dividends and share buy backs |
|
-455 |
-962 |
|
-1,225 |
-809 |
-801 |
Excess cash |
|
1,328 |
401 |
|
-1,117 |
270 |
155 |
Cash flow ratios |
|
|
|
|
|
|
|
Working capital days |
|
38 |
46 |
|
40 |
41 |
41 |
Capex/EBITDA |
|
15.1% |
21.2% |
|
108.3% |
30.9% |
40.0% |
FCF yield |
|
26.4% |
13.7% |
|
1.7% |
10.8% |
9.7% |
Equity shareholders' yield |
|
17.9% |
10.2% |
|
0.9% |
9.0% |
8.0% |
Cash conversion |
|
1.6x |
1.0x |
|
0.1x |
1.1x |
1.0x |
Capital returns/market cap |
|
4.6% |
7.2% |
|
10.3% |
6.8% |
6.7% |
Valuation |
|
|
|
|
|
|
|
Calculation of TP |
|
|
|
|
$mn |
ZAR/sh |
|
Aluminium |
|
|
|
|
6,829 |
19.5 |
|
Manganese |
|
|
|
|
1,764 |
5.0 |
|
Nickel |
|
|
|
|
449 |
1.3 |
|
Cannington |
|
|
|
|
668 |
1.9 |
|
Hermosa |
|
|
|
|
324 |
0.9 |
|
Energy Coal South Africa |
|
|
|
|
554 |
1.6 |
|
Illawarra Metallurgical Coal |
|
|
|
|
669 |
1.9 |
|
Corporate and other |
|
|
|
|
-786 |
-2.2 |
|
Enterprise value as at 8-1-2019 |
|
|
|
|
10,472 |
30.0 |
|
Investments as at 30 June 2018 |
|
|
|
|
691 |
2.0 |
|
Cash used in share buy-backs during 2019E |
|
|
|
|
-379 |
-1.1 |
|
Net cash (debt) as at 30 June 2018 |
|
|
|
|
2,041 |
5.8 |
|
Equity value as at 2-9-2016 |
|
|
|
|
12,825 |
36.7 |
|
Rounded to |
|
|
|
|
|
37.0 |
|
Share price on 7/1/2019 |
|
|
|
|
|
33.2 |
|
Expected share price return |
|
|
|
|
|
11.5% |
|
Plus: expected dividend yield |
|
|
|
|
|
6.9% |
|
Total implied one-year return |
|
|
|
|
|
18.4% |
|
Share price range, ZAR: |
|
|
|
|
|
|
|
12-month high on 4/10/2018 |
45 |
12-month low on 22/2/2018 |
28 |
||||
Price move since high |
-25.9% Price move since low |
|
19.7% |
||||
Calculation of discount rate |
|
|
|
|
|
|
|
WACC |
10.3% |
Cost of debt |
|
|
4.0% |
||
Risk-free rate |
4.0% |
Tax rate |
|
|
30% |
||
Equity risk premium |
5.5% After-tax cost of debt |
|
2.8% |
||||
Beta |
1.30 |
Debt weighting |
|
10% |
|||
Cost of equity |
11.2% |
Terminal growth rate |
|
2.0% |
|||
Valuation ratios |
|
|
|
|
|
|
|
Jun-YE |
|
2017 |
2018 |
|
2019E |
2020E |
2021E |
P/E multiple |
|
8.8x |
10.2x |
|
10.1x |
12.1x |
12.0x |
Dividend yield |
|
5.2% |
5.2% |
|
8.0% |
6.6% |
6.7% |
Capital returns/market cap |
|
4.6% |
7.2% |
|
10.3% |
6.8% |
6.7% |
EV/EBITDA |
|
3.4x |
4.5x |
|
4.6x |
4.9x |
4.9x |
P/B |
|
1.0x |
1.3x |
|
1.1x |
1.1x |
1.1x |
NAV per share, $ |
|
2.0 |
2.1 |
|
2.1 |
2.2 |
2.2 |
NAV per share, ZAR |
|
27 |
27 |
|
31 |
31 |
31 |
Source: Bloomberg, Thomson Reuters, Company data, Renaissance Capital estimates
66

vk.com/id446425943
Vale – BUY
Renaissance Capital
14 January 2019
Metals & Mining
Figure 102: Vale, $mn (unless otherwise stated) |
|
|
|
|
|
|
|
|
|
|
|
|
||||
Vale |
|
|
|
VALE.N |
|
|
|
|
|
Target price, $: |
|
|
15.5 |
|||
Market capitalisation, $mn: |
|
|
|
71,371 |
|
|
|
|
|
Last price, $: |
|
|
13.8 |
|||
Enterprise value, $mn: |
|
|
|
91,660 |
|
|
|
|
|
Potential 12-month return: |
|
19.5% |
||||
|
|
|
|
|
|
|
|
|
|
|
|
|
|
|
|
|
Dec-YE |
|
|
2016 |
2017 |
2018E |
2019E |
2020E |
Dec-YE |
2016 |
2017 |
|
2018E |
2019E |
2020E |
||
Income statement |
|
|
|
|
|
|
|
|
Balance sheet |
|
|
|
|
|
|
|
Revenue |
|
|
29,334 |
35,713 |
37,397 |
37,428 |
38,699 |
|
Net operating assets |
66,066 |
62,915 |
|
53,125 |
55,137 |
56,554 |
|
Adjusted EBITDA |
|
|
12,181 |
15,337 |
17,312 |
16,343 |
15,733 |
|
Investments |
18 |
18 |
|
6 |
6 |
7 |
|
Adjusted EBIT |
|
|
8,267 |
10,873 |
13,750 |
12,465 |
11,725 |
|
Equity |
39,042 |
43,458 |
|
43,493 |
45,763 |
47,233 |
|
Net interest |
|
|
1,966 |
-3,019 |
-6,069 |
-2,250 |
-2,313 |
|
Minority interest |
1,982 |
1,314 |
|
860 |
868 |
876 |
|
Taxation |
|
|
-2,781 |
-830 |
-1,525 |
-2,825 |
-2,605 |
|
Net debt (target: $10bn) |
25,060 |
18,161 |
|
8,778 |
8,512 |
8,451 |
|
Minority interest in profit |
|
|
6 |
-14 |
-1 |
-40 |
-40 |
|
|
|
|
|
|
|
|
|
Net profit for the year |
|
|
5,277 |
6,935 |
5,821 |
7,599 |
7,002 |
|
Balance sheet ratios |
|
|
|
|
|
|
|
Underlying earnings |
|
|
4,968 |
7,188 |
8,145 |
7,599 |
7,002 |
|
Gearing * |
31.4% |
22.4% |
|
11.0% |
9.7% |
9.1% |
|
Underlying EPS, $ |
|
|
0.96 |
1.39 |
1.57 |
1.47 |
1.36 |
|
Net debt to EBITDA |
2.1x |
1.2x |
|
0.5x |
0.5x |
0.5x |
|
|
|
|
RoCE |
13.1% |
16.4% |
|
22.4% |
21.7% |
19.8% |
|||||||
Thomson Reuters consensus EPS, $ |
|
|
|
1.38 |
1.67 |
1.50 |
|
RoIC (after tax) |
12.6% |
19.8% |
|
15.7% |
14.4% |
13.5% |
||
DPS declared, $ |
|
|
0.27 |
0.28 |
0.87 |
1.03 |
1.19 |
|
RoE |
13.7% |
17.4% |
|
18.7% |
17.0% |
15.1% |
|
Adjusted EBIT |
|
|
|
|
|
|
|
|
Cash flow statement |
|
|
|
|
|
|
|
Ferrous Minerals |
|
|
8,747 |
11,497 |
13,385 |
12,318 |
10,607 |
|
Operating cash flow |
10,030 |
16,819 |
|
12,946 |
12,768 |
12,252 |
|
EBIT margin |
|
|
43% |
46% |
47% |
43% |
37% |
|
Capex less disposals |
-5,480 |
-4,154 |
|
-2,385 |
-5,454 |
-4,892 |
|
Coal |
|
|
-244 |
-25 |
21 |
53 |
77 |
|
Other cash flows |
-987 |
-1,825 |
|
3,001 |
0 |
0 |
|
EBIT margin |
|
|
-29% |
-2% |
1% |
3% |
4% |
|
FCF |
3,563 |
10,840 |
|
13,562 |
7,315 |
7,360 |
|
Base metals |
|
|
36 |
501 |
991 |
535 |
1,495 |
|
Equity shareholders' cash |
702 |
8,574 |
|
12,538 |
5,595 |
5,593 |
|
EBIT margin |
|
|
1% |
7% |
15% |
8% |
19% |
|
Dividends and share buy-backs |
-500 |
-1,675 |
|
-3,155 |
-5,329 |
-5,531 |
|
Fertiliser nutrients |
|
|
-138 |
-885 |
-109 |
0 |
0 |
|
Excess cash |
202 |
6,899 |
|
9,383 |
266 |
61 |
|
EBIT margin |
|
|
-7% |
-51% |
-122% |
n/a |
n/a |
Cash flow ratios |
|
|
|
|
|
|
||
Others and logistics |
|
|
-134 |
-215 |
-538 |
-442 |
-453 |
|
|
|
|
|
|
|
||
EBIT margin |
|
|
-84% |
-54% |
-169% |
-115% |
-113% |
|
Working capital days |
0 |
7 |
|
11 |
8 |
7 |
|
Adjusted EBIT - Group production |
|
8,267 |
10,873 |
13,750 |
12,465 |
11,725 |
|
Capex/EBITDA |
45.0% |
27.1% |
|
13.8% |
33.4% |
31.1% |
||
Income statement ratios |
|
|
|
|
|
|
|
|
FCF yield |
6.6% |
15.4% |
|
16.9% |
9.1% |
9.1% |
|
|
|
|
|
|
|
|
|
Equity shareholders' yield |
2.6% |
16.9% |
|
17.8% |
7.8% |
7.8% |
||
EBITDA margin |
|
|
41.5% |
42.9% |
46.3% |
43.7% |
40.7% |
|
Cash conversion |
0.1x |
1.2x |
|
1.5x |
0.7x |
0.8x |
|
EBIT margin |
|
|
28.2% |
30.4% |
36.8% |
33.3% |
30.3% |
|
Valuation |
|
|
|
|
|
|
|
EPS growth |
|
|
393% |
44% |
13% |
-6% |
-8% |
|
|
|
|
|
|
|
||
Dividend payout ratio |
|
|
29% |
20% |
55% |
70% |
88% |
|
SoTP valuation and calculation of target price |
|
|
|
$mn |
$ |
||
Input assumptions |
|
|
|
|
|
|
|
|
Ferrous minerals |
|
|
|
|
90,939 |
17.6 |
|
|
|
|
|
|
|
|
|
Coal |
|
|
|
|
1,182 |
0.2 |
||
Iron ore fines (62%Fe,CIF China), $/t |
|
58 |
71 |
66 |
62 |
62 |
|
Base metals |
|
|
|
|
8,577 |
1.7 |
||
Brazil to China freight charge, $/t |
|
|
9 |
15 |
18 |
17 |
17 |
|
Fertiliser nutrients |
|
|
|
|
1,524 |
0.3 |
|
Nickel, $/t |
|
|
9,599 |
10,404 |
13,130 |
11,530 |
14,285 |
|
Others and logistics |
|
|
|
|
-1,655 |
-0.3 |
|
Copper, $/t |
|
|
4,867 |
6,170 |
6,532 |
6,000 |
6,367 |
|
Total enterprise value |
|
|
|
|
100,567 |
19.5 |
|
Thermal coal, $/t |
|
|
64 |
85 |
98 |
93 |
86 |
|
Net debt as at latest year end |
|
|
|
|
-18,161 |
-3.5 |
|
Hard coking coal, $/t |
|
|
144 |
188 |
206 |
178 |
160 |
|
Cash used in share buy-backs |
|
|
|
|
-497 |
-0.1 |
|
$/BRL |
|
|
3.49 |
3.19 |
3.65 |
3.78 |
3.50 |
|
Other investments |
|
|
|
|
18 |
0.0 |
|
|
|
|
|
|
|
|
|
|
|
Minority interest (DCF value) |
|
|
|
|
-2,128 |
-0.4 |
Required breakeven price |
|
|
|
|
|
|
|
|
Equity value as at 8/1/2019 |
|
|
|
|
79,799 |
15.5 |
|
Iron ore, $/t |
|
|
27 |
32 |
25 |
27 |
32 |
|
Rounded to |
|
|
|
|
|
15.5 |
|
Metallurgical coal, $/t |
|
|
192 |
152 |
183 |
167 |
149 |
|
Share price on 7/1/2019 |
|
|
|
|
|
13.8 |
|
Nickel, $/t |
|
|
8,160 |
9,137 |
8,998 |
9,214 |
9,216 |
|
Expected share price return |
|
|
|
|
|
12.1% |
|
Copper, $/t |
|
|
2,893 |
2,341 |
3,379 |
3,373 |
3,012 |
|
Plus: expected dividend yield |
|
|
|
|
|
7.5% |
|
Sales volumes |
|
|
|
|
|
|
|
|
Total implied one-year return |
|
|
|
|
|
19.5% |
|
|
|
|
|
|
|
|
|
|
|
|
|
|
|
|
||
Iron ore, mnt |
|
|
293 |
289 |
317 |
343 |
335 |
|
Share price range, $: |
|
|
|
|
|
|
|
Iron pellets, mnt |
|
|
48 |
52 |
55 |
58 |
65 |
|
12-month high on 3/10/2018 |
16.13 |
12-month low on 28/3/2018 |
11.93 |
||||
Nickel, kt |
|
|
311 |
294 |
236 |
248 |
264 |
|
Price move since high |
-14.3% |
Price move since low |
|
15.9% |
|||
Copper, kt |
|
|
430 |
424 |
378 |
417 |
427 |
|
|
|
|
|
|
|
|
|
Attributable Cu eq volumes, kt |
|
|
5,402 |
5,381 |
5,178 |
5,598 |
5,771 |
|
Calculation of WACC |
|
|
|
|
|
|
|
Volume growth |
|
|
3.2% |
-0.4% |
-3.8% |
8.1% |
3.1% |
|
WACC |
11.5% |
Cost of debt |
|
|
7.0% |
||
Contribution to FY18E Adjusted EBITDA |
|
|
|
|
|
|
Risk-free rate |
4.0% |
Tax rate |
|
|
30% |
||||
|
|
|
|
|
|
Equity risk premium |
6.3% |
After-tax cost of debt |
|
4.9% |
||||||
|
|
Base metals |
|
|
|
|
|
|
Beta |
1.30 |
Debt weighting |
|
10% |
|||
|
Coal |
|
|
|
|
|
|
Cost of equity |
12.2% |
Terminal growth rate |
|
2.0% |
||||
|
14% |
|
|
|
|
|
|
|
|
|||||||
|
1% |
|
|
|
|
|
|
|
|
|
|
|
|
|
|
|
|
Manganese |
|
|
|
|
|
|
|
|
Valuation ratios |
|
|
|
|
|
|
|
1% |
|
|
|
|
|
|
|
|
Dec-YE |
2016 |
2017 |
|
2018E |
2019E |
2020E |
|
|
|
|
|
|
|
|
|
|
P/E multiple |
5.3x |
7.1x |
|
8.7x |
9.4x |
10.2x |
|
|
|
|
|
|
|
|
|
|
Dividend yield |
5.3% |
2.9% |
|
6.4% |
7.5% |
8.6% |
|
|
|
|
|
|
|
|
|
|
EV/EBITDA |
4.4x |
4.6x |
|
4.6x |
4.9x |
5.1x |
|
Pellets |
|
|
|
|
|
|
|
|
P/B |
0.7x |
1.2x |
|
1.6x |
1.6x |
1.5x |
|
19% |
|
|
|
|
|
|
|
|
NAV per share, $ |
7.6 |
8.4 |
|
8.4 |
8.9 |
9.2 |
|
|
|
|
|
|
|
Iron ore |
|
Dividend policy: Minimum payment of 30% of EBITDA less sustaining capex. |
|
|
|||||
|
|
|
|
|
|
|
65% |
|
|
|
|
|||||
|
|
|
|
|
|
|
|
|
|
|
|
|
|
|
|
|
|
|
|
|
|
|
|
|
|
|
|
|
|
|
|
|
|
* Gearing defined as net debt/(net debt +equity)
Source: Bloomberg, Thomson Reuters, Company data, Renaissance Capital estimates
67

vk.com/id446425943
AngloGold Ashanti – SELL
Renaissance Capital
14 January 2019
Metals & Mining
Figure 103: AngloGold Ashanti, $mn (unless otherwise stated)
|
|
|
|
AngloGold Ashanti |
ANGJ.J |
Target price, ZAR: |
110 |
Market capitalisation, $mn: |
5,354 |
Share price, ZAR: |
181 |
Enterprise value, $mn: |
7,456 |
Potential 12-month return: |
-38.0% |
Dec-YE |
|
|
2016 |
2017 |
|
2018E |
2019E |
2020E |
Income statement |
|
|
|
|
|
|
|
|
Revenue |
|
|
4,519 |
4,809 |
|
4,542 |
5,209 |
5,380 |
Adjusted EBITDA |
|
1,770 |
1,750 |
|
1,731 |
2,346 |
2,230 |
|
Adjusted EBIT |
|
849 |
790 |
|
864 |
1,328 |
1,165 |
|
Other items |
|
|
-343 |
-706 |
|
-422 |
-260 |
-274 |
Net interest |
|
|
-234 |
-150 |
|
-142 |
-87 |
-44 |
Taxation |
|
|
-182 |
-84 |
|
-108 |
-294 |
-254 |
Minority interest in profit |
|
-17 |
-20 |
|
-20 |
-29 |
-27 |
|
Net profit for the year |
|
80 |
-168 |
|
172 |
658 |
566 |
|
Headline earnings |
|
111 |
27 |
|
239 |
658 |
566 |
|
Headline EPS, USc |
|
27 |
6 |
|
58 |
158 |
136 |
|
Thomson Reuters consensus HEPS, USc |
|
|
|
|
58 |
99 |
118 |
|
DPS declared, USc |
|
10 |
5 |
|
8 |
16 |
12 |
|
Adjusted EBIT |
|
132 |
-12 |
|
6 |
88 |
58 |
|
South Africa |
|
|
|
|||||
EBIT margin |
|
11% |
-1% |
|
1% |
14% |
10% |
|
Continental Africa |
|
333 |
385 |
|
346 |
551 |
539 |
|
EBIT margin |
|
20% |
20% |
|
17% |
23% |
21% |
|
Australasia |
|
|
106 |
160 |
|
187 |
265 |
214 |
EBIT margin |
|
16% |
23% |
|
24% |
29% |
23% |
|
Americas |
|
|
283 |
254 |
|
309 |
408 |
335 |
EBIT margin |
|
27% |
23% |
|
27% |
32% |
26% |
|
Other |
|
|
-5 |
3 |
|
16 |
16 |
18 |
Adjusted EBIT |
|
849 |
790 |
|
864 |
1,328 |
1,165 |
|
Income statement ratios |
|
|
|
|
|
|
|
|
EBITDA margin |
|
39% |
36% |
|
38% |
45% |
41% |
|
EBIT margin |
|
19% |
16% |
|
19% |
25% |
22% |
|
HEPS Growth |
|
250% |
-78% |
|
863% |
174% |
-14% |
|
Dividend payout ratio |
|
37% |
86% |
|
13% |
10% |
9% |
|
Input assumptions |
|
|
|
|
|
|
|
|
Gold, $/oz |
|
|
1,248 |
1,258 |
|
1,269 |
1,350 |
1,338 |
ZAR/$ |
|
|
14.70 |
13.31 |
|
13.24 |
14.31 |
14.14 |
$/AUD |
|
|
1.34 |
1.30 |
|
1.34 |
1.38 |
1.28 |
$/BRL |
|
|
3.49 |
3.19 |
|
3.65 |
3.78 |
3.50 |
$/ARS |
|
|
14.78 |
16.56 |
|
28.09 |
35.38 |
35.79 |
Gold production volumes, koz |
|
|
|
|
|
|
|
|
South Africa |
lumes |
|
967 |
902 |
|
494 |
468 |
468 |
Continental Africa lumes |
|
1,322 |
1,453 |
|
1,497 |
1,716 |
1,872 |
|
Australasia |
lumes |
|
520 |
560 |
|
635 |
680 |
688 |
Americas |
lumes |
|
819 |
840 |
|
770 |
828 |
828 |
Total lumes |
|
3,628 |
3,755 |
|
3,396 |
3,692 |
3,856 |
|
Volume growth |
|
-5.3% |
3.5% |
|
-9.6% |
8.7% |
4.4% |
|
Calculated breakeven price, $/oz |
|
|
|
|
|
|
|
|
South Africa breakeven |
|
1,103 |
1,270 |
|
1,204 |
1,092 |
1,147 |
|
Continental Africa breakeven |
|
877 |
930 |
|
907 |
954 |
980 |
|
Australasia breakeven |
|
1,012 |
1,020 |
|
943 |
873 |
953 |
|
Americas breakeven |
|
864 |
926 |
|
836 |
823 |
896 |
|
Group breakeven |
|
1,036 |
1,088 |
|
1,010 |
982 |
1,035 |
|
Contribution to FY18E underlying EBITDA |
|
|
|
|
|
|
||
|
Corporate and |
South Africa |
|
|
||||
|
|
|
other |
|
|
|||
|
|
|
1% |
|
5% |
|
|
|
Americas
30%
Australasia |
Continental Africa |
20% |
44% |
Dec-YE |
|
2016 |
2017 |
|
2018E |
2019E |
2020E |
Balance sheet |
|
|
|
|
|
|
|
Net operating assets |
|
5,409 |
5,506 |
|
5,253 |
5,075 |
4,961 |
Investments, net of rehab provision |
|
-739 |
-801 |
|
-712 |
-712 |
-712 |
Equity |
|
2,715 |
2,663 |
|
2,745 |
3,372 |
3,873 |
Minority interest |
|
39 |
41 |
|
36 |
36 |
36 |
Net debt |
|
1,916 |
2,001 |
|
1,759 |
955 |
340 |
Balance sheet ratios |
|
|
|
|
|
|
|
Gearing (net debt/(net debt+equity)) |
|
41.4% |
42.9% |
|
39.1% |
22.1% |
8.1% |
Net debt to EBITDA |
|
1.1x |
1.1x |
|
1.0x |
0.4x |
0.2x |
RoCE |
|
14.1% |
13.2% |
|
14.8% |
23.6% |
21.3% |
RoIC (after tax) |
|
4.4% |
-3.9% |
|
4.3% |
13.3% |
11.2% |
RoE |
|
4.3% |
1.0% |
|
8.8% |
21.5% |
15.6% |
Cash flow statement |
|
|
|
|
|
|
|
Operating cash flow |
|
1,526 |
1,429 |
|
1,286 |
2,190 |
1,943 |
Capex (net of disposals) |
|
-811 |
-964 |
|
-771 |
-1,005 |
-932 |
Other cash flows |
|
-258 |
-466 |
|
-54 |
-260 |
-274 |
Free cash flow |
|
457 |
-1 |
|
461 |
925 |
737 |
Equity shareholders' cash |
|
274 |
-44 |
|
263 |
835 |
680 |
Dividends and share buy-backs |
|
0 |
-41 |
|
-21 |
-31 |
-65 |
Surplus (deficit) cash |
|
274 |
-85 |
|
242 |
804 |
615 |
Cash flow ratios |
|
|
|
|
|
|
|
Working capital turnover, days |
|
25 |
29 |
|
52 |
34 |
33 |
FCF yield |
|
5.8% |
0.0% |
|
8.1% |
14.4% |
12.7% |
Equity shareholders' yield |
|
4.7% |
-1.0% |
|
6.8% |
15.4% |
12.5% |
Capex/EBITDA |
|
45.8% |
55.1% |
|
44.5% |
42.9% |
41.8% |
Cash conversion |
|
2.5x |
-1.6x |
|
1.1x |
1.3x |
1.2x |
Valuation |
|
|
|
|
|
|
|
SoTP DCF fair value and calculation of TP |
|
|
|
|
$mn |
ZAR/sh |
|
South Africa |
|
|
|
|
1,044 |
35.9 |
|
Continental Africa |
|
|
|
|
3,915 |
134.8 |
|
Australasia |
|
|
|
|
1,411 |
48.6 |
|
Americas |
|
|
|
|
1,715 |
59.1 |
|
Corporate and other |
|
|
|
|
-2,087 |
-71.9 |
|
Operating value |
|
|
|
|
5,998 |
206.5 |
|
Financial instruments and rehab provision as at 31 December 2017 |
|
-801 |
-27.6 |
||||
Enterprise value |
|
|
|
|
5,197 |
178.9 |
|
Net debt as at 31 December 2017 |
|
|
|
|
-2,001 |
-68.9 |
|
Minority interest |
|
|
|
|
-102 |
-3.5 |
|
Cash used in share buy-backs during 2018E |
|
|
|
|
0 |
0.0 |
|
Equity value |
|
|
|
|
3,094 |
106.5 |
|
Rounded to |
|
|
|
|
|
110.0 |
|
Share price on 7/1/2019 |
|
|
|
|
|
181.0 |
|
Expected share price return |
|
|
|
|
|
-39.2% |
|
Plus: expected dividend yield |
|
|
|
|
|
1.2% |
|
Total implied one-year return |
|
|
|
|
|
-38.0% |
|
Share price range, ZAR: |
|
|
|
|
|
|
|
12-month high on 4-1-2019 |
191 |
12-month low on 23-5-2018 |
100 |
||||
Price move since high |
-5.4% |
Price move since low |
|
80.6% |
|||
Calculation of WACC |
|
|
|
|
|
|
|
WACC |
7.4% |
Cost of debt |
|
|
5.0% |
||
Risk-free rate |
4.0% |
Tax rate |
|
|
30% |
||
Equity risk premium |
5.0% After-tax cost of debt |
|
1.1% |
||||
Beta |
1.00 |
Debt weighting |
|
30% |
|||
Cost of equity |
9.0% |
Terminal growth rate |
|
2.0% |
|||
Valuation ratios |
|
|
|
|
|
|
|
Dec-YE |
|
2016 |
2017 |
|
2018E |
2019E |
2020E |
P/E multiple |
|
52.9x |
177.4x |
|
16.2x |
8.2x |
9.6x |
Dividend yield |
|
0.7% |
0.5% |
|
0.8% |
1.2% |
0.9% |
EV/EBITDA |
|
4.4x |
3.7x |
|
3.3x |
2.7x |
2.6x |
P/B |
|
2.2x |
1.7x |
|
1.4x |
1.6x |
1.4x |
NAV per share, $ |
|
6.6 |
6.4 |
|
6.6 |
8.1 |
9.3 |
NAV per share, ZAR |
|
97 |
85 |
|
88 |
116 |
132 |
Source: Bloomberg, Thomson Reuters, Renaissance Capital estimates
68