

vk.com/id446425943
Capital cycle favours rising returns
Renaissance Capital
14 January 2019
Metals & Mining
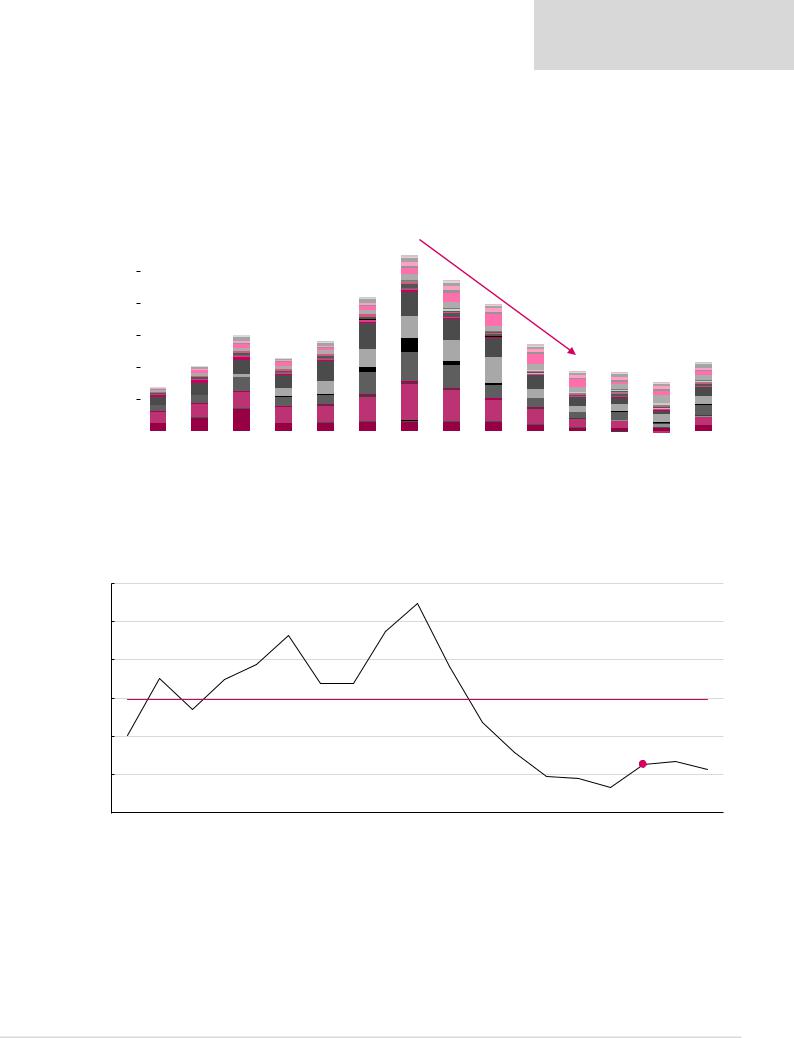
Stretched balance sheets and poor operating cash generation from low commodity prices have forced management teams to focus on cash preservation and capital efficiency for the sake of survival. This limited investment in new supply. Capex for the 32 companies in Figure 17 fell by around 70% from 2012-2018E.
Figure 17: Resource sector capex, $mn
Mining capex has fallen by 70% since
2012…
Capex, $mn
|
|
Anglo |
|
|
ARM |
|
|
|
Assore |
|
|
BHP |
|
|
South32 |
|
|
Exxaro |
|
|
Kumba |
|
||
|
|
|
|
|
|
|
|
|
|
|
|
|
|
|||||||||||
|
|
|
|
|
|
|
|
|
|
|
|
|
|
|||||||||||
|
|
Rio Tinto |
|
|
Fortescue |
|
|
Glencore |
|
|
Vale |
|
|
Amplats |
|
|
Impala |
|
|
Lonmin |
|
|||
|
|
|
|
|
|
|
|
|
|
|
|
|
|
|
||||||||||
|
|
|
|
|
|
|
|
|
|
|
|
|
|
|
||||||||||
|
|
Northam |
|
|
RBPlats |
|
|
|
Tharisa* |
|
|
AngloGold |
|
|
Gold Fields |
|
|
Harmony |
|
|
Polymetal |
|||
|
|
|
|
|
|
|
|
|
|
|
|
|
|
|
||||||||||
|
|
|
|
|
|
|
|
|
|
|
|
|
|
|
||||||||||
|
|
Polyus |
|
|
Sibanye |
|
|
|
Merafe |
|
|
Codelco* |
|
|
Freeport* |
|
|
Southern Copper* |
|
Teck Resources* |
||||
|
|
|
|
|
|
|
|
|
|
|
|
|
|
|||||||||||
|
|
|
|
|
|
|
|
|
|
|
|
|
|
|||||||||||
|
|
Norilsk |
|
|
Alrosa |
|
|
|
PhosAgro |
|
|
Acron |
|
|
|
|
|
|
|
|
|
|
||
|
|
|
|
|
|
|
|
|
|
|
|
|
|
|
|
|
|
|
||||||
|
|
|
|
|
|
|
|
|
|
|
|
|
|
|
|
|
|
|
||||||
100,000 |
|
|
|
|
|
|
|
|
|
|
|
|
|
|
|
|
|
|
|
|
|
|
||
|
|
|
|
|
|
|
|
|
|
|
|
|
|
|
|
|
|
|
|
|
|
|||
|
|
|
|
|
|
|
|
|
|
|
|
|
|
|
|
|
|
|
|
|
|
|||
80,000 |
|
|
|
|
|
|
|
|
|
|
|
|
|
|
|
|
|
|
|
|
|
|
||
|
|
|
|
|
|
|
|
|
|
|
|
|
|
|
|
|
|
|
|
|
|
|||
60,000 |
|
|
|
|
|
|
|
|
|
|
|
|
|
|
|
|
|
|
|
|
|
|
||
|
|
|
|
|
|
|
|
|
|
|
|
|
|
|
|
|
|
|
|
|
|
|||
40,000 |
|
|
|
|
|
|
|
|
|
|
|
|
|
|
|
|
|
|
|
|
|
|
||
|
|
|
|
|
|
|
|
|
|
|
|
|
|
|
|
|
|
|
|
|
|
|||
20,000 |
|
|
|
|
|
|
|
|
|
|
|
|
|
|
|
|
|
|
|
|
|
|
||
|
|
|
|
|
|
|
|
|
|
|
|
|
|
|
|
|
|
|
|
|
|
|||
0 |
|
|
|
|
|
|
|
|
|
|
|
|
|
|
|
|
|
|
|
|
|
|
||
|
|
|
|
|
|
|
|
|
|
|
|
|
|
|
|
|
|
|
|
|
|
|||
2006 |
2007 |
2008 |
2009 |
2010 |
2011 |
2012 |
2013 |
2014 |
2015 |
2016 |
2017 |
2018E |
2019E |
|||||||||||
*Not covered by Renaissance Capital; estimates based on company guidance.
|
Source: Company data, Renaissance Capital estimates |
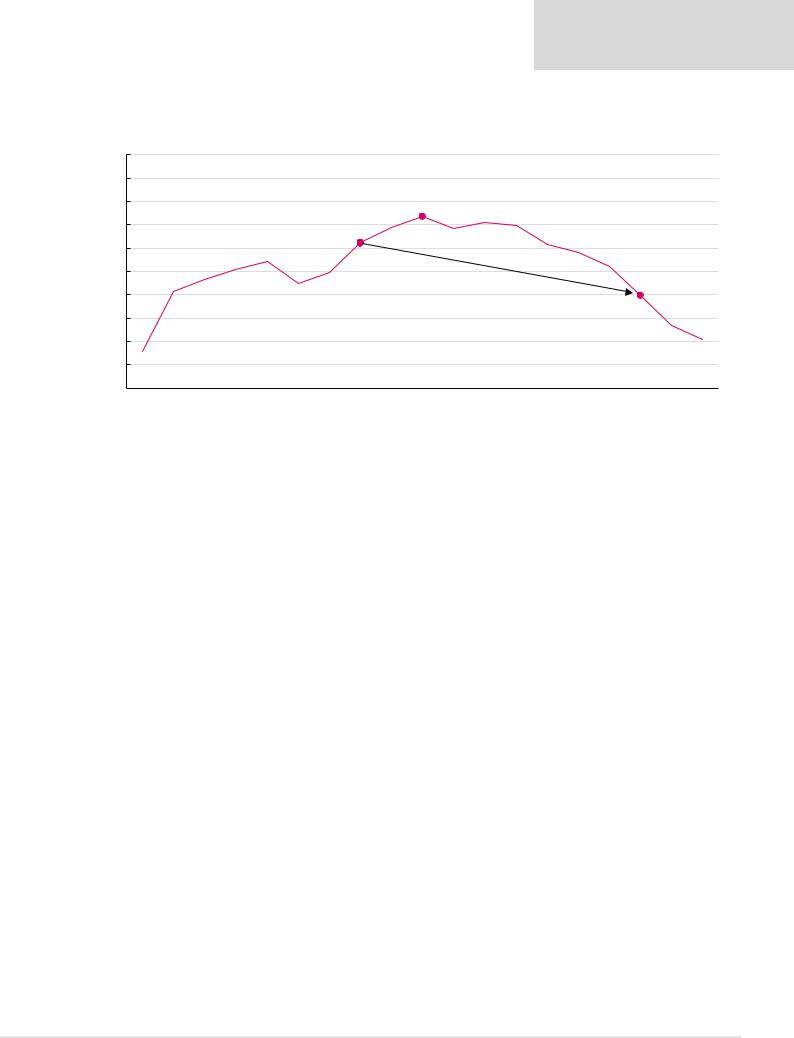
Sector capex/depreciation, which averaged around 2x over the past 16 years, is still only |
…and is not enough to replace |
at around 1.1x, which is not enough to replace depleting mines, in our view. |
depleting mines |
Figure 18: Capex/depreciation ratio over time |
|
|
|
|
|
|
|
|
|
|
|
|
|
|
|
|||
3.5x |
|
|
|
|
|
|
|
|
|
|
|
|
|
|
|
|
|
|
|
|
|
|
|
|
|
|
|
|
3.2x |
|
|
|
|
|
|
|
|
3.0x |
|
|
|
|
|
|
|
|
|
|
|
|
|
|
|
|
|
|
|
|
|
|
|
|
2.8x |
|
|
|
|
|
|
|
|
|
|
|
|
2.5x |
|
|
|
|
|
|
|
|
|
|
|
|
|
|
|
|
|
|
|
|
2.3x |
|
|
|
|
|
|
|
|
|
|
|
Average, 2003-18E, 2.0x |
|
|
||
2.0x |
|
|
|
|
|
|
|
|
|
|
|
|
|
|
|
|
|
|
1.5x |
1.5x |
|
|
|
|
|
|
|
|
|
|
|
|
|
|
|
|
|
|
|
|
|
|
|
|
|
|
|
|
|
|
1.3x |
|
|
1.1x |
|
|
|
|
|
|
|
|
|
|
|
|
|
|
|
|
|
|
|
|
|
1.0x |
|
|
|
|
|
|
|
|
|
|
|
|
|
|
|
|
|
|
|
|
|
|
|
|
|
|
|
|
|
|
|
|
0.9x |
|
|
|
1.1x |
|
|
|
|
|
|
|
|
|
|
|
|
|
|
|
|
|
|
|
0.5x |
|
|
|
|
|
|
|
|
|
|
|
|
|
|
|
|
|
|
2003 |
2004 |
2005 |
2006 |
2007 |
2008 |
2009 |
2010 |
2011 |
2012 |
2013 |
2014 |
2015 |
2016 |
2017 |
2018E |
2019E |
2020E |
2021E |
Note: Chart includes Alrosa, Anglo American, Antofagasta*, ARM, Assore, BHP, Codelco*, Exxaro, Fortescue, Freeport*, Glencore, Kumba, Norilsk, Rio Tinto, South32, Southern Copper*, Teck*, Vale, Amplats, Impala, Lonmin, Northam, RB Plat, AngloGold, Gold Fields, Harmony, Polymetal, Polyus and Sibanye.
*Not covered by Renaissance Capital; estimates based on company guidance.
Source: Company data, Renaissance Capital estimates
We believe current commodity prices and our forecasts do not incentivise new mine |
Project returns do not incentivise |
project approvals. We calculate estimated returns on new (average) mine projects of |
new supply |
around 8% using our 2019 commodity price forecasts. |
|
12

vk.com/id446425943
Renaissance Capital
14 January 2019
Metals & Mining
Figure 19: Return on incremental capital (RoIC), based on assets at estimated replacement cost
|
20% |
|
|
|
|
|
|
|
|
|
|
|
|
|
|
|
|
|
|
|
18% |
|
|
|
|
17% |
|
18% |
17% |
|
|
|
|
|
|
|
|
|
|
|
|
|
|
|
|
|
|
|
|
|
|
|
|
|
|
|
|||
|
16% |
|
|
|
|
|
|
|
|
|
|
|
|
|
|
|
|
|
|
|
14% |
|
|
|
|
|
|
|
|
|
|
|
|
|
|
|
|
|
|
|
12% |
|
|
|
|
|
|
|
|
|
|
|
|
|
|
|
|
|
|
$/t |
|
|
|
|
|
|
|
|
|
|
|
Estimated incentive return, 10.0% |
|
|
|
||||
10% |
|
|
|
|
|
|
|
|
|
|
|
|
|
|
|
|
|
|
|
|
|
|
|
|
|
|
|
|
|
|
|
|
|
|
|
|
8% |
|
|
|
8% |
|
|
|
|
|
|
|
|
|
|
|
|
|
|
|
|
|
|
|
6% |
|
5% |
|
|
|
|
|
|
|
|
|
|
|
|
|
|
|
7% |
|
|
|
|
|
|
|
|
|
|
|
|
|
|
|
|
|
|
|
|
|
4% |
|
|
|
|
|
5% |
|
|
|
|
|
|
|
|
|
|
|
|
|
4% |
|
|
|
|
|
|
|
|
|
|
|
|
|
|
|
|
|
|
|
2% |
|
|
|
|
|
|
|
|
|
|
|
3% |
|
|
|
|
|
|
|
0% |
|
|
|
|
|
|
|
|
|
|
|
|
|
|
|
|
|
|
|
2003 |
2004 |
2005 |
2006 |
2007 |
2008 |
2009 |
2010 |
2011 |
2012 |
2013 |
2014 |
2015 |
2016 |
2017 |
2018E |
2019E |
2020E |
2021E |
Note: Chart includes Alrosa, Anglo American, Antofagasta*, ARM, Assore, BHP, Codelco*, Exxaro, Fortescue, Freeport*, Glencore, Kumba, Norilsk, Rio Tinto, South32, Southern Copper*, Teck*, Vale, Amplats, Impala, Lonmin, Northam, RB Plat, AngloGold, Gold Fields, Harmony, Polymetal, Polyus and Sibanye.
*Not covered by Renaissance Capital; estimates based on company guidance.
Source: Company data, Renaissance Capital estimates
We believe the sector typically invests in volume growth when expected returns on investment increase above 10%. The chart below shows that sector capex rose above estimated maintenance levels when expected returns (per chart above) rose above 10%. Given poor expected returns at consensus commodity price forecasts and management teams’ focus on value-creation, medium-term capex guidance of $900-1,000 per copper equivalent (Cu eq) tonne remains below levels required to maintain production over the long term. We estimate capex required to maintain production over the long term at around $1,180/Cu eq tonne.
Capex guidance remains below levels required to maintain production over the long term
Figure 20: Mining sector capex per Cu eq unit (2019 real)
3,500
3,000
2,500
2,000
$/t
1,500
1,000
500
0
|
|
|
|
|
|
|
|
|
3,006 |
|
|
|
|
|
|
|
|
|
|
|
|
|
|
2,165 |
|
|
2,436 |
|
2,410 |
|
|
|
Estimated capex required to |
|
|
||
|
|
|
|
|
|
|
|
|
|
|
|
|
|
|
|
|||
|
|
|
|
|
|
|
1,694 |
|
|
|
1,812 |
|
|
maintain volumes, $/t, 1,180 |
|
|
||
1,149 |
1,393 |
1,087 |
1,358 |
1,640 |
|
1,555 |
|
|
|
1,341 |
917 |
898 |
727 |
968 |
993 |
901 |
||
2003 |
2004 |
2005 |
2006 |
2007 |
2008 |
2009 |
2010 |
2011 |
2012 |
2013 |
2014 |
2015 |
2016 |
2017 |
2018E |
2019E |
2020E |
2021E |
Note: Chart includes Alrosa, Anglo American, Antofagasta*, ARM, Assore, BHP, Codelco*, Exxaro, Fortescue, Freeport*, Glencore, Kumba, Norilsk, Rio Tinto, South32, Southern Copper*, Teck*, Vale, Amplats, Impala, Lonmin, Northam, RB Plat, AngloGold, Gold Fields, Harmony, Polymetal, Polyus and Sibanye.
*Not covered by Renaissance Capital; estimates based on company guidance.
Source: Company data, Renaissance Capital estimates
13
vk.com/id446425943
Renaissance Capital
14 January 2019
Metals & Mining
We therefore forecast mine production to decline over the next 10 years. This could support rising commodity prices and sector returns over the medium term.
Figure 21: Copper equivalent production*, kt
|
50,000 |
|
|
|
|
|
|
|
|
|
|
|
|
|
|
|
|
|
|
|
49,000 |
|
|
|
|
|
|
|
|
|
|
|
|
|
|
|
|
|
|
kt |
48,000 |
|
|
|
|
|
|
|
2021E, 47,349 |
|
|
|
|
|
|
|
|
||
|
|
|
|
|
|
|
|
|
|
|
|
|
|
|
|
|
|
|
|
production, |
47,000 |
|
|
|
|
|
|
|
|
|
|
|
|
|
|
|
|
|
|
46,000 |
|
|
|
|
2019E, 46,227 |
|
|
|
|
|
|
|
|
|
|
|
|
||
|
|
|
|
|
|
|
|
|
|
|
|
|
|
|
|
|
|
||
|
|
|
|
|
|
|
|
|
|
|
|
|
|
|
|
|
|
|
|
equivalent |
45,000 |
|
|
|
|
|
|
|
|
|
|
|
|
|
|
|
|
|
|
44,000 |
|
|
|
|
|
|
|
|
|
|
|
|
|
|
|
|
2028E, 43,960 |
||
|
|
|
|
|
|
|
|
|
|
|
|
|
|
|
|
|
|
|
|
Copper |
43,000 |
|
|
|
|
|
|
|
|
|
|
|
|
|
|
|
|
|
|
|
|
|
|
|
|
|
|
|
|
|
|
|
|
|
|
|
|
|
|
|
42,000 |
|
|
|
|
|
|
|
|
|
|
|
|
|
|
|
|
|
|
|
41,000 |
|
|
|
|
|
|
|
|
|
|
|
|
|
|
|
|
|
|
|
40,000 |
|
|
|
|
|
|
|
|
|
|
|
|
|
|
|
|
|
|
|
2012 |
2013 |
2014 |
2015 |
2016 |
2017 |
2018E |
2019E |
2020E |
2021E |
2022E |
2023E |
2024E |
2025E |
2026E |
2027E |
2028E |
2029E |
2030E |
*All volumes converted to copper equivalent tonnes using RenCap long-term commodity price forecasts.
Source: Company data, Renaissance Capital estimates
14
vk.com/id446425943
Management remains focused on value-creation
Mining is transforming into highly efficient industrial processes through improved operating models, product optimisation, mechanisation, automation and improved IT utilisation.
Renaissance Capital
14 January 2019
Metals & Mining
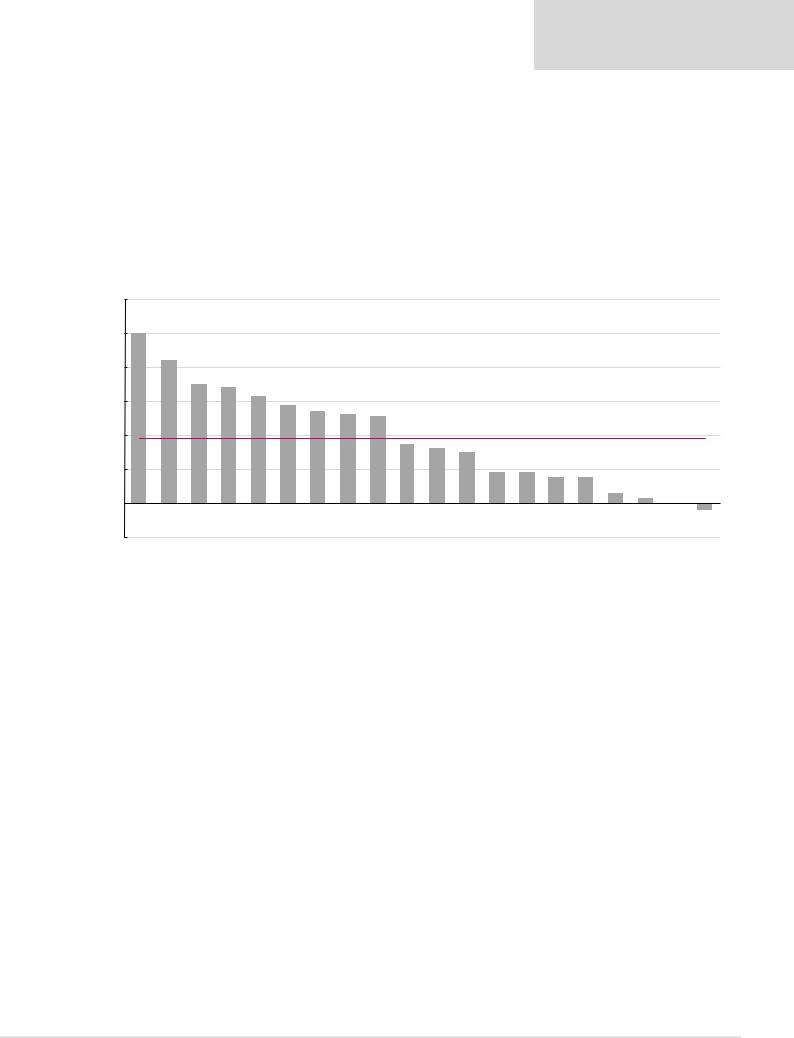
Labour productivity has improved by 38% since 2012
Productivity improvement is a sustainable way to reduce unit costs.
We calculate that labour productivity, defined as copper equivalent production per employee, has improved by 38% since 2012.
Figure 22: Change in labour productivity, June 2012-June 2017, %
|
120% |
100%+ |
|
|
|
|
|
|
|
|
|
|
|
|
|
|
|
|
|
|
|
|
|
|
|
|
|
|
|
|
|
|
|
|
|
|
|
|
|
|
|
|
|
|
100% |
|
84% |
|
|
|
|
|
|
|
|
|
|
|
|
|
|
|
|
|
|
% |
|
|
|
|
|
|
|
|
|
|
|
|
|
|
|
|
|
|
|
|
|
productivity, |
80% |
|
|
70% |
68% |
63% |
|
|
|
|
|
|
|
|
|
|
|
|
|
|
|
60% |
|
|
58% |
54% |
52% |
51% |
|
|
|
|
|
|
|
|
|
|
|
||||
|
|
|
|
|
|
|
|
|
|
|
|
|
|
||||||||
Change in labour |
40% |
|
|
|
|
|
|
|
|
|
35% |
33% |
30% |
|
|
|
|
Average, 38.4% |
|
|
|
|
|
|
|
|
|
|
|
|
|
|
|
|
|
|
|
|
|||||
20% |
|
|
|
|
|
|
|
|
|
18% |
18% |
15% |
15% |
6% |
|
|
|
||||
|
|
|
|
|
|
|
|
|
|
3% |
|
|
|||||||||
|
0% |
|
|
|
|
|
|
|
|
|
|
|
|
|
|
|
|
|
|
|
|
|
-20% |
|
|
|
|
|
|
|
|
|
|
|
|
|
|
|
|
|
|
-1% |
-4% |
|
Fortescue |
BHP |
Rio Tinto |
ARM |
Vale |
Amplats |
Glencore |
Anglo |
Kumba |
Tharisa* |
Northam |
Freeport |
Gold Fields |
Impala |
RBPlat |
Teck* |
South32 |
AngloGold |
Lonmin |
Sibanye |
|
|
|
||||||||||||||||||||
Note: Gold Fields and Sibanye is calculated from June 2013, South32 from June 2014.
Source: Company data, Renaissance Capital
Higher productivity could be achieved through improved safety, mechanisation, automation, more efficient infrastructure and scale. Figures 23 and 24 show changes in production volumes and the number of employees at mining companies. The drop in
Fortescue’s and Exxaro’s labour force relates to the completion of capital projects and a reduction in capex, while BHP’s labour force reduction was the result of right-sizing initiatives. Anglo American’s productivity improvement was aided by restructuring and disposals of labour-intensive divisions.
15
vk.com/id446425943
Figure 23: Change in workforce, June 2012-June 2017, %
100% |
90% |
|
|
80% |
|
|
|
|
|
|
|
|
|
|
|
|
60% |
|
|
|
|
|
|
|
|
|
|
|
% |
40% |
|
|
|
|
|
|
|
|
|
|
|
workforce, |
|
|
|
|
|
|
|
|
|
|
|
|
20% |
7% |
|
|
|
|
|
|
|
|
|
|
|
|
|
|
|
|
|
|
|
|
|
|
|
|
in |
0% |
|
|
|
|
|
|
|
|
|
|
|
Change |
-20% |
0% |
-4% |
-6% |
-6% |
12%- |
15%- |
15%- |
17%- |
22%- |
29%- |
32%- |
|
|
|
|
|
|
|
|
|
|
|
|
|
|
-40% |
|
|
|
|
|
|
|
|
|
|
|
|
-60% |
|
|
|
|
|
|
|
|
|
|
|
|
-80% |
|
|
|
|
|
|
|
|
|
|
|
Sibanye |
Northam |
Tharisa |
Freeport |
RBPlat |
Teck |
Lonmin |
South32 |
Impala |
AngloGold |
Glencore |
Rio Tinto |
Vale |
Note: Glencore is calculated from 2012, Gold Fields and Sibanye are calculated from June 2013, South32 is calculated from June 2014.
Figure 24: Change in production, June 2012-June 2017, %
Renaissance Capital
14 January 2019
Metals & Mining
Average, -19.2%
-35% |
-39% |
-43% |
-43% |
-48% |
-50% |
|
Kumba |
Anglo |
ARM |
Amplats |
Gold Fields |
BHP |
Fortescue-66% |
Source: Company data, Renaissance Capital
Change in production, %
150%
100%
50%
0%
-50%
-100%
100.0%+ |
100.0%+ |
|
|
|
|
|
|
|
|
|
|
|
|
53.8% |
35.0% |
33.0% |
21.6% |
15.6% |
12.7% |
10.8% |
6.4% |
5.0% |
4.8% |
1.9% |
0.9% |
Average, 12.0%
-0.3% |
-6.4% |
-8.3% |
-10.7% |
-12.2% |
-13.8% |
-14.9% |
-20.1% |
-38.1% |
Fortescue |
Sibanye |
Northam |
SCCO |
Tharisa |
Impala |
Glencore |
Rio Tinto |
Vale |
RBPlat |
Codelco |
ARM |
Harmony |
Freeport |
Teck |
Anglo |
Kumba |
BHP |
South32 |
Amplats |
AngloGold |
Lonmin |
Gold Fields |
Note: Glencore is calculated from 2012, Gold Fields, RBPlats, Harmony and Sibanye are calculated from June 2013, South32 is calculated from June 2014.
Source: Company data, Renaissance Capital
16

vk.com/id446425943
Renaissance Capital
14 January 2019
Metals & Mining
Unit costs have dropped by 20% since 2012
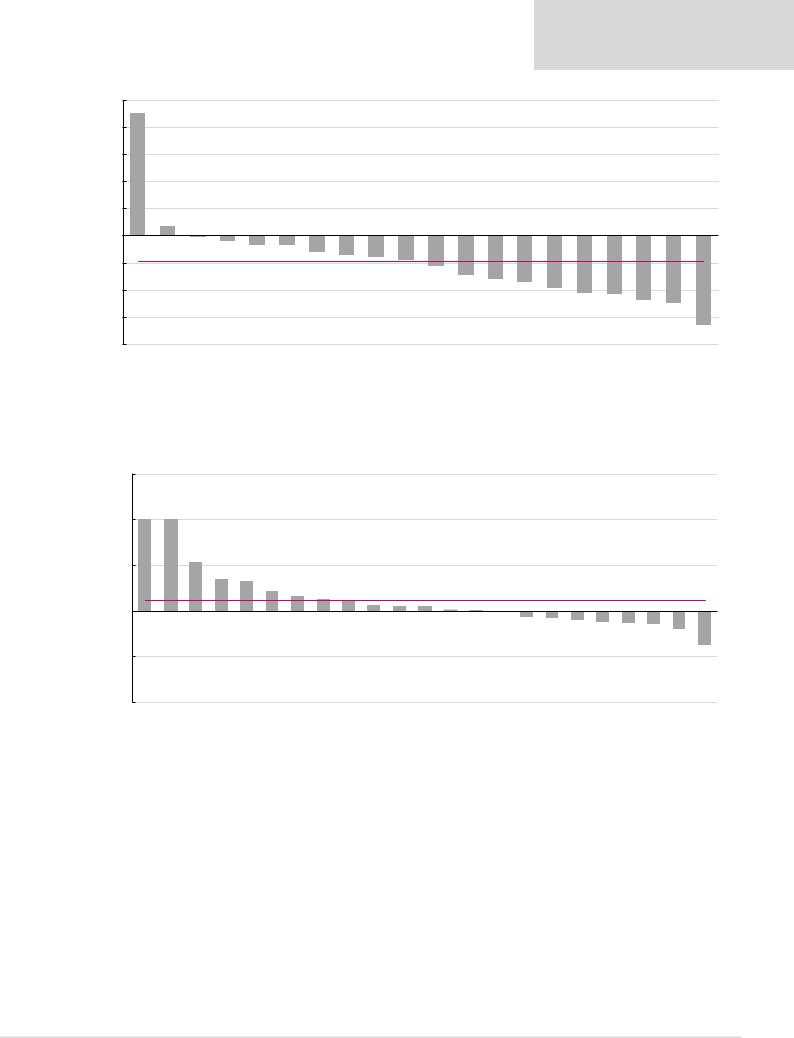
Increased labour productivity and weaker producer currencies have aided a 20% drop in unit costs since 2012.
Figure 25 shows unit cost inflation from June 2012 to June 2017. Companies that increased productivity over the period, such as Fortescue, BHP and Rio Tinto, managed to more than offset mining inflation and posted reductions in unit costs.
Figure 25: Dollar unit cost inflation/(reduction), June 2012-June 2017, % |
|
|
|
|
|
|
|
||||||||||||
30% |
|
19% |
|
|
|
|
|
|
|
|
% Change, Jun 12 - Jun 17 |
|
|
Average |
|
||||
|
|
|
|
|
|
|
|
|
|
|
|
||||||||
|
|
|
|
|
|
|
|
|
|
|
|
||||||||
|
|
|
|
|
|
|
|
|
|
|
|
|
|
|
|
|
|
||
|
|
|
|
|
|
|
|
|
|
|
|
|
|
|
|
|
|
||
|
|
|
|
|
|
|
|
|
|
|
|
|
|
|
|
|
|
|
|
20% |
|
|
|
|
|
|
|
|
|
|
|
|
|
|
|
|
|
|
|
10% |
|
|
7% |
|
|
|
|
|
|
|
|
|
|
|
|
|
|
|
|
|
|
|
|
|
|
|
|
|
|
|
|
|
|
|
|
|
|
|
|
0% |
|
|
|
|
|
|
|
|
|
|
|
|
|
|
|
|
|
|
|
-10% |
|
|
|
-4% |
-6% |
-8% |
|
|
|
|
|
|
|
|
|
|
|
|
|
-20% |
|
|
|
-10% |
-13% |
-13% |
15%- |
15%- |
19%- |
19%- |
19%- |
23%- |
24%- |
25%- |
25%- |
||||
|
|
|
|
|
Average, -20% |
||||||||||||||
|
|
|
|
|
|
|
|
|
|
|
|
|
|
|
|
|
|||
-30% |
|
|
|
|
|
|
|
|
|
|
|
|
|
|
|
|
|
|
|
-40% |
|
|
|
|
|
|
|
|
|
|
|
|
|
|
|
|
|
|
|
-50% |
|
|
|
|
|
|
|
|
|
|
|
|
|
|
|
|
|
|
|
-60% |
|
|
|
|
|
|
|
|
|
|
|
|
|
|
|
|
|
|
|
-70% |
|
|
|
|
|
|
|
|
|
|
|
|
|
|
|
|
|
|
|
-80% |
|
Codelco |
Impala |
AngloGold |
Freeport |
Sibanye |
Lonmin |
SCCO |
Anglo |
Harmony |
Kumba |
Tharisa |
RBPlat |
Amplats |
Northam |
Gold Fields |
Exxaro |
Teck |
|
|
|||||||||||||||||||
|
|
||||||||||||||||||
Note: Glencore, Tharisa, Harmony and Sibanye are calculated from 2013.
Iron ore producers have achieved the biggest cost savings since 2012
-26% |
-26% |
-32% |
-38% |
-45% |
-45% |
|
|
|
|
|
|
|
-67% |
ARM |
Glencore |
South32 |
Vale |
BHP |
Rio Tinto |
Fortescue |
Source: Company data, Renaissance Capital estimates
17