

vk.com/id446425943
Comfortable balance sheets and supportive dividend potential
Net debt reduced to comfortable levels
Renaissance Capital
14 January 2019
Metals & Mining
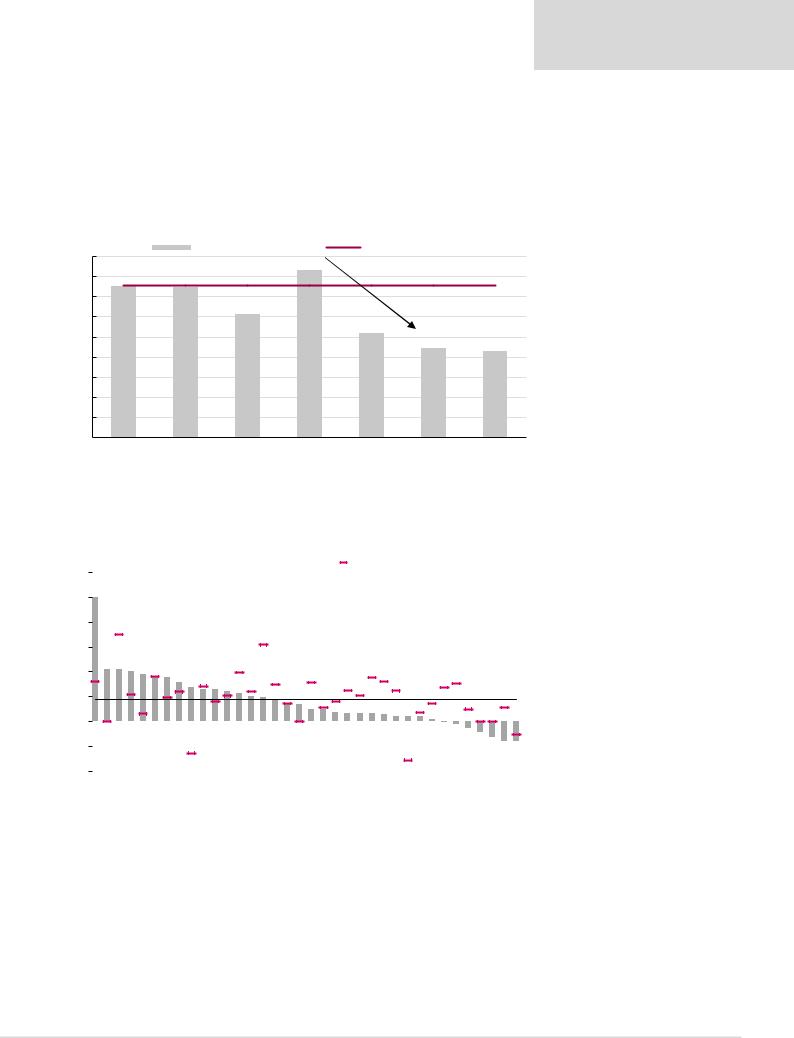
Mining companies have significantly deleveraged their balance sheets since 2015, and we believe comfortable balance sheets position them better for a cyclical downturn.
Net debt levels have reduced to comfortable levels over the past three years, and we believe mining companies may start paying attractive dividends.
Figure 26: Mining sector net debt to EBITDA over time (2012-2018E)
1.8x |
|
Average net debt to EBITDA |
LT average (2003-2018) |
|
|||
|
|
|
1.7x |
|
|
|
|
1.6x |
1.5x |
1.5x |
|
|
LT average (2003-2018), 1.5x |
|
|
1.4x |
|
|
1.2x |
|
|
|
|
|
|
|
|
|
|
|
|
1.2x |
|
|
|
|
1.0x |
|
|
|
|
|
|
|
|
|
|
1.0x |
|
|
|
|
|
0.9x |
0.9x |
|
|
|
|
|
|
|
|
0.8x |
|
|
|
|
|
|
|
0.6x |
|
|
|
|
|
|
|
0.4x |
|
|
|
|
|
|
|
0.2x |
|
|
|
|
|
|
|
0.0x |
|
|
|
|
|
|
|
|
2012 |
2013 |
2014 |
2015 |
2016 |
2017 |
2018E |
Source: Company data, Renaissance Capital
Net debt/EBITDA now at comfortable levels
CY18E net debt to EBITDA ranked
Figure 27: Companies ranked by CY18E net debt/EBITDA compared with their historical averages |
|
|
|
|
|
|
|
|
|
|
|||||||||||||||||||||||||||
6x |
|
|
|
|
|
|
|
|
|
|
|
|
CY18E Net debt/EBITDA |
|
LT average |
|
|
|
|
|
|
|
|
|
|
|
|
||||||||||
|
|
|
|
|
|
|
|
|
|
|
|
|
|
|
|
|
|
|
|
|
|
|
|
|
|||||||||||||
|
|
|
|
|
|
|
|
|
|
|
|
|
|
|
|
|
|
|
|
|
|
|
|
|
|||||||||||||
|
|
|
|
|
|
|
|
|
|
|
|
|
|
|
|
|
|
|
|
|
|
|
|
|
|
|
|
|
|
|
|
|
|
|
|
||
5.0x |
|
|
|
|
|
|
|
|
|
|
|
|
|
|
|
|
|
|
|
|
|
|
|
|
|
|
|
|
|
|
|
|
|
||||
|
|
|
|
|
|
|
|
|
|
|
|
|
|
|
|
|
|
|
|
|
|
|
|
|
|
|
|
|
|
|
|
|
|
||||
5x |
|
|
|
|
|
|
|
|
|
|
|
|
|
|
|
|
|
|
|
|
|
|
|
|
|
|
|
|
|
|
|
|
|
|
|
|
|
|
|
|
|
|
|
|
|
|
|
|
|
|
|
|
|
|
|
|
|
|
|
|
|
|
|
|
|
|
|
|
|
|
|
|
|
||
4x |
|
|
|
|
|
|
|
|
|
|
|
|
|
|
|
|
|
|
|
|
|
|
|
|
|
|
|
|
|
|
|
|
|
|
|
|
|
|
|
|
|
|
|
|
|
|
|
|
|
|
|
|
|
|
|
|
|
|
|
|
|
|
|
|
|
|
|
|
|
|
|
|
|
||
3x |
|
|
|
|
|
|
|
|
|
|
|
|
|
|
|
|
|
|
|
|
|
|
|
|
|
|
|
|
|
|
|
|
|
|
|
|
|
2.1x 2.1x |
2.0x |
1.9x |
1.8x 1.8x |
1.6x |
1.4x |
1.3x 1.3x |
1.2x 1.1x |
|
|
|
|
|
|
|
|
|
|
|
|
|
|
|
|
|
|
|
|
|
|
||||||||
2x |
1.0x 1.0x |
0.9x |
0.7x |
0.7x |
0.5x 0.5x |
0.4x |
0.3x 0.3x 0.3x 0.3x |
0.2x 0.2x 0.2x |
0.1x |
|
|
|
|
|
|
|
|
|
|
|
|||||||||||||||||
|
|
|
|
|
|
|
|
|
|
|
|
|
|
|
|
|
|
|
|
|
|
|
|
|
|
|
|
|
|
|
|
|
|
|
|
||
|
|
|
|
|
|
|
|
|
|
|
|
|
|
|
|
|
|
|
|
|
|
|
|
Sector average, 0.9x |
|||||||||||||
1x |
|
|
|
|
|
|
|
|
|
|
|
|
|
|
|
|
|
|
|
|
|
|
|
|
|||||||||||||
|
|
|
|
|
|
|
|
|
|
|
|
|
|
|
|
|
|
|
|
|
|
|
|
|
|
|
|
|
|
|
|
|
|
|
|
||
0x |
|
|
|
|
|
|
|
|
|
|
|
|
|
|
|
|
|
|
|
|
|
|
|
|
|
|
|
|
|
|
|
|
|
|
|
|
|
|
|
|
|
|
|
|
|
|
|
|
|
|
|
|
|
|
|
|
|
|
|
|
|
0.0x |
0.1x- |
0.3x- |
0.4x- |
0.7x- |
0.8x+- |
0.8x+- |
|||||||
-1x |
|
|
|
|
|
|
|
|
|
|
|
|
|
|
|
|
|
|
|
|
|
|
|
|
|||||||||||||
|
|
|
|
|
|
|
|
|
|
|
|
|
|
|
|
|
|
|
|
|
|
|
|
|
|
|
|
|
|
|
|
|
|
|
|
||
-2x |
|
|
|
|
|
|
|
|
|
|
|
|
|
|
|
|
|
|
|
|
|
|
|
|
|
|
|
|
|
|
|
|
|
|
|
|
|
Northam Sappi Glencore |
Sibanye |
Sasol |
Polymetal Polyus |
PhosAgro |
RBPlats |
Mondi Norilsk |
Gold Fields Fortescue |
AngloGold Evraz |
Russian* |
Others* |
Harmony |
Vale Impala |
BHP |
Anglo NLMK Alrosa Hulamin |
Severstal AMSA Exxaro* |
Rio Tinto Amplats |
MMK |
ARM* |
South32 |
Kumba |
Merafe |
Assore* |
|||||||||||||||
|
|||||||||||||||||||||||||||||||||||||
Noted: Net debt to EDITDA ratio has been limited to 5x. We do not subtract Glencore’s readily marketable inventory from net debt.
*Net debt to EBITDA plus equity-accounted income.
Source: Company data, Renaissance Capital estimates
Sector average net debt/EBITDA of 0.9x
18
vk.com/id446425943
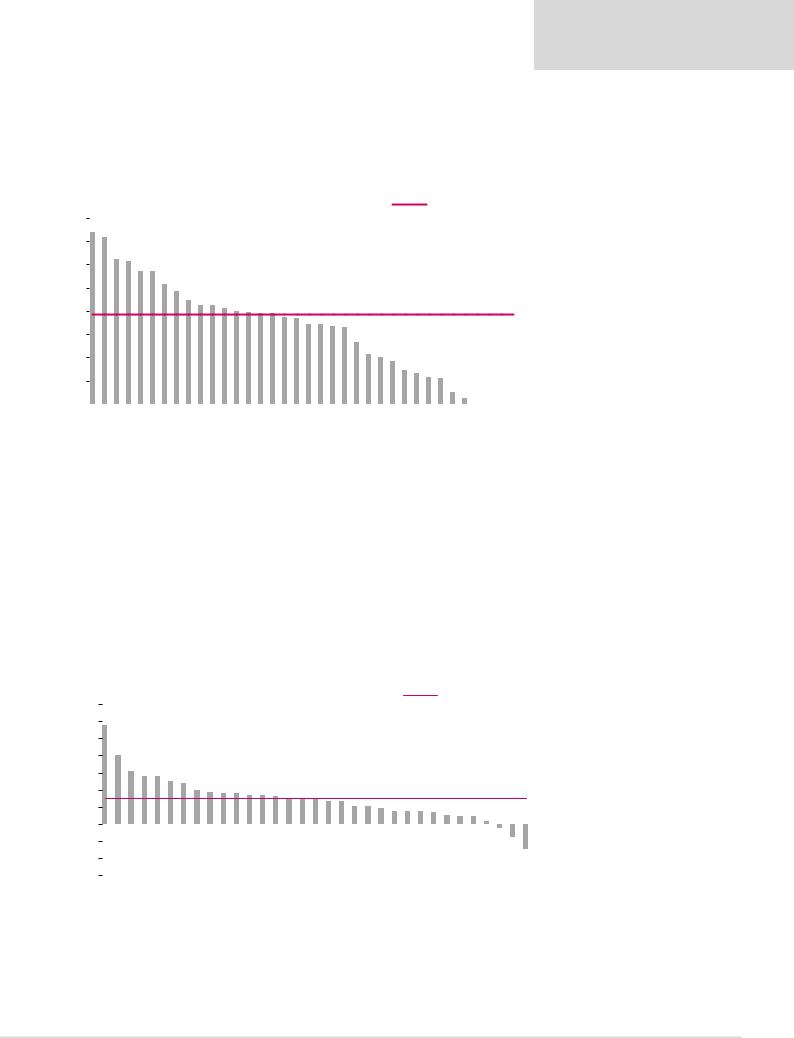
Attractive dividend yields over the next three years…
We forecast average dividend yields of 7.7% over the next three years, with potential upside risk to our forecasts if the current strategy of capital discipline and returning cash to shareholders prevails over the short-to-medium term.
Figure 28: Average dividend yield over next three years (2019-2021E)
16% |
15% |
14% |
|
|
|
Average dividend yield over next 3 years (2019E-2021E) |
|
|
|
|
Sector Average |
|||||||||||||||
|
|
|
|
|
|
|
||||||||||||||||||||
|
|
|
|
|
|
|
||||||||||||||||||||
|
|
|
|
|
|
|
|
|
|
|
|
|
|
|
|
|
|
|
|
|
|
|
||||
|
12% |
12% |
11% 11% |
10% |
10% |
|
|
|
|
|
|
|
|
|
|
|
|
|
|
|
|
|
||||
14% |
|
9% |
9% 8% 8% |
8% 8% |
8% 8% |
7% |
7% |
7% |
7% |
7% 7% |
|
|
|
|
|
|
|
|
||||||||
|
|
|
|
|
|
|
|
|
|
|
|
|
|
|
|
|
|
|
|
|
|
|
|
|
||
12% |
|
|
|
|
|
|
|
|
|
|
|
|
|
|
|
|
|
|
|
|
|
|
|
|
|
|
|
|
|
|
|
|
|
|
|
|
|
|
|
|
|
|
|
|
|
|
|
|
|
|
|
||
10% |
|
|
|
|
|
|
|
|
|
|
|
|
|
|
|
|
|
|
|
|
|
|
|
|
|
|
|
|
|
|
|
|
|
|
|
|
|
|
|
|
|
|
|
|
Sector Average, 7.7% |
||||||||
8% |
|
|
|
|
|
|
|
|
|
|
|
|
|
|
|
|
|
|
||||||||
|
|
|
|
|
|
|
|
|
|
|
|
|
|
|
|
|
|
|
|
|
|
|
|
|
||
6% |
|
|
|
|
|
|
|
|
|
|
|
|
|
|
|
|
|
|
|
|
|
|
|
|
|
|
|
|
|
|
|
|
|
|
|
|
|
|
|
|
|
|
5% 4% |
4% |
4% |
3% |
3% |
|
|
|
|
||
4% |
|
|
|
|
|
|
|
|
|
|
|
|
|
|
|
|
2% |
2% |
|
|
||||||
|
|
|
|
|
|
|
|
|
|
|
|
|
|
|
|
|
|
|
|
|
|
|
|
|
||
2% |
|
|
|
|
|
|
|
|
|
|
|
|
|
|
|
|
|
|
|
|
|
|
|
|
|
|
|
|
|
|
|
|
|
|
|
|
|
|
|
|
|
|
|
|
|
|
|
|
1% |
1% |
0% 0% 0% 0% |
||
|
|
|
|
|
|
|
|
|
|
|
|
|
|
|
|
|
|
|
|
|
|
|
||||
0% |
|
|
|
|
|
|
|
|
|
|
|
|
|
|
|
|
|
|
|
|
|
|
|
|
|
|
Alrosa |
Hulamin Merafe |
Severstal |
NLMK Norilsk |
Evraz |
ARM |
Fortescue |
Glencore Assore Exxaro |
Vale Anglo |
Kumba #N/A |
South32 |
MMK |
Polyus |
Rio Tinto |
BHP Polymetal Sasol Sappi |
Mondi |
Impala |
Harmony |
Gold Fields |
Amplats |
Sibanye AngloGold |
Tharisa |
Lonmin Northam RBPlats AMSA |
||||
|
||||||||||||||||||||||||||
Note: Priced as at market close on 7 January 2019. |
|
|
|
|
|
|
|
|
|
|
|
|
|
|
|
|||||||||||
Source: Company data, Renaissance Capital estimates
Renaissance Capital
14 January 2019
Metals & Mining
We forecast a potential average sector dividend yield of c. 7.7%
…with significant further excess cash available after dividends
We define excess cash as the amount in excess of net debt to EBITDA of 1.5x.
We calculate average cumulative excess cash available for dividends at 30% of market cap over the next three years, despite attractive dividends paid over the period. While we do not have any conviction about the sector’s capital discipline over the medium term, we believe the sector could re-rate over the short term as the market gains visibility on the sector’s yield potential.
Figure 29: Potential average excess cash* as a percentage of market cap over the next three years
140% |
115% |
|
|
|
|
Average excess cash over next 3 years (2019E-2021E), % |
|
|
Sector average |
|
|
|||||||||||
|
|
|
|
|
|
|
|
|||||||||||||||
|
|
|
|
|
|
|
|
|||||||||||||||
|
|
|
|
|
|
|
|
|
|
|
|
|
|
|
|
|
|
|
|
|||
|
|
|
|
|
|
|
|
|
|
|
|
|
|
|
|
|
|
|
|
|
||
120% |
|
|
|
|
|
|
|
|
|
|
|
|
|
|
|
|
|
|
|
|
|
|
|
81% |
62% |
56% 56% |
50% |
48% |
40% |
38% 36% 36% 34% 34% 33% |
31% 30% 29% |
27% 27% |
21% 21% |
19% |
16% 15% |
15% 14% |
11% |
9% 9% |
4% |
|
|
||||
20% |
|
|
|
|||||||||||||||||||
100% |
|
|
|
|
|
|
|
|
|
|
|
|
|
|
|
|
|
|
|
|
|
|
80% |
|
|
|
|
|
|
|
|
|
|
|
|
|
|
|
|
|
|
|
|
|
|
60% |
|
|
|
|
|
|
|
|
|
|
|
|
|
|
|
|
Sector average, 30% |
|||||
40% |
|
|
|
|
|
|
|
|
|
|
|
|
|
|
|
|
||||||
|
|
|
|
|
|
|
|
|
|
|
|
|
|
|
|
|
|
|
|
|
||
0% |
|
|
|
|
|
|
|
|
|
|
|
|
|
|
|
|
|
|
|
|
|
|
|
|
|
|
|
|
|
|
|
|
|
|
|
|
|
|
|
|
|
|
|
||
|
|
|
|
|
|
|
|
|
|
|
|
|
|
|
|
|
|
|
|
|
||
-20% |
|
|
|
|
|
|
|
|
|
|
|
|
|
|
|
|
|
|
|
|
|
|
|
|
|
|
|
|
|
|
|
|
|
|
|
|
|
|
|
|
4%- |
15%- |
30%- |
||
-40% |
|
|
|
|
|
|
|
|
|
|
|
|
|
|
|
|
|
|
||||
|
|
|
|
|
|
|
|
|
|
|
|
|
|
|
|
|
|
|
|
|
||
-60% |
|
|
|
|
|
|
|
|
|
|
|
|
|
|
|
|
|
|
|
|
|
|
Hulamin |
Harmony |
Impala |
ARM* AngloGold |
Merafe |
Assore* |
Sibanye |
South32 Anglo Kumba MMK Exxaro* ArcelorMittal SA |
Amplats Rio Tinto Alrosa |
Norilsk Fortescue |
NLMK Vale |
BHP |
Polyus PhosAgro |
Mondi Severstal |
Polymetal |
RBPlats Sasol |
Evraz Sappi |
Glencore |
Northam |
||||
|
||||||||||||||||||||||
Note: Priced as at market close on 6 January 2019.
*Average excess cash over a three-year period (CY19-21E) at target debt gearing levels (net debt to EBITDA of 1.5x).
Source: Company data, Thomson Reuters, Renaissance Capital estimates
We forecast potential cumulative excess cash after dividends of 30% of the sector’s market cap over the next three years
19
vk.com/id446425943
Value relative to other stocks
Renaissance Capital
14 January 2019
Metals & Mining
IRR captures near-term cash generation and the benefit of long-term growth. What we view as diversified miners’ attractive near-term cash-flow yields support more attractive IRR than other sectors, despite limited earnings growth (Figure 30).
To see how the resource companies under our coverage stack up in terms of long-term value relative to other companies in other sectors, we have constructed a simple model to forecast dividends 10 years out:
1.We use Thomson Reuters consensus EPS and DPS forecasts for the next two years up to 2019. We assume the consensus 2019 forecast represents normalised mid-cycle earnings.
2.We forecast EPS beyond 2019 by assuming 14-16% returns on incremental investment. We use the following formula: Thomson Reuters 2018E EPS forecast + (change in book value per share x RoI%).
3.We calculate DPS as EPS x payout ratio (1 - retention rate).
4.We assume a low retention rate (around 20%) for low-growth companies and we assume retention rates drop to around 50% for high-growth companies.
We assume all companies achieve returns on incremental investment of around 15%
Figure 30: IRR over a 10-year investment period
25%
20%
15%
10%
5%
21.3%
|
|
|
|
|
|
|
|
|
|
|
|
|
|
|
|
|
|
|
|
|
|
|
|
|
|
|
|
|
|
|
|
|
|
|
|
|
|
|
|
|
|
|
|
|
|
|
|
17.9% |
|
|
|
|
|
|
|
|
|
|
|
|
|
|
|
|
|
|
|
|
|
|
|
|
|
|
|
|
|
|
|
|
|
|
|
|
|
|
|
|
|
|
|
|
|
|
|
17.5% |
|
|
|
|
|
|
|
|
|
|
|
|
|
|
|
|
|
|
|
|
|
|
|
|
|
|
|
|
|
|
|
|
|
|
|
|
|
|
|
|
|
|
|
|
|
|
|
|
17.3% |
|
|
|
|
|
|
|
|
|
|
|
|
|
|
|
|
|
|
|
|
|
|
|
|
|
|
|
|
|
|
|
|
|
|
|
|
|
|
|
|
|
|
|
|
|
|
|
|
16.6% |
|
|
|
|
|
|
|
|
|
|
|
|
|
|
|
|
|
|
|
|
|
|
|
|
|
|
|
|
|
|
|
|
|
|
|
|
|
|
|
|
|
|
|
|
|
|
|
|
16.4% |
|
|
|
|
|
|
|
|
|
|
|
|
|
|
|
|
|
|
|
|
|
|
|
|
|
|
|
|
|
|
|
|
|
|
|
|
|
|
|
|
|
|
|
|
|
|
|
|
16.3% 16.3% |
|
|
|
|
|
|
|
|
|
|
|
|
|
|
|
|
|
|
|
|
|
|
|
|
|
|
|
|
|
|
|
|
|
|
|
|
|
|
|
|
|
|
|
|
|
|
|
|
16.1% |
|
|
|
|
|
|
|
|
|
|
|
|
|
|
|
|
|
|
|
|
|
|
|
|
|
|
|
|
|
|
|
|
|
|
|
|
|
|
|
|
|
|
|
|
|
|
|
|
15.6% |
|
|
|
|
|
13.8% 13.7% |
|
|
|
|
|
|
|
|
|
|
|
|
|
|
|
|
|
|
|
|
|
|
|
|
|
|
|
|
|
|
|
|
|
|
|
|
|
|
|
|
|
|
14.6% |
|
|
|
|
|
|
13.0% 13.0% |
|
|
|
|
|
|
|
|
|
|
|
|
|
|
|
|
|
|
|
|
|
|
|
|
|
|
|
|
|
||||
|
|
|
|
|
|
|
14.6% |
14.5% |
|
|
|
|
|
|
|
12.9% 12.8% 12.8% |
|
|
|
|
|
|
|
|
|
|
|
|
|
|
|
|
|
|
|
|
|
|
|
|
|
|
|||||
|
|
|
|
|
|
|
|
14.5% |
|
|
|
|
|
|
|
|
12.6% |
12.3% 12.3% |
|
|
|
|
|
|
|
|
|
|
|
|
|
|
|
|
|
|
|
|
|
|
|||||||
|
|
|
|
|
|
|
|
|
14.1% |
13.6% |
|
|
|
|
|
|
|
|
|
|
|
|
|
|
|
|
|
|
|
|
|
|
|
|
|
|
|
|
|
|
|
||||||
|
|
|
|
|
|
|
|
|
|
14.0% |
|
13.4% |
|
|
|
|
|
|
|
|
|
|
|
|
|
|
|
|
|
|
|
|
|
|
|
|
|
|
|
|
|
|
|
|
|
||
|
|
|
|
|
|
|
|
|
|
|
|
13.2% 13.1% 13.1% |
|
|
|
|
|
12.4% 12.4% |
12.1% 12.1% 12.0% 12.0% 12.0% |
|
|
|
|
|
|
|
|
|
|
|
|
|
|
|
|
|
|
|
|
|
|||||||
|
|
|
|
|
|
|
|
|
|
|
|
|
|
|
|
|
|
|
|
|
|
|
|
|
|
|
|
|
|
|
|
|
|
|
|
|
|
|
|
|
|
||||||
|
|
|
|
|
|
|
|
|
|
|
|
|
|
|
|
|
|
|
|
|
|
|
|
|
|
11.8% 11.7% |
|
|
|
|
|
|
|
|
|
|
|
|
|
|
Average, 11.9% |
||||||
|
|
|
|
|
|
|
|
|
|
|
|
|
|
|
|
|
|
|
|
|
|
|
|
|
|
|
11.6% 11.4% 11.3% |
|
|
|
|
|
|
|
|
|
|
|
|
|
|||||||
|
|
|
|
|
|
|
|
|
|
|
|
|
|
|
|
|
|
|
|
|
|
|
|
|
|
|
|
11.2% 11.1% |
|
|
|
|
|
|
|
|
|
|
|
|
|
|
|
|
|
||
|
|
|
|
|
|
|
|
|
|
|
|
|
|
|
|
|
|
|
|
|
|
|
|
|
|
|
|
|
10.7% 10.6% 10.6% 10.6% |
|
|
|
|
|
|
|
|
|
|
|
|
|
|
|
|
||
|
|
|
|
|
|
|
|
|
|
|
|
|
|
|
|
|
|
|
|
|
|
|
|
|
|
|
|
|
|
|
10.4% |
|
|
|
|
|
|
|
|
|
|
|
|
|
|
|
|
|
|
|
|
|
|
|
|
|
|
|
|
|
|
|
|
|
|
|
|
|
|
|
|
|
|
|
|
|
|
|
|
10.4% 10.3% 10.3% 10.2% |
|
|
|
|
|
|
|
|
|
|
|
|
|
|
|
|
|
|
|
|
|
|
|
|
|
|
|
|
|
|
|
|
|
|
|
|
|
|
|
|
|
|
|
|
|
|
|
10.1% 10.1% 10.1% |
|
|
|
|
|
|
|
|
|
|
|
|
|
||
|
|
|
|
|
|
|
|
|
|
|
|
|
|
|
|
|
|
|
|
|
|
|
|
|
|
|
|
|
|
|
|
|
9.9% 9.9% 9.9% 9.8% |
|
|
|
|
|
|
|
|
|
|
|
|
||
|
|
|
|
|
|
|
|
|
|
|
|
|
|
|
|
|
|
|
|
|
|
|
|
|
|
|
|
|
|
|
|
|
|
|
9.7% 9.7% 9.6% |
|
|
|
|
|
|
|
|
|
|
|
|
|
|
|
|
|
|
|
|
|
|
|
|
|
|
|
|
|
|
|
|
|
|
|
|
|
|
|
|
|
|
|
|
|
|
|
|
9.4% 9.3% |
|
|
|
|
|
|
|
|
|
|
|
|
|
|
|
|
|
|
|
|
|
|
|
|
|
|
|
|
|
|
|
|
|
|
|
|
|
|
|
|
|
|
|
|
|
|
|
|
9.2% 9.2% |
|
|
|
|
|
|
|
|
|
|
|
|
|
|
|
|
|
|
|
|
|
|
|
|
|
|
|
|
|
|
|
|
|
|
|
|
|
|
|
|
|
|
|
|
|
|
|
|
9.2% |
|
|
8.8% |
|
|
|
|
||
|
|
|
|
|
|
|
|
|
|
|
|
|
|
|
|
|
|
|
|
|
|
|
|
|
|
|
|
|
|
|
|
|
|
|
|
|
|
|
9.1% |
|
|
8.5% |
|
|
|
||
|
|
|
|
|
|
|
|
|
|
|
|
|
|
|
|
|
|
|
|
|
|
|
|
|
|
|
|
|
|
|
|
|
|
|
|
|
|
|
|
9.0% |
|
|
8.3% 8.2% |
|
|
||
|
|
|
|
|
|
|
|
|
|
|
|
|
|
|
|
|
|
|
|
|
|
|
|
|
|
|
|
|
|
|
|
|
|
|
|
|
|
|
|
|
8.8% |
|
|
7.6% |
|
|
|
|
|
|
|
|
|
|
|
|
|
|
|
|
|
|
|
|
|
|
|
|
|
|
|
|
|
|
|
|
|
|
|
|
|
|
|
|
|
|
|
|
|
|
|
|
6.6% |
|
|
|
|
|
|
|
|
|
|
|
|
|
|
|
|
|
|
|
|
|
|
|
|
|
|
|
|
|
|
|
|
|
|
|
|
|
|
|
|
|
|
|
|
|
|
|
|
6.4% |
|
|
|
|
|
|
|
|
|
|
|
|
|
|
|
|
|
|
|
|
|
|
|
|
|
|
|
|
|
|
|
|
|
|
|
|
|
|
|
|
|
|
|
|
|
|
|
|
6.2% |
4.2%
0%
|
|
|
|
|
|
|
|
|
|
|
|
|
|
|
|
|
|
|
|
|
|
|
|
|
|
|
|
|
|
|
|
|
|
|
|
|
|
|
|
|
|
|
|
|
|
|
|||||||||||||||||||||||||||||||
Bank |
|
Severstal |
|
Tobacco |
Fortescue |
Construction |
|
Glencore |
Industrial |
Bank |
Beverages |
Bank |
Industrial |
Industrial |
|
Luxury |
Insurance |
|
Pharmaceutical |
Healthcare |
|
|
Inv. |
|
|
|
Diversified… |
Retailer |
Assore Food |
Property |
|
Oil |
|
Life |
|
Healthcare |
Rio |
AssurerLife |
|
Beverages |
Property |
Healthcare |
Amplats |
Beverages |
|
|
|||||||||||||||||||||||||||||||
Motor |
Merafe |
|
Alrosa |
Sasol |
Tech |
|
NLMK |
RBPlat |
Asset… |
Bank |
Polyus |
Exxaro |
AMSA |
Anglo |
|
Norilsk |
|
gas & Oil |
Tech |
Property |
Telecom |
Property |
|
Polymetal |
5 Retailer |
Vale |
1 Tech |
Tech |
Retailer |
|
AngloGold |
|
|
Gold |
South32 |
Sibanye |
|
Telecom |
Retailer |
Retailer Retailer |
Mondi |
BHP |
Retailer |
||||||||||||||||||||||||||||||||||
6 |
Impala Evraz |
|
|
|
|
|
ARM |
|
|
3 |
2 |
2 |
5 |
2 |
1 |
|
goods |
|
MMK |
|
|
|
|
Bank |
Holding |
Retailer |
|
|
|
1 |
|
|
|
4 |
|
& |
Property |
|
|
|
|
Tinto |
|
Bank |
|
|
2 |
3 |
|
|
|
|
Northam |
||||||||||||||||||||||||
|
|
|
|
|
|
|
|
|
1 |
|
|
|
|
|
|
4 |
|
|
|
|
|
|
|
Sappi |
|
|
|
2 |
|
|
3 |
1 |
5 |
Food |
|
|
|
|
|
|
2 |
|
Kumba |
|
|
Assurer |
|
|
|
|
|
|
|
2 |
4 |
8 9 |
|
|
|
|
2 |
|
|||||||||||||||
|
|
|
|
|
|
|
|
|
|
|
|
|
|
|
|
|
|
|
|
|
|
|
|
|
|
|
|
|
|
|
|
|
4 |
|
|
|
|
|
|
2 |
|
|
|
|
|
1 |
|
|
|
|
|
|
1 2 |
2 |
|
|
2 |
|
|
|
|
|
|
|
|
|
|
|
|
|
|||||||
|
|
|
|
|
|
|
|
3 |
|
|
|
|
|
|
|
|
|
|
|
|
|
|
|
|
|
|
|
|
|
|
|
|
1 |
1 |
|
|
3 |
|
|
|
|
|
|
|
6 |
1 |
1 |
|
Fields |
|
|
|
|
3 |
1 |
|
|
|
|
|
|
3 |
|
|
|||||||||||||
|
|
|
|
|
|
|
|
|
|
|
|
|
|
|
|
|
|
|
|
|
|
|
|
|
|
|
|
|
|
|
|
|
|
|
|
|
|
|
|
|
|
|
|
|
|
|
|
|
|
|
|
|
gas |
|
|
Food |
|
|
|
|
|
|
|
|
|
|
|
|
|
|
|
|
|
|
|
||
*Priced at market close on 7 January 2019.
Source: Company data, Thomson Reuters Datastream, Renaissance Capital
20

vk.com/id446425943
Renaissance Capital
14 January 2019
Metals & Mining
Less than a 10-year dividend repayment period for some miners
We calculate that some mining companies could repay their market caps out of dividends over the next 10 years, based on target gearing levels and assuming no further growth projects at value-destructive returns.
While we do not have any conviction about the sector’s capital discipline over the medium term, we believe the sector could re-rate over the short term as the market gains visibility on the sector’s yield potential.
Figure 31: Cumulative 10-year dividends as % of share price
180%
160%
140%
120%
100%
80%
60%
40%
20%
163%
147% |
|
|
|
|
|
|
|
|
|
|
|
|
|
|
|
|
|
|
|
|
|
|
|
|
|
|
|
|
|
|
|
|
|
|
|
|
|
|
|
|
|
|
|
|
|
|
|
|
|
|
|
|
|
|
|
|
144% |
|
|
|
|
|
|
|
|
|
|
|
|
|
|
|
|
|
|
|
|
|
|
|
|
|
|
|
|
|
|
|
|
|
|
|
|
|
|
|
|
|
|
|
|
|
|
|
|
|
|
|
|
|
|
|
|
|
143% |
|
|
121% |
|
|
|
109% |
|
|
|
|
|
|
|
|
|
|
|
|
|
|
|
|
|
|
|
|
|
|
|
|
|
|
|
|
|
|
|
|
|
|
|
|
|
|
|
|
|
|
|
|
|
|
|
|
|
131% |
130% |
|
|
|
|
|
|
|
|
|
|
|
|
|
|
|
|
|
|
|
|
|
|
|
|
|
|
|
|
|
|
|
|
|
|
|
|
|
|
|
|
|
|
|
|
|
|
|
|
|
|
||||
|
|
|
120% |
|
|
|
108% |
|
|
|
|
|
|
|
|
|
|
|
|
|
|
|
|
|
|
|
|
|
|
|
|
|
|
|
|
|
|
|
|
|
|
|
|
|
|
|
|
|
|
|
|
|
|
|||
|
130% |
128% |
|
|
|
|
|
|
|
|
|
|
|
|
|
|
|
|
|
|
|
|
|
|
|
|
|
|
|
|
|
|
|
|
|
|
|
|
|
|
|
|
|
|
|
|
|
|
|
|
|
|||||
|
|
|
|
|
114% |
|
|
|
|
|
|
|
|
|
|
|
|
|
|
|
|
|
|
|
|
|
|
|
|
|
|
|
|
|
|
|
|
|
|
|
|
|
|
|
|
|
|
|
|
|
|
|
|
|
||
|
|
|
|
|
|
|
|
|
|
|
103% |
|
|
|
|
|
|
|
|
|
|
|
|
|
|
|
|
|
|
|
|
|
|
|
|
|
|
|
|
|
|
|
|
|
|
|
|
|
|
|
|
|
|
|
||
|
|
|
|
|
|
111% |
|
|
|
|
|
101% 101% |
|
|
|
|
|
|
|
|
|
|
|
|
|
|
|
|
|
|
|
|
|
|
|
|
|
|
|
|
|
|
|
|
|
|
|
|
|
|
|
|
|
|
||
|
|
|
|
|
|
|
109% |
|
107% 107% |
|
|
100% |
|
|
|
|
|
|
|
|
|
|
|
|
|
|
|
|
|
|
|
|
|
|
|
|
|
|
|
|
|
|
|
|
|
|
|
|
|
|
|
|
|
|||
|
|
|
|
|
|
|
|
|
|
|
104% 104% |
|
|
97% 96% |
|
|
|
|
|
|
|
|
|
|
|
|
|
|
|
|
|
|
|
|
|
|
|
|
|
|
|
|
|
|
|
|
|
|
|
|
|
|
|
|
||
|
|
|
|
|
|
|
|
|
|
|
|
|
|
|
|
95% 95% |
|
|
|
|
|
|
|
|
|
|
|
|
|
|
|
|
|
|
|
|
|
|
|
|
|
|
|
|
|
|
|
|
|
|
|
|
|
|
|
|
|
|
|
|
|
|
|
|
|
|
|
|
|
|
|
|
|
91% |
|
|
|
|
|
|
|
|
|
|
|
|
|
|
|
|
|
|
|
|
|
|
|
|
|
|
|
|
|
|
|
|
|
|
|
|
|
|
|
|
|
|
|
|
|
|
|
|
|
|
|
|
|
|
|
|
|
91% 90% |
|
|
|
|
|
|
|
|
|
|
|
|
|
|
|
|
|
|
|
|
|
|
|
|
|
|
|
|
|
|
|
|
|
|
|
|
|
|
|
|
|
|
|
|
|
|
|
|
|
|
|
|
|
|
|
|
|
89% 89% |
|
|
|
|
|
|
|
|
|
|
|
|
|
|
|
|
|
|
|
|
|
|
|
|
|
|
|
|
|
|
|
|
|
|
|
|
|
|
|
|
|
|
|
|
|
|
|
|
|
|
|
|
|
|
|
|
|
88% |
|
|
|
|
|
|
|
|
|
|
|
|
|
|
|
|
|
|
|
|
|
|
|
|
|
|
|
|
|
|
|
|
|
|
|
|
|
|
|
|
|
|
|
|
|
|
|
|
|
|
|
|
|
|
|
|
|
86% 86% |
|
|
|
|
|
|
|
|
|
|
|
|
|
|
|
|
|
|
|
|
|
|
|
|
|
|
|
|
|
|
|
|
|
||
|
|
|
|
|
|
|
|
|
|
|
|
|
|
|
|
|
|
|
|
|
|
83% |
|
|
|
|
|
|
|
|
|
|
|
|
|
|
|
|
|
|
|
|
|
|
|
Average, 81.4% |
|
|
|
|
||||||
|
|
|
|
|
|
|
|
|
|
|
|
|
|
|
|
|
|
|
|
|
|
|
|
82% 81% 81% 81% |
|
|
|
|
|
|
|
|
|
|
|
|
|
|
|
|
|
|
|
|
|
|
|
|
|
|||||||
|
|
|
|
|
|
|
|
|
|
|
|
|
|
|
|
|
|
|
|
|
|
|
|
|
80% |
|
|
|
|
|
|
|
|
|
|
|
|
|
|
|
|
|
|
|
|
|
|
|
|
|
|
|
|
|
||
|
|
|
|
|
|
|
|
|
|
|
|
|
|
|
|
|
|
|
|
|
|
|
|
|
|
|
77% |
|
|
|
|
|
|
|
|
|
|
|
|
|
|
|
|
|
|
|
|
|
|
|
|
|
|
|
||
|
|
|
|
|
|
|
|
|
|
|
|
|
|
|
|
|
|
|
|
|
|
|
|
|
|
|
|
72% 71% |
|
|
|
|
|
|
|
|
|
|
|
|
|
|
|
|
|
|
|
|
|
|
|
|
|
|
||
|
|
|
|
|
|
|
|
|
|
|
|
|
|
|
|
|
|
|
|
|
|
|
|
|
|
|
|
|
|
|
|
|
|
|
|
|
|
|
|
|
|
|
|
|
|
|
|
|
|
|
|
|
|
|||
|
|
|
|
|
|
|
|
|
|
|
|
|
|
|
|
|
|
|
|
|
|
|
|
|
|
|
|
|
|
70% 69% |
|
|
|
|
|
|
|
|
|
|
|
|
|
|
|
|
|
|
|
|
|
|
|
|
||
|
|
|
|
|
|
|
|
|
|
|
|
|
|
|
|
|
|
|
|
|
|
|
|
|
|
|
|
|
|
|
68% 67% |
|
|
|
|
|
|
|
|
|
|
|
|
|
|
|
|
|
|
|
|
|
|
|
||
|
|
|
|
|
|
|
|
|
|
|
|
|
|
|
|
|
|
|
|
|
|
|
|
|
|
|
|
|
|
|
|
|
66% 66% 66% |
|
|
|
|
|
|
|
|
|
|
|
|
|
|
|
|
|
|
|
|
|
||
|
|
|
|
|
|
|
|
|
|
|
|
|
|
|
|
|
|
|
|
|
|
|
|
|
|
|
|
|
|
|
|
|
|
65% |
|
|
|
|
|
|
|
|
|
|
|
|
|
|
|
|
|
|
|
|
||
|
|
|
|
|
|
|
|
|
|
|
|
|
|
|
|
|
|
|
|
|
|
|
|
|
|
|
|
|
|
|
|
|
|
|
|
59% |
|
|
|
|
|
|
52% 52% |
|
|
|
|
|
|
|
|
|
|
|
||
|
|
|
|
|
|
|
|
|
|
|
|
|
|
|
|
|
|
|
|
|
|
|
|
|
|
|
|
|
|
|
|
|
|
|
|
|
57% |
|
|
|
|
|
|
|
|
|
|
|
|
|
|
|
|
|||
|
|
|
|
|
|
|
|
|
|
|
|
|
|
|
|
|
|
|
|
|
|
|
|
|
|
|
|
|
|
|
|
|
|
|
|
|
|
|
|
|
|
|
51% 50% |
|
|
|
|
|
|
|
|
|
|
|||
|
|
|
|
|
|
|
|
|
|
|
|
|
|
|
|
|
|
|
|
|
|
|
|
|
|
|
|
|
|
|
|
|
|
|
|
|
|
56% |
54% |
|
|
|
|
49% 49% |
46% |
|
|
|
|
|
|
|||||
|
|
|
|
|
|
|
|
|
|
|
|
|
|
|
|
|
|
|
|
|
|
|
|
|
|
|
|
|
|
|
|
|
|
|
|
|
|
|
54% |
54% |
|
|
|
|
|
45% |
42% |
|
|
|
|
|||||
|
|
|
|
|
|
|
|
|
|
|
|
|
|
|
|
|
|
|
|
|
|
|
|
|
|
|
|
|
|
|
|
|
|
|
|
|
|
|
|
52% |
|
|
48% 48% 47% |
|
|
|
|
|
|
|
||||||
|
|
|
|
|
|
|
|
|
|
|
|
|
|
|
|
|
|
|
|
|
|
|
|
|
|
|
|
|
|
|
|
|
|
|
|
|
|
|
|
|
|
|
|
|
|
|
44% 44% 43% 43% |
36% 35% |
|
|
|
|||||
|
|
|
|
|
|
|
|
|
|
|
|
|
|
|
|
|
|
|
|
|
|
|
|
|
|
|
|
|
|
|
|
|
|
|
|
|
|
|
|
|
|
|
|
|
|
|
|
|
|
|
|
|
|
|||
|
|
|
|
|
|
|
|
|
|
|
|
|
|
|
|
|
|
|
|
|
|
|
|
|
|
|
|
|
|
|
|
|
|
|
|
|
|
|
|
|
|
|
|
|
|
|
|
|
|
|
|
|
|
|
|
|
|
|
|
|
|
|
|
|
|
|
|
|
|
|
|
|
|
|
|
|
|
|
|
|
|
|
|
|
|
|
|
|
|
|
|
|
|
|
|
|
|
|
|
|
|
|
|
|
|
|
|
|
|
34% |
|
|
|
|
|
|
|
|
|
|
|
|
|
|
|
|
|
|
|
|
|
|
|
|
|
|
|
|
|
|
|
|
|
|
|
|
|
|
|
|
|
|
|
|
|
|
|
|
|
|
|
|
|
|
|
|
|
29% |
|
|
|
|
|
|
|
|
|
|
|
|
|
|
|
|
|
|
|
|
|
|
|
|
|
|
|
|
|
|
|
|
|
|
|
|
|
|
|
|
|
|
|
|
|
|
|
|
|
|
|
|
|
|
|
|
|
28% |
|
|
|
|
|
|
|
|
|
|
|
|
|
|
|
|
|
|
|
|
|
|
|
|
|
|
|
|
|
|
|
|
|
|
|
|
|
|
|
|
|
|
|
|
|
|
|
|
|
|
|
|
|
|
|
|
|
24% |
|
|
|
|
|
|
|
|
|
|
|
|
|
|
|
|
|
|
|
|
|
|
|
|
|
|
|
|
|
|
|
|
|
|
|
|
|
|
|
|
|
|
|
|
|
|
|
|
|
|
|
|
|
|
|
|
|
0%
Merafe |
|
|
Evraz |
|
NLMK |
Anglo |
Polyus |
Norilsk |
MMK |
Asset… |
Sappi |
Assore |
Property |
|
AngloGold |
Rio |
|
|
Kumba |
Bank |
Telecom |
|
|
RBPlat |
Bank Bank |
Retailer Retailer5 |
Amplats |
Food |
|
Diversified… |
Sibanye |
|
|
Beverages |
|
Industrial |
HoldingInv. |
Harmony |
Beverages |
|
Retailer |
Beverages |
Retailer |
|
Tech4 |
|||||||||||||||||||||||||||||||
Fortescue |
Impala |
|
|
Severstal |
|
Glencore |
Polymetal |
Exxaro |
Property |
Tobacco |
Property |
South32 |
|
Property |
Gold |
Oil |
Property |
4 Bank |
Telecom |
Oil |
Construction |
|
|
Industrial |
Industrial |
Retailer |
|
Life |
Pharmaceutical |
Insurance |
Retailer |
Healthcare |
Luxury |
Healthcare |
Healthcare |
Retailer |
|
Life |
|
Retailer |
||||||||||||||||||||||||||||||||||||
|
|
|
|
ARM |
|
|
|
|
|
|
3 |
|
|
5 |
|
|
Vale |
|
Fields |
& |
|
|
1 |
gas & |
|
|
Motor |
Mondi |
|
1 |
8 |
|
Assurer |
|
|
|
|
|
9 Retailer goods |
3 |
1 |
|
Food |
Assurer |
Tech |
|
||||||||||||||||||||||||||||||
|
|
Alrosa |
|
|
|
|
|
|
|
|
|
|
|
|
|
|
|
|
|
|
|
|
Bank |
|
|
|
2 |
|
|
|
2 |
|
|
BHP |
|
|
6 1 |
|
|
|
|
|
|
Food |
|
|
|
|
3 Tech |
|
|
|
3 |
|
|
|
|
|
|
Bank |
|
1 |
|
|
|
|
||||||||||
|
|
|
|
|
|
|
|
|
|
|
|
|
|
|
|
|
|
|
|
|
|
|
|
|
|
AMSA |
|
|
2 |
|
|
4 |
|
|
|
|
|
|
|
|
|
2 |
|
|
|
|
|
|
|
10 |
2 |
|||||||||||||||||||||||||
|
|
|
Sasol |
|
|
|
|
|
|
|
|
|
|
|
|
|
|
|
|
|
|
4 |
1 |
|
|
gas |
2 |
|
|
|
|
1 |
1 |
|
|
|
|
2 |
|
|
|
2 |
2 |
|
|
|
|
3 |
|
|
|
|
|
|
|
|
6 |
1 |
|
1 |
1 |
|
||||||||||||||
|
|
|
|
|
|
|
|
|
|
|
|
|
|
|
|
|
|
|
|
|
|
|
|
5 |
|
|
Tinto |
|
|
|
|
|
|
|
|
|
|
|
|
|
|
|
|
|
|
|
|
1 |
|
|
|
|
|
|
2 |
|
|
|
|
|
|
3 |
3 |
2 |
|
|
|
|
|
|||||||
*Priced at market close on 7 January 2019.
Source: Company data, Thomson Reuters, Renaissance Capital
21