


vk.com/id446425943
Preference for base metals over steelmaking materials
We forecast falling prices for coal, iron ore and manganese over the medium term, given that they are trading above the 90th percentile of cost curves.
We are constructive on base metals, some of which are trading well below the 90th percentile, rendering significant parts of the respective industries cash burning.
Thematically, from a demand perspective, we also prefer base metals over steelmaking materials (iron ore, metallurgical coal and manganese).
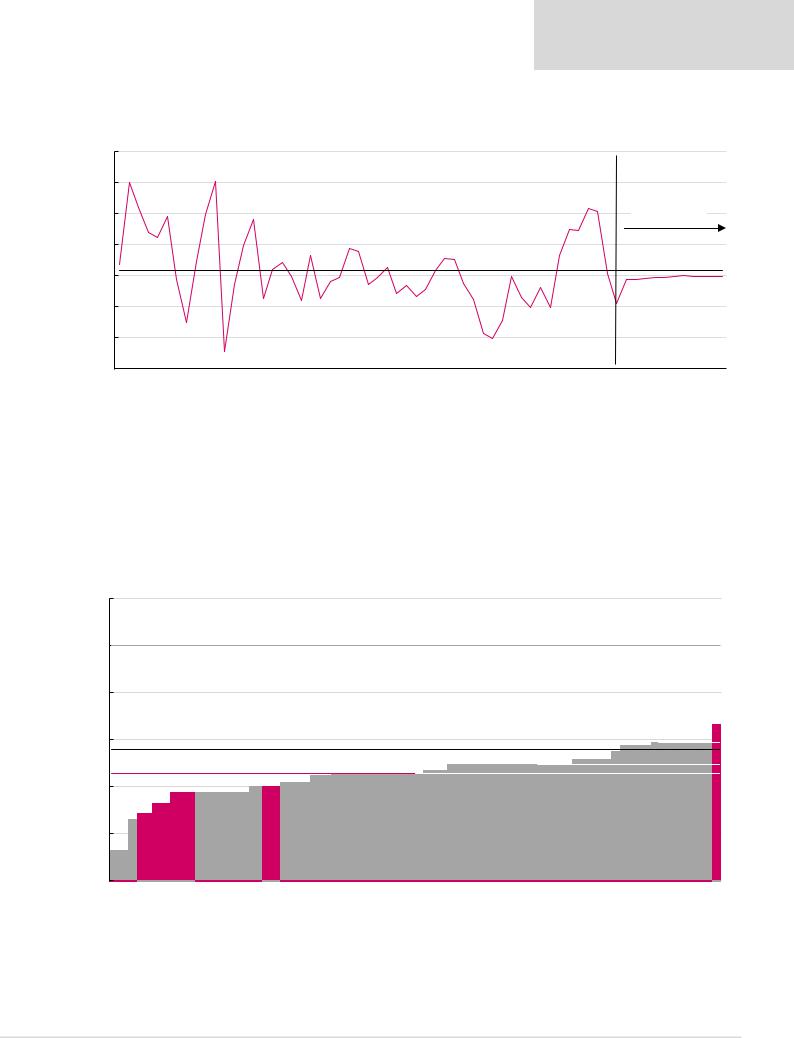
Figure 35: Spot commodity price premium (discount) to 90th percentile
60% |
|
|
|
|
|
|
|
|
|
|
47% |
|
|
|
|
|
|
|
|
|
|
50% |
|
|
|
|
|
|
|
|
|
|
|
|
|
|
|
|
|
|
|
|
|
40% |
|
|
|
|
|
|
|
|
|
|
|
|
|
|
|
|
|
|
|
|
|
30% |
|
|
|
|
|
|
|
|
|
|
|
23% |
20% |
19% |
|
|
|
|
|
|
|
|
|
|
|
|
|
|
|
|
||
20% |
|
|
|
|
|
|
|
|
|
|
|
|
|
|
6% |
|
|
|
|
|
|
10% |
|
|
|
|
4% |
|
|
|
|
|
|
|
|
|
|
|
|
|
|
||
0% |
|
|
|
|
|
|
|
|
|
|
|
|
|
|
|
|
-2% |
|
|
|
|
-10% |
|
|
|
|
|
|
|
|
|
|
|
|
|
|
|
|
|
|
|
|
|
-20% |
|
|
|
|
|
|
|
|
|
|
|
|
|
|
|
|
|
-15% |
-16% |
|
|
|
|
|
|
|
|
|
|
|
|
|
-30% |
|
|
|
|
|
|
|
|
|
|
Met. Coal, $222/t |
|
Gold**, $1281/t |
Iron ore, $74/t |
Thermal coal, $98/t |
|
Copper, $5904/t |
Zinc*, $2575/t |
Aluminium, $1866/t |
-25% |
|
|
Manganese ore, $7/t |
PGM***, $1107/t |
Nickel, $11081/t |
*Used commodity/company data for 2017. **Used commodity data for 3Q17.
***PGM basket price calculated using 57% Pt, 36% Pd, 7% Rh. Note: Priced as at 8 January 2019.
Source: Bloomberg, Company data, Renaissance Capital estimates
Renaissance Capital
14 January 2019
Metals & Mining
Some commodities trading above cost support
Many of our commodity price forecasts are below spot. Our long-term commodity price forecasts are supported by industry costs and we calculate these prices would result in poor industry average returns on new projects (below 9%), which we do not think would incentivise over-supply.
Management focus remains on cash-flow returns and perceived investment risk remains high for lenders.
We calculate incentive prices in the following charts as the commodity price required for a Incentive prices to achieve a 10% IRR project with industry average cash costs and industry average capital intensity to achieve
a 10% IRR.
25
vk.com/id446425943
Steel
Renaissance Capital
14 January 2019
Metals & Mining
Steel margins have fallen below mid-cycle levels due to the recent decline in steel prices and elevated prices for inputs such as coking coal, manganese and iron ore prices.
Figure 36: Real steel replacement cost margins and near-term forecasts, $/t |
|
|
|
|
|
|
|
|
|
|
|
|
|
|
|
|
|
|
|||||||||||||
350 |
|
|
|
|
|
|
|
|
|
|
|
|
|
|
|
|
|
|
|
|
|
|
|
|
|
|
|
|
|
|
|
300 |
|
|
|
302 |
|
|
|
|
|
|
|
|
|
|
|
|
|
|
|
|
|
|
|
|
|
|
|
|
|
|
|
300 |
|
|
|
|
|
|
|
|
|
|
|
|
|
|
|
|
|
|
|
|
|
|
|
|
|
|
|
|
|
|
|
|
|
|
|
|
|
|
241 |
|
|
|
|
|
|
|
|
|
|
|
|
|
|
|
|
258 |
|
|
|
|
|
|
|
250 |
|
|
|
|
|
|
|
|
|
|
|
|
|
|
|
|
|
|
|
|
|
|
|
|
|
|
Forecasts |
|
|
||
|
|
|
|
|
|
|
|
|
|
|
|
|
|
|
|
|
|
|
|
|
|
|
|
|
|
|
|
|
|||
200 |
|
|
|
|
|
|
|
|
|
|
|
|
|
|
|
|
|
|
|
|
|
|
|
|
|
|
|
|
|
|
|
$/t |
|
|
|
|
|
|
|
|
|
|
|
|
|
|
|
|
|
|
Average, 158 |
|
|
|
|
|
|
|
|
|
|
||
150 |
|
|
|
|
|
|
|
|
|
|
|
|
|
|
|
|
|
|
|
|
|
|
|
|
|
|
|
|
|
|
|
|
|
|
|
|
|
|
|
|
|
|
|
|
|
|
|
|
|
|
|
|
|
|
|
|
|
|
|
|
|
|
148 |
100 |
|
|
|
|
|
|
|
|
|
|
|
|
|
|
|
|
|
|
|
|
|
|
|
|
|
|
105 |
|
|
|
|
|
|
|
|
|
|
|
|
|
|
|
|
|
|
|
|
|
|
|
|
|
|
|
|
|
|
|
|
|
|
|
|
50 |
|
|
|
75 |
|
|
|
|
|
|
|
|
|
|
|
|
|
|
|
|
|
|
|
|
|
|
|
|
|
|
|
|
|
|
|
|
|
|
|
|
|
|
|
|
|
|
|
|
|
|
|
49 |
|
|
|
|
|
|
|
|
|
|
|
0 |
|
|
|
|
29 |
|
|
|
|
|
|
|
|
|
|
|
|
|
|
|
|
|
|
|
|
|
|
|
|
|
|
|
|
|
|
|
|
|
|
|
|
|
|
|
|
|
|
|
|
|
|
|
|
|
|
|
Spot |
|
|
|
|
|
|
Mar 06 |
Sep 06 |
Mar 07 |
Sep 07 |
Mar 08 |
Sep 08 |
Mar 09 |
Sep 09 |
Mar 10 |
Sep 10 |
Mar 11 |
Sep 11 |
Mar 12 |
Sep 12 |
Mar 13 |
Sep 13 |
Mar 14 |
Sep 14 |
Mar 15 |
Sep 15 |
Mar 16 |
Sep 16 |
Mar 17 |
Sep 17 |
Mar 18 |
Sep 18 |
Sep 19 |
Mar 20 |
Sep 20 |
Mar 21 |
Sep 21 |
|
Source: Bloomberg, Renaissance Capital estimates
However, we maintain our cautious view on steel prices due to: 1) spare installed capacity, which could result in potential oversupply if utilisation rates increase; 2) demand headwinds as China rebalances its economy from fixed asset investment-heavy to consumer-led; and 3) rising sector capex levels, which could result in sector capacity growth ahead of demand.
Steel cost curve (global supply of 458mnt)
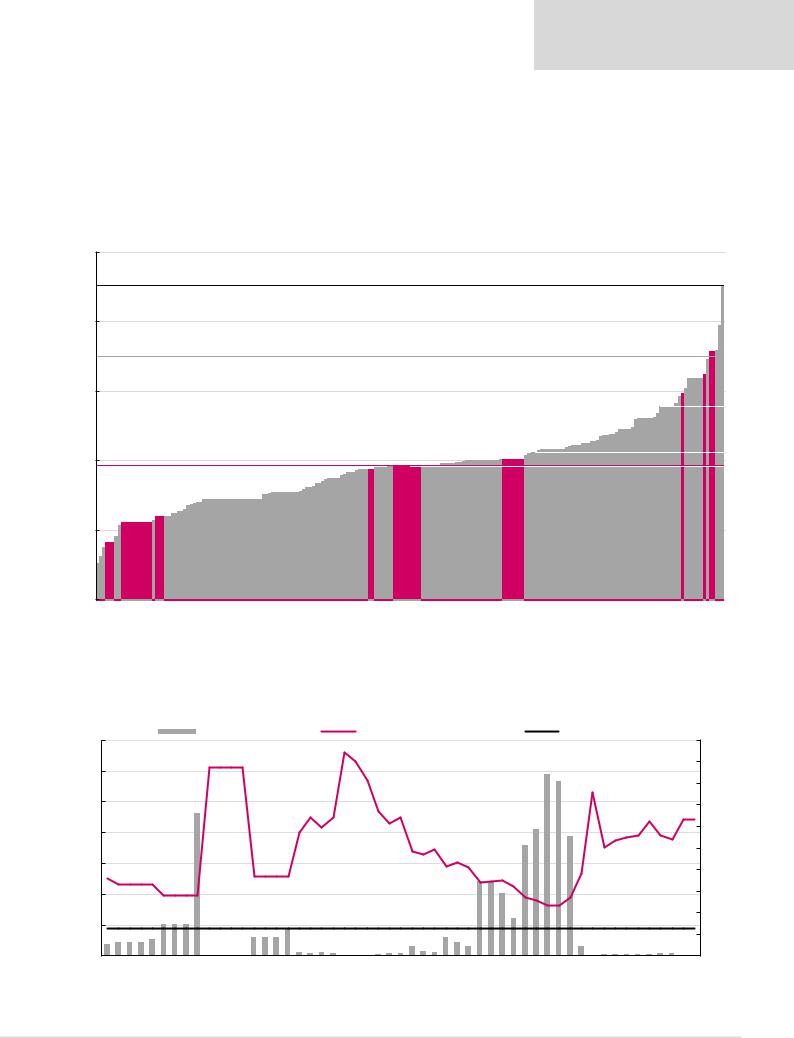
Figure 37: 2017 steel cash costs net of by-product credits plus capex, $/t
800
|
700 |
Incentive price: $700/t |
|
||
|
|
|
|
|
|
|
600 |
|
|
|
|
$/t |
500 |
Spot price: $480/t* |
|
||
|
|
|
|||
|
|
Average cash cost: $428/t |
|
||
|
400 |
Severstal,344 |
|
|
MMK, 401 |
|
300 |
Evraz,363 |
NLMK,388 |
||
|
|
|
|
|
|
|
200 |
|
|
|
|
90th percentile: $494/t 70th percentile: $448/t
50th percentile: $429/t
AMSA, 533
Note: Priced as at 8 January 2018.
Source: Bloomberg, Company data, Renaissance Capital estimates
26
vk.com/id446425943
Metallurgical coal
We believe metallurgical coal spot prices of $221/t are unsustainable given our view that prices above $180/t incentivise new supply (10% IRR for average metallurgical coal projects). Lower steel prices could reduce demand for steelmaking materials or result in capacity cuts, which could weigh on metallurgical coal prices.
Renaissance Capital
14 January 2019
Metals & Mining
Lower steel margins could put pressure on steelmaking material prices
Metallurgical coal cost curve (632mnt)
Figure 38: 2018E metallurgical coal cash costs plus sustaining capex, $/t
240
Spot price: $221/t*
200
Incentive price: $180/t
160
$/t
120 |
Average cash cost: $117/t |
|
Resources,Teck 117 |
AngloAmerican, 121 |
||
80 |
73Evraz, |
84BHP, |
88Mechel, |
Glencore, 115 |
||
|
|
|
|
|
|
|
40 |
|
|
|
|
|
|
90th percentile: $151/t
70th percentile: $125/t
50th percentile: $117/t
|
170 Vale, 183 |
South32, 159 |
Severstal, |
*Priced as at 8 January 2019.
Source: Bloomberg, CRU, Renaissance Capital estimates
We believe spot metallurgical coal prices make the entire industry cash-flow positive. We see no risk of capacity cuts.
Figure 39: Percentage of metallurgical coal cost curve that is cash burning over time
350 |
|
|
|
|
% Cash burning |
|
|
|
330 |
Hard coking coal - spot, $/t |
|
|
84.0% |
Average LT cash burn |
|
|
100% |
||||||||||||||
|
|
|
|
|
|
|
|
|
|
|
|
|
|
|
|
|
|
|
|
|
|
|
|
|
|
|
|
|
|||
|
|
|
|
|
|
|
305 |
|
|
|
|
|
|
|
|
|
|
|
|
|
|
81.0% |
|
|
|
|
|
|
90% |
||
300 |
|
|
|
|
|
|
|
|
|
|
|
|
|
|
|
|
|
|
|
|
|
|
|
|
|
|
|
|
|||
|
|
|
|
|
|
|
|
|
|
|
|
|
|
|
|
|
|
|
|
|
|
|
|
|
|
|
|
|
|||
|
|
|
|
|
|
|
|
|
|
|
|
|
|
|
|
|
|
|
|
|
|
|
|
|
266 |
|
|
|
|
|
|
|
|
|
|
|
66.0% |
|
|
|
|
|
|
|
|
|
|
|
|
|
|
|
|
|
|
|
|
|
|
|
|
80% |
|
|
|
|
|
|
|
|
|
|
|
|
|
|
|
|
|
|
|
|
|
|
|
|
|
|
|
|
|
|
|
||
250 |
|
|
|
|
|
|
|
|
|
|
|
|
|
|
|
|
|
|
|
|
|
58.5% |
|
55.5% |
|
|
|
|
222 |
70% |
|
200 |
|
|
|
|
|
|
|
|
|
|
|
|
|
|
|
|
|
|
|
|
51.0% |
|
|
|
|
|
|
60% |
|||
|
|
|
|
|
|
|
|
|
|
|
|
|
|
|
|
|
|
|
|
|
|
|
|
|
|
|
|||||
|
|
|
|
|
|
|
|
|
|
|
|
|
|
|
|
|
|
|
|
|
|
|
|
|
|
|
|
|
188 |
50% |
|
150 |
|
|
|
|
|
|
|
|
|
|
|
|
|
|
|
|
|
|
|
|
|
|
|
|
|
|
|
|
|
||
|
|
|
|
|
|
|
|
|
|
|
|
|
|
|
|
|
|
|
|
|
|
|
|
|
|
|
|
|
|
40% |
|
$/t |
|
|
|
|
|
|
|
|
|
|
|
|
|
|
|
|
|
|
|
|
34.5% 34.0% |
29.0% |
|
|
|
|
|
|
|
|
|
|
|
|
|
|
|
|
|
|
|
|
|
|
|
|
|
|
|
|
|
|
|
|
|
|
|
|
|
|
|||
100 |
|
|
|
14.5% 14.5% 14.5% |
|
98 |
|
|
12.5% |
|
|
|
|
|
|
|
|
|
|
|
|
17.5% |
|
|
|
|
|
|
|
|
30% |
|
|
|
|
|
|
|
|
|
|
|
|
|
|
|
|
|
|
|
|
|
|
|
|
|
|
|
|||||
|
5.5% 6.0% 6.0% 6.0% |
7.5% |
|
|
|
8.5% 8.5% 8.5% |
|
|
|
|
|
|
|
|
8.5% |
6.0% |
|
|
|
81 |
Average LT cash burn, 12.6% |
20% |
|||||||||
|
|
|
|
|
|
|
|
|
|
|
|
|
|
|
|
||||||||||||||||
50 |
|
0.0% 0.0% 0.0% 0.0% |
1.5% 1.0% 1.5% 1.0% |
0.0% 0.0% 0.0% 0.5% 1.0% 1.0% |
4.5% |
2.0% 1.5% |
4.5% |
|
|
4.5% |
0.0% 0.5% 0.5% 0.5% 0.5% 0.5% 1.0% 1.0% |
0.0% 0.0% |
|
||||||||||||||||||
|
|
|
|
10% |
|||||||||||||||||||||||||||
|
|
|
|
|
|||||||||||||||||||||||||||
|
|
|
|
|
|
||||||||||||||||||||||||||
0 |
Mar 06 |
Sep 06 |
Mar 07 |
Sep 07 |
Mar 08 |
Sep 08 |
Mar 09 |
Sep 09 |
Mar 10 |
Sep 10 |
Mar 11 |
Sep 11 |
Mar 12 |
Sep 12 |
|
Mar 13 |
Sep 13 |
|
Mar 14 |
Sep 14 |
Mar 15 |
Sep 15 |
Mar 16 |
Sep 16 |
Mar 17 |
Sep 17 |
Mar 18 |
Sep 18 |
Spot |
0% |
|
|
|
|
|
||||||||||||||||||||||||||||
Source: Bloomberg, CRU, Renaissance Capital estimates
27
vk.com/id446425943
Renaissance Capital
14 January 2019
Metals & Mining
From a longer-term perspective, we are cautious on coking coal demand and prices:
1.Given our cautious outlook for Chinese steel demand growth; and
2.Over the medium term, we expect Chinese steel production to shift from blast furnace to electric arc furnace, which would likely add pressure on coking coal demand and prices.
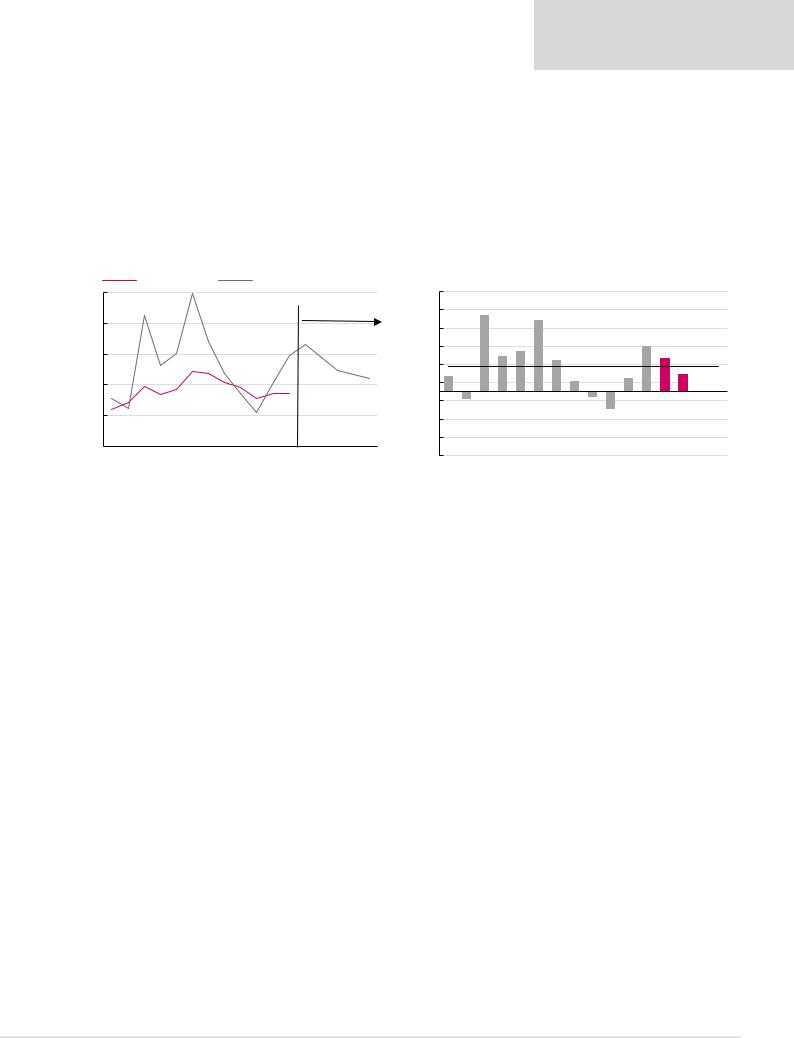
Our long-term metallurgical coal price forecast of $150/t is based on cost support of the 90th percentile of the cost curve.
Figure 40: Met coal price vs cash costs at the 90th percentile |
Figure 41: Met coal price premium (discount) to the 90th percentile |
|
Cash costs, $/t |
Met coal average price. $/t |
|
290 |
|
|
|
|
|
|
|
|
|
|
|
|
|
|
|
|
|
110% |
|
|
84% |
|
|
79% |
|
|
|
|
|
|
|
|
|
|
|
|
|
|
|
|
|
|
|
|
|
|
Forecasts |
|
90% |
|
|
|
|
|
|
|
|
|
|
|
|
||||
|
|
|
|
|
|
|
|
|
|
|
|
|
206 |
|
|
|
|
|
|
|
|
|
|
|
|
|
|
|
||||
240 |
|
|
|
|
|
|
|
|
|
|
|
188 |
|
|
|
|
|
|
|
|
|
44% |
|
|
|
|
|
|
49% |
|
|
|
|
101 |
112 |
138 |
125 |
132 |
162 |
158 |
143 |
135 |
118 |
126 |
185 |
164 |
157 |
150 |
30% |
17% |
|
|
38% |
|
34% |
11% |
|
|
15% |
36% |
19% |
||||
|
|
|
|
|
|
|
|
|
|
|
|
|
|
|
|
|
|
70% |
|
|
|
|
|
|
|
|
|
|
|
|
|
|
190 |
|
|
|
|
|
|
|
|
|
|
|
|
|
|
|
|
|
50% |
|
|
|
|
|
|
|
|
|
|
|
|
|
|
|
|
|
|
|
|
|
|
|
|
|
|
|
|
|
|
|
|
|
|
|
|
|
|
|
|
|
|
|
|
|
|
|
|
|
|
|
|
|
|
|
|
|
|
|
|
|
|
|
|
|
10% |
|
|
|
|
|
|
|
|
Historical average, 28% |
|||||
140 |
|
|
|
|
|
|
|
|
|
|
|
|
|
|
|
|
|
|
|
|
|
|
|
|
|
|
|
|
|
|
|
|
|
|
|
|
|
|
|
|
|
|
|
|
126 |
|
|
|
|
|
-10% |
|
9%- |
|
|
|
|
|
|
-7% |
20%- |
|
|
|
|
90 |
|
|
|
|
|
|
|
|
|
|
|
|
|
|
|
|
-30% |
|
|
|
|
|
|
|
|
|
|
|
||||
|
|
|
|
|
|
|
|
|
|
|
|
|
|
|
|
|
|
|
|
|
|
|
|
|
|
|
|
|
|
|
||
|
|
|
|
|
|
|
|
|
|
|
|
|
|
|
|
|
|
|
|
|
|
|
|
|
|
|
|
|
|
|
|
|
40 |
|
|
|
|
|
|
|
|
|
|
|
|
|
|
|
|
|
-50% |
|
|
|
|
|
|
|
|
|
|
|
|
|
|
2006 |
2007 |
2008 |
2009 |
2010 |
2011 |
2012 |
2013 |
2014 |
2015 |
2016 |
2017 |
2018E |
2019E |
2020E |
2021E |
LT (real) |
-70% |
|
|
|
|
|
|
|
|
|
|
|
|
|
|
|
|
2006 |
2007 |
2008 |
2009 |
2010 |
2011 |
2012 |
2013 |
2014 |
2015 |
2016 |
2017 |
2018E |
2019E |
||||||||||||||||||
|
|
|||||||||||||||||||||||||||||||
2% |
|
|
|
|
|
|
|
|
|
|
|
-5% |
|
|
2020E |
2021E |
|||
*Cash costs net of by-product credits plus sustaining capex.
Source: Bloomberg, CRU, Renaissance Capital estimates |
Source: Bloomberg, CRU, Renaissance Capital estimates |
28