

vk.com/id446425943
Our long-term commodity prices should not incentivise over-supply
Renaissance Capital
14 January 2019
Metals & Mining
Our long-term commodity prices are determined with reference to industry cost support rather than incentive price levels. We use the 90th percentile on cost curves as a reference point for our long-term commodity prices.
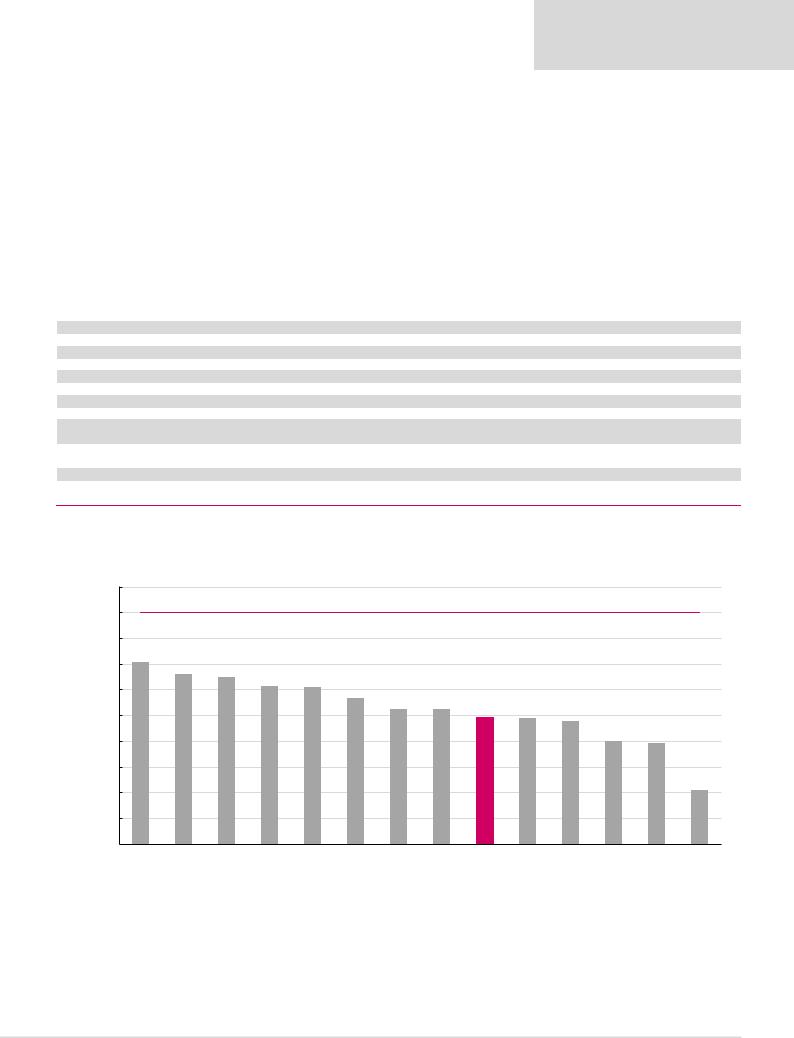
Figures 81 and 82 show that at our long-term commodity price and margin forecasts, which are below spot levels in many cases, new greenfield project returns will fall short of WACC, on average.
Our commodity price forecasts over the medium term are well below incentive price levels and could lead to several years of under-investment.
Figure 81: Expected average returns on new greenfield projects
|
Zinc, |
PGMs, |
Iron ore, |
Met |
Thermal |
Gold, |
Nickel, |
Potash, |
Copper, |
Diamonds, Manganese, Pigment, |
Aluminium, |
||
|
$/t |
$/oz |
$/t |
coal, $/t |
coal, $/t |
$/oz |
$/t |
$/t |
$/t |
$/carat |
$/mtu |
$/t |
$/t |
Capital intensity* |
5,000 |
3,000 |
170 |
300 |
120 |
3,500 |
40,000 |
900 |
20,000 |
550 |
7.00 |
8,000 |
6,000 |
Long-term prices Average unit cash cost
Average EBITDA per unit
EBITDA margin
Maintenance capex
Tax @ 30%
Net profit
Annual returns on commissioned projects Estimated IRR (construction time and limited life)
Implied incentive price @10% IRR
2,700 |
1,127 |
60 |
150 |
-1,518 |
-694 |
-35 |
-108 |
1,182 |
433 |
25 |
42 |
44% |
38% |
41% |
28% |
-551 |
-80 |
-5 |
-9 |
-189 |
-106 |
-6 |
-10 |
441 |
247 |
14 |
23 |
|
|
|
|
8.8% |
8.2% |
8.1% |
7.7% |
7.1% |
6.6% |
6.5% |
6.1% |
3,000 |
1,400 |
80 |
180 |
*Cost of new greenfield project in dollars per annual production unit.
Figure 82: Expected average IRRs on new greenfield projects
|
10% |
|
|
|
|
9% |
|
|
|
% |
8% |
7.1% |
|
|
|
|
|
||
return,of |
6% |
6.6% |
|
|
|
7% |
6.5% |
|
|
|
|
|
6.1% |
6.1% |
rate |
5% |
|
|
|
Internal |
|
|
|
|
4% |
|
|
|
|
|
3% |
|
|
|
|
2% |
|
|
|
|
1% |
|
|
|
0%
Zinc |
PGMs |
Iron ore |
Met coal |
Thermal coal |
80 |
1,250 |
14,000 |
270 |
6,300 |
205 |
5.20 |
3,000 |
2,150 |
-62 |
-670 |
-8,256 |
-150 |
-3,459 |
-142 |
-4.40 |
-2,200 |
-1,707 |
18 |
580 |
5,744 |
120 |
2,841 |
63 |
0.80 |
800 |
443 |
23% |
46% |
41% |
44% |
45% |
31% |
15% |
27% |
21% |
-5 |
-227 |
-2,000 |
-36 |
-1,102 |
-16 |
-0.30 |
-240 |
-220 |
-4 |
-106 |
-1,123 |
-25 |
-522 |
-14 |
-0.15 |
-168 |
-67 |
9 |
247 |
2,621 |
59 |
1,217 |
33 |
0.35 |
392 |
156 |
7.6% |
7.1% |
6.6% |
6.5% |
6.1% |
6.0% |
5.0% |
4.9% |
2.6% |
6.1% |
5.7% |
5.2% |
5.2% |
4.9% |
4.8% |
4.0% |
3.9% |
2.1% |
89 |
1,600 |
17,400 |
350 |
8,200 |
260 |
6.00 |
3,900 |
3,000 |
Source Renaissance Capital estimates
WACC, 9%
5.7%
5.2% |
5.2% |
4.9% |
4.9% |
|
|
|
4.8% |
4.0% 3.9%
2.1%
Gold |
Nickel |
Potash |
Average |
Copper |
Diamonds |
Manganese |
Pigment |
Aluminium |
Source: Renaissance Capital estimates
46

vk.com/id446425943
Earnings revisions
Figures 83-84 summarise the changes to our earnings forecasts, as we incorporate revised commodity price and currency forecasts and make slight changes to our cost and volume assumptions in some cases.
Figure 83: Earnings for December year-ends
Dec-YE |
2018E |
2019E |
2020E |
2021E |
2022E |
Alrosa – adjusted EPS forecasts, RUB |
|
|
|
|
|
New |
14.12 |
15.08 |
15.88 |
14.49 |
14.42 |
Old |
15.22 |
14.64 |
14.76 |
13.57 |
14.24 |
% change |
-7% |
3% |
8% |
7% |
1% |
Thomson Reuters consensus |
14.72 |
15.89 |
16.05 |
|
|
RenCap compared with consensus |
-4% |
-5% |
-1% |
|
|
Anglo American – underlying EPS forecasts, USc |
|
|
|
|
|
New |
247 |
255 |
210 |
190 |
199 |
Old |
253 |
279 |
235 |
210 |
219 |
% change |
-2% |
-9% |
-11% |
-9% |
-9% |
Thomson Reuters consensus |
246 |
250 |
228 |
|
|
RenCap compared with consensus |
0% |
2% |
-8% |
|
|
Exxaro – diluted HEPS forecasts, ZAc |
|
|
|
|
|
New |
2,214 |
2,235 |
1,857 |
1,871 |
1,889 |
Old |
2,224 |
2,200 |
2,016 |
1,976 |
1,997 |
% change |
0% |
2% |
-8% |
-5% |
-5% |
Thomson Reuters consensus |
2,747 |
2,723 |
2,422 |
|
|
RenCap compared with consensus |
-19% |
-18% |
-23% |
|
|
Glencore – underlying EPS forecasts, USc |
|
|
|
|
|
New |
48 |
40 |
42 |
46 |
47 |
Old |
46 |
47 |
43 |
43 |
46 |
% change |
4% |
-15% |
-2% |
7% |
2% |
Thomson Reuters consensus |
48 |
45 |
45 |
|
|
RenCap compared with consensus |
-1% |
-12% |
-6% |
|
|
Kumba Iron Ore – HEPS forecasts, ZAc |
|
|
|
|
|
New |
2,607 |
2,473 |
1,983 |
1,945 |
2,027 |
Old |
2,428 |
2,161 |
2,112 |
2,051 |
2,136 |
% change |
7% |
14% |
-6% |
-5% |
-5% |
Thomson Reuters consensus |
2,552 |
2,474 |
2,119 |
|
|
RenCap compared with consensus |
2% |
0% |
-6% |
|
|
Merafe – underlying EPS forecasts, ZAc |
|
|
|
|
|
New |
32 |
22 |
25 |
16 |
17 |
Old |
39 |
30 |
35 |
29 |
23 |
% change |
-17% |
-25% |
-30% |
-45% |
-25% |
Thomson Reuters consensus |
35 |
28 |
29 |
|
|
RenCap compared with consensus |
-8% |
-21% |
-14% |
|
|
Rio Tinto – underlying EPS forecasts, USc |
|
|
|
|
|
New |
493 |
458 |
437 |
429 |
440 |
Old |
491 |
490 |
463 |
461 |
497 |
% change |
0% |
-7% |
-6% |
-7% |
-11% |
Thomson Reuters consensus |
505 |
476 |
477 |
|
|
RenCap compared with consensus |
-3% |
-4% |
-8% |
|
|
Vale – underlying EPS forecasts, USc |
|
|
|
|
|
New |
157 |
147 |
136 |
134 |
140 |
Old |
159 |
150 |
135 |
130 |
134 |
% change |
-1% |
-2% |
1% |
3% |
4% |
Thomson Reuters consensus |
138 |
167 |
150 |
|
|
RenCap compared with consensus |
14% |
-12% |
-10% |
|
|
Note: Priced at market close on 7 January 2019.
Source: Thomson Reuters, Company data, Renaissance Capital estimates
Renaissance Capital
14 January 2019
Metals & Mining
47

vk.com/id446425943
Figure 84: Earnings for June year-ends
Jun-YE |
2019E |
2020E |
2021E |
2022E |
2023E |
African Rainbow Minerals – HEPS forecasts, ZAc |
|
|
|
|
|
New |
2,670 |
1,840 |
1,749 |
1,724 |
1,996 |
Old |
2,522 |
1,831 |
1,722 |
1,772 |
2,011 |
% change |
6% |
1% |
2% |
-3% |
-1% |
Thomson Reuters consensus |
2,406 |
1,987 |
2,129 |
|
|
RenCap compared with consensus |
11% |
-7% |
-18% |
|
|
Assore – HEPS forecasts, ZAc |
|
|
|
|
|
New |
5,045 |
3,709 |
3,761 |
3,612 |
3,529 |
Old |
4,826 |
3,906 |
3,955 |
3,954 |
3,854 |
% change |
5% |
-5% |
-5% |
-9% |
-8% |
Thomson Reuters consensus |
5,328 |
3,903 |
4,186 |
|
|
RenCap compared with consensus |
-5% |
-5% |
-10% |
|
|
BHP – underlying EPS forecasts, USc |
|
|
|
|
|
New |
174 |
152 |
145 |
160 |
169 |
Old |
175 |
174 |
156 |
169 |
179 |
% change |
-1% |
-13% |
-7% |
-5% |
-6% |
Thomson Reuters consensus |
184 |
166 |
174 |
|
|
RenCap compared with consensus |
-6% |
-9% |
-17% |
|
|
Fortescue – underlying EPS forecasts, USc |
|
|
|
|
|
New |
38 |
32 |
29 |
30 |
29 |
Old |
36 |
35 |
34 |
37 |
37 |
% change |
5% |
-7% |
-15% |
-18% |
-20% |
Thomson Reuters consensus |
31.2 |
26.0 |
29.0 |
|
|
RenCap compared with consensus |
21% |
24% |
0% |
|
|
South32 – underlying EPS forecasts, USc |
|
|
|
|
|
New |
23.8 |
19.7 |
19.9 |
20.0 |
20.5 |
Old |
28.2 |
23.9 |
21.1 |
21.6 |
22.2 |
% change |
-16% |
-18% |
-6% |
-7% |
-8% |
Thomson Reuters consensus |
26.8 |
24.5 |
24.6 |
|
|
RenCap compared with consensus |
-11% |
-19% |
-19% |
|
|
Note: Priced at market close on 7 January 2019.
Source: Thomson Reuters, Company data, Renaissance Capital estimates
Renaissance Capital
14 January 2019
Metals & Mining
48

vk.com/id446425943
Risks and catalysts
Our earnings forecasts and valuations are based on assumptions detailed in this report. Our forecasts are subject to downside risks, including the following:
▪Lower-than-forecast commodity prices.
▪Stronger-than-forecast producer currencies.
▪High global debt levels. The IMF recently warned that public and private sector debt has increased to $164trn or 225% of global GDP in 2018. This is higher than its previous peak in 2009.
▪Trade barriers. US President Donald Trump has implemented steel and aluminium tariffs that could affect demand for aluminium producers’ volumes. A full-blown global trade war could have a negative impact on global economic growth.
▪Supply growth from a recent ramp-up of latent capacity that was mothballed during the low commodity price environment in 2015 and 2016.
▪Value-destruction through poor capital allocation – unexpected value-destructive acquisitions or the approval of marginal projects. The Norilsk shareholder shootout transaction could influence our earnings forecasts and valuation materially, with a wide range of potential outcomes.
▪Resource nationalism, including risks of higher mining taxes and royalties, pressure on miners to spend more on communities or the environment and possibly outright expropriation of mining assets. We do not see this theme disappearing and believe there could be upside risk to miners’ spending on royalties, taxes and communities.
▪Increased government regulation in producer countries, which could negatively affect profitability.
▪Higher-than-forecast mining inflation, especially if recovering demand puts pressure on scarce resources and skills.
▪Higher-than-forecast maintenance capex – miners need to spend more capex to maintain volumes as mining complexity increases. Underestimating maintenance capex would negatively affect our valuations.
▪Infrastructure constraints and shortages of skills, electricity and water in mining regions could affect production and costs more than we expect.
▪Overestimation of mineral reserves.
Potential catalysts for outperformance
Short term
1.Weaker producer currencies could offset lower commodity prices to some extent and support mining company margins.
2.Prudent capital allocation and higher dividends. We believe investors tend to steer clear of miners with low dividend payout ratios, as this could suggest: 1) management teams’ desire to spend shareholder cash on potentially low-return acquisitions or projects; and/or 2) a lack of confidence in profitability. Higher dividends reduce the risk of value destruction through poor capital allocation.
Medium term
1.Electric vehicle production growth and growth in wind and solar power generation could boost demand for copper, nickel, aluminium and cobalt.
Renaissance Capital
14 January 2019
Metals & Mining
49
vk.com/id446425943
Renaissance Capital
14 January 2019
Metals & Mining
2.China’s environmental policies support demand for higher-grade ore and limit new aluminium capacity, while its Belt and Road Initiative could underpin demand for infrastructure-related commodities
3.Falling production from existing mines. Falling grades and increasing mining complexity are likely to result in volume declines at existing mining operations and push up production costs. Miners with long-life, low-cost resources should benefit as competitors face more volume and cost pressure.
4.Delays in expected new supply from approved projects. Mining projects are becoming more difficult owing to: 1) permitting and environmental issues; 2) infrastructure constraints; 3) competition for skilled labour and mining equipment; 4) new and riskier geographies; 5) growing resource nationalism; and 6) difficulties in accessing finance.
5.Spot commodity prices do not incentivise new production and sector capex remains at decade lows, which we believe should limit new supply over the medium term. The next generation of mines are likely to be more complex and higher-cost than currently installed capacity. Miners with long-life resources should eventually benefit from much higher incentive prices and a superior cost base.
6.Share buybacks: Recovering FCF generation by miners should result in surplus cash. We have not factored share buybacks into our forecasts, but these could support share prices.
7.Lower-than-expected cost of capital, as projects and acquisitions are debt financed at historically low interest rates.
8.Continued low interest rates, which could: 1) stimulate industrial demand; and 2) increase investment demand for commodities more than we expect.
9.Technological change, including a major shift towards fuel cells and increasing aluminium intensity in motor vehicles.
Long term
1.Sector consolidation. If the sector becomes starved of new supply over the medium term, commodity prices should eventually rise closer to incentive price levels. At that point, we think miners would be likely to target volume growth, rather than cash preservation. Given that some miners are trading below replacement cost, we think it could be cheaper for companies to buy de-risked, producing competitors with low-cost assets than to build risky new greenfield projects with up to a 10-year lag to positive cash flows. Low interest rates could reduce the cost of capital for acquisitions. In our view, this would:
a.continue to constrain new supply to the market as ‘capex’ invested in sector consolidation does not result in incremental global supply.
b.be likely to push up mining company valuations much closer to replacement cost, which is significantly above current share prices.
2.Higher incentive prices to make existing miners more competitive. We believe next-generation mines are likely to be lower-grade, more complex and face more regulatory issues than existing producers. We therefore believe commodity prices higher than historical trends may be required to incentivise the next generation of mines. This would effectively move existing low-cost, long-life miners down the cost curve and enhance their margins.
50