

vk.com/id446425943
Iron ore
We forecast falling iron ore prices.
1)Low-cost supply continues to grow as Vale, Samarco, BHP, Rio Tinto and Minas Rio ramp up.
2)Steel prices have fallen to levels that put pressure on steel company margins. This could lead to capacity curtailments and weigh on demand for steelmaking materials.
3)Chinese iron ore port inventories are still at highly elevated levels of around 38 days of consumption.
4)Steel demand growth could be lacklustre as the Chinese property market cools down and stimulus slows. A decline in Chinese steel intensity per capita to developed consumer economy levels such as the US poses a potential structural headwind over the longer term.
5)We see the potential for scrap substituting iron ore as China matures.
6)We forecast longer-term cost support around the 90th percentile at $60/t, and calculate incentive prices at $80/t.
Renaissance Capital
14 January 2019
Metals & Mining
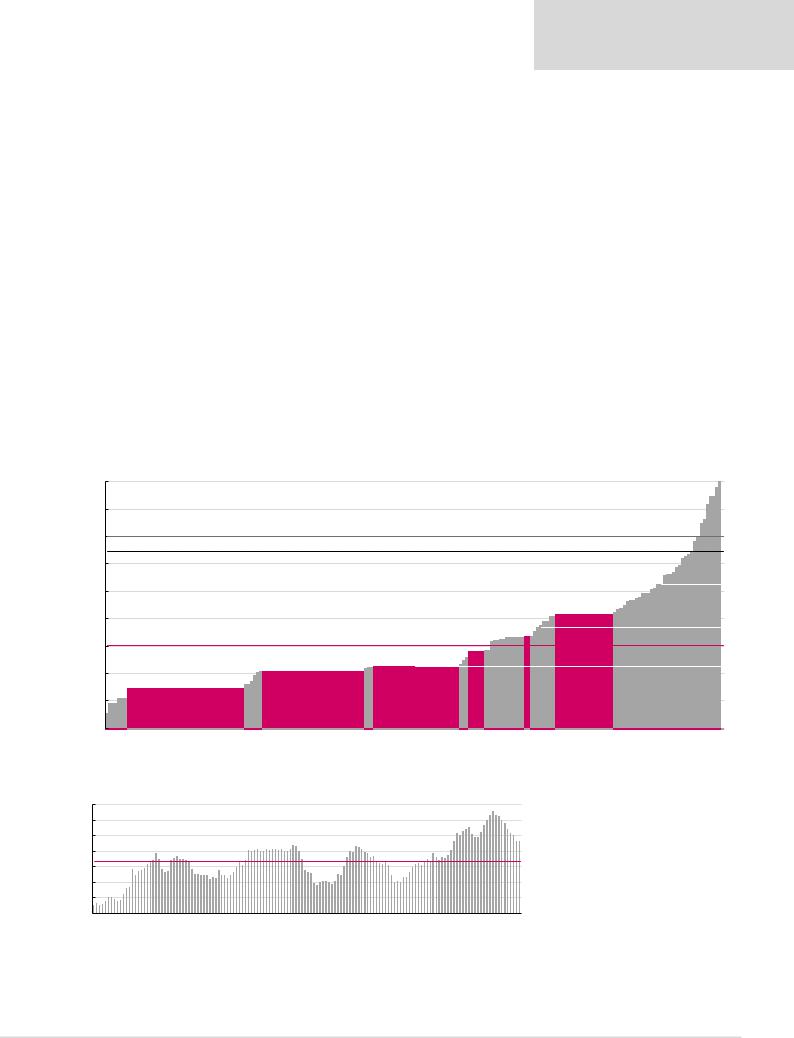
Iron ore cost curve (1,724mnt)
Figure 42: 2018E iron ore cash costs plus sustaining capex, $/t
100 |
|
|
|
|
|
90 |
|
|
|
|
|
80 |
Incentive price: $80/t |
|
|
|
|
Spot price: $74/t* |
|
|
|
|
|
|
|
|
|
|
|
70 |
|
|
|
|
|
60 |
|
|
|
|
|
$/t |
|
|
|
|
|
50 |
|
|
|
|
|
40 |
Average cash cost: $40/t |
|
|
|
43 |
|
|
|
|
||
|
25Vale, |
31Tinto,Rio |
33BHP, |
Kumba, 38 |
|
30 |
Assmang, |
||||
|
|
|
|
|
|
20 |
|
|
|
|
|
10 |
|
|
|
|
|
*Priced as at 8 January 2019.
Figure 43: Iron ore Chinese port inventory days compared with the iron ore price (RHS) over time, $/t |
|
|||||
50 |
|
|
|
|
|
48 |
|
|
|
|
|
|
|
45 |
|
|
|
|
43 |
4138 |
|
|
36 |
36 |
|
||
40 |
|
34 |
34 |
|
||
35 |
|
|
|
|
||
29 |
29 |
31 |
|
|
|
|
30 |
|
|
|
|
||
Average Chinese stock days, 32 |
|
25 |
|
|
||
25 |
|
|
|
|
|
|
20 |
17 |
|
|
|
|
|
|
|
|
|
|
|
|
15 |
|
|
|
|
|
|
07-Jan 07-Jun 07-Nov 08-Apr 08-Sep 09-Feb 09-Jul 09-Dec 10-May 10-Oct 11-Mar 11-Aug 12-Jan 12-Jun 12-Nov 13-Apr 13-Sep 14-Feb 14-Jul 14-Dec 15-May 15-Oct 16-Mar 16-Aug 17-Jan 17-Jun 17-Nov 18-Apr 18-Sep
Note: Calculated as Chinese inventory/Chinese iron ore demand*1.6*365.
Source: Bloomberg, Renaissance Capital
90th percentile: $62/t
51 |
70th percentile: $47/t |
|
|
Fortescue, |
50th percentile: $33/t |
|
Source: Bloomberg, CRU, Renaissance Capital estimates
Chinese port inventories are still at elevated levels, which supports our view of falling prices in the medium term
29
vk.com/id446425943
Renaissance Capital
14 January 2019
Metals & Mining
We calculate that only 8% of iron ore producers are cash-burning at current spot prices, which is not enough to provide cost support in a weakening demand environment, in our view.
Figure 44: Percentage of iron ore cost curve that is cash-burning over time
|
200 |
|
|
|
|
|
|
% Cash burning |
|
|
|
|
Iron ore fines (62% Fe, CIF China), $/t |
|
|
|
|
|
Average LT cash burn |
|
|
|
|
|
50.0% |
|||||||||||||||||||||
|
|
|
|
|
|
|
189 |
|
|
|
|
|
|
|
|
|
|
184 |
|
|
|
|
|
|
|
|
|
|
|
|
|
|
|
|
|
|
|
|
|
|
|
|
|
|
||
|
|
|
|
|
|
|
|
|
|
|
|
|
|
|
|
|
|
|
|
|
|
|
|
|
|
|
|
|
|
|
|
|
|
|
|
|
|
|
|
|
|
|
|
|
||
|
180 |
|
|
|
|
|
|
|
|
|
|
|
|
|
|
|
|
|
|
|
|
|
|
|
|
|
|
|
|
|
|
37.5% |
|
|
|
|
|
|
|
|
|
|
|
|
|
45.0% |
|
160 |
32.5% |
|
|
|
|
|
|
|
32.5% |
|
|
|
|
|
|
|
|
|
|
|
|
|
136 |
|
|
33.5% |
|
|
|
|
|
|
|
|
|
|
|
|
|
|
|
|
40.0% |
||
|
|
|
|
|
|
|
|
|
|
|
|
|
|
|
|
|
|
|
|
|
|
|
|
|
|
|
29.5% |
|
|
|
|
|
|
|
|
|
|
|
|
|
||||||
|
140 |
|
|
|
|
|
|
|
|
|
|
|
|
|
|
|
|
|
|
|
|
|
|
|
|
|
|
26.0% |
|
|
|
|
|
|
|
|
|
|
|
|
35.0% |
|||||
|
120 |
|
|
|
|
|
|
|
|
|
|
|
|
|
|
|
|
|
|
|
|
|
|
|
|
|
20.0% |
24.0% |
21.5% |
|
|
|
|
|
|
|
|
|
|
30.0% |
||||||
|
100 |
|
|
|
|
|
|
|
|
|
|
|
|
|
|
|
|
|
|
|
|
|
|
|
|
|
|
86 |
|
|
|
|
|
|
|
|
25.0% |
|||||||||
|
80 |
|
|
13.0% |
|
|
|
|
|
|
|
|
|
|
|
|
|
|
|
|
|
|
|
|
|
|
|
|
|
|
|
|
|
|
|
74 |
20.0% |
|||||||||
|
|
|
|
|
|
|
|
|
|
|
|
|
|
|
|
|
|
|
|
|
|
|
|
|
|
|
|
|
|
|
|
|
|
|
||||||||||||
|
60 |
|
|
|
|
|
|
|
|
|
|
|
|
|
|
|
|
|
|
|
|
|
|
|
|
|
|
|
|
|
|
|
|
|
|
15.0% |
||||||||||
|
|
|
|
|
|
|
|
|
|
|
|
|
|
|
|
|
|
|
|
|
|
|
|
|
|
|
|
|
|
|
|
|
|
|
|
|||||||||||
|
40 |
|
|
61 |
|
|
|
|
|
|
|
|
Average LT cash burn, 9.4% |
|
|
|
|
|
|
|
|
|
|
|
|
|
|
|
|
|
|
10.0% |
||||||||||||||
$/t |
18.5% |
15.0% |
19.5% |
5.0% |
1.5% |
|
|
12.0% |
16.0% |
4.0% |
2.5% |
|
|
|
|
|
|
3.5% 3.5% |
|
3.5% |
2.5% 2.5% |
3.0% |
6.0% |
13.5% |
16.0% |
10.0% |
1.5% |
8.5% |
4.5% |
8.5% |
6.5% |
11.5% |
12.0% |
7.0% |
4.5% |
|||||||||||
20 |
0.0% 0.0% 0.0% |
0.5% |
1.0% |
0.5% |
1.0% |
0.5% 0.5% 0.5% 0.5% 1.0% |
0.5% 0.5% |
1.0% |
5.0% |
|||||||||||||||||||||||||||||||||||||
|
|
|||||||||||||||||||||||||||||||||||||||||||||
|
-0 |
Mar 06 |
|
Sep 06 |
Mar 07 |
|
Sep 07 |
Mar 08 |
Sep 08 |
|
Mar 09 |
|
Sep 09 |
|
Mar 10 |
|
Sep 10 |
Mar 11 |
Sep 11 |
Mar 12 |
Sep 12 |
Mar 13 |
|
Sep 13 |
Mar 14 |
|
Sep 14 |
|
Mar 15 |
|
Sep 15 |
|
Mar 16 |
|
Sep 16 |
|
Mar 17 |
|
Sep 17 |
|
Mar 18 |
|
Sep 18 |
|
Spot |
0.0% |
|
|
|
|
|
|
|
|
|
|
|
|
|
|
|
|
|
|
|
|
|||||||||||||||||||||||||||
Source: Bloomberg, CRU, Renaissance Capital estimates
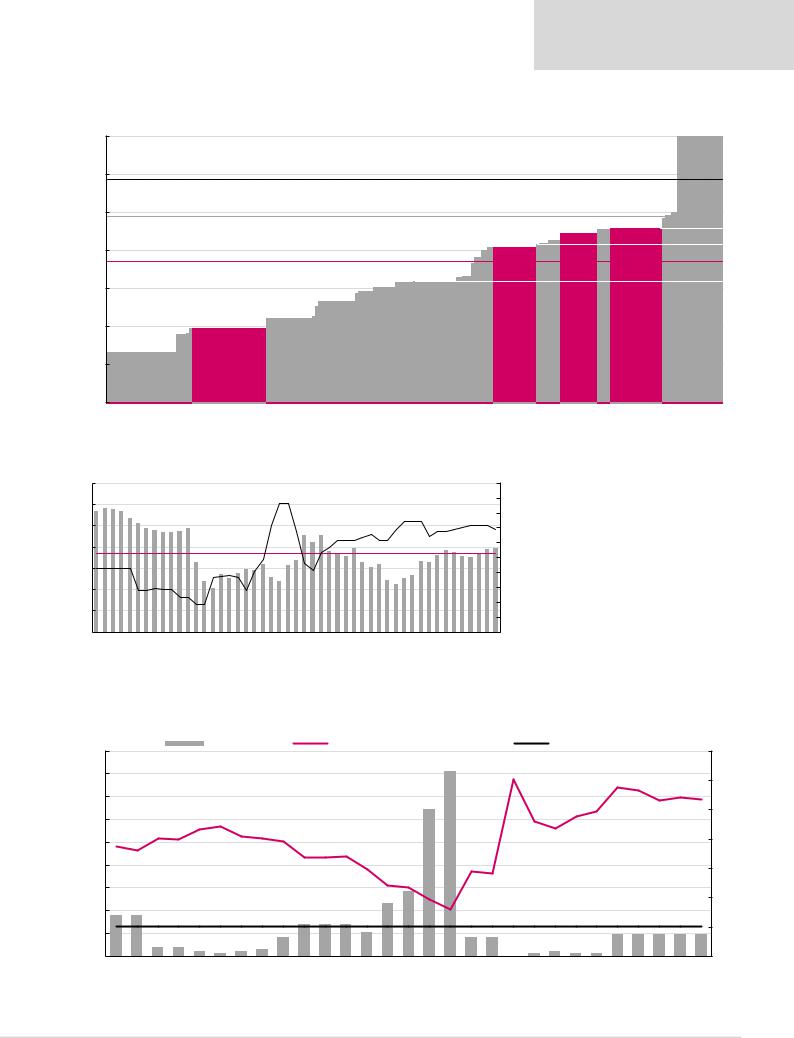
Our long-term iron ore price forecast of $60/t is 8% below the estimated 90th percentile of the cost curve, which reflects our cautious view on longer-term iron ore demand.
Figure 45: Iron ore price vs cash costs* at the 90th percentile, $/t |
Figure 46: Iron ore price premium (discount) to the 90th percentile |
Cash costs, $/t |
Iron ore average price. $/t |
80% |
200 |
|
|
|
|
|
|
|
|
|
|
|
|
|
|
|
180 |
|
|
|
|
175 |
|
|
|
|
|
|
|
|
|
60% |
|
|
|
|
|
|
|
|
|
|
|
|
|
|
||
160 |
|
|
|
|
|
|
|
|
|
|
|
|
|
|
40% |
140 |
91 |
100 |
|
98 |
101 |
111 |
95 |
|
|
Forecasts |
|
|
|
||
120 |
|
|
|
|
|
|
|
|
20% |
||||||
|
|
|
|
|
|
|
|
|
|
|
|
|
|
||
|
|
|
|
|
|
|
|
|
|
|
|
|
|
|
|
100 |
|
|
77 |
|
108 |
|
|
70 |
70 |
71 66 |
62 |
62 |
63 |
60 |
0% |
|
|
|
|
|
|
||||||||||
|
|
|
|
|
|
|
|
|
|
|
|
|
|
|
|
80 |
|
|
|
|
|
|
|
|
|
|
|
|
|
|
|
60 |
|
|
|
|
|
|
|
|
|
61 |
|
|
|
|
-20% |
|
|
|
|
|
|
|
|
|
|
|
|
|
|
|
|
40 |
2007 |
2008 |
2009 |
2010 |
2011 2012 |
2013 |
2014 |
2015 |
2016 |
2017 2018E |
2019E |
2020E |
2021E |
LT (real) |
-40% |
|
|||||||||||||||
|
|
||||||||||||||
*Cash costs net of by-product credits plus sustaining capex. |
|
|
|
|
|
|
|
|
|||||||
|
|
|
|
|
|
|
Source: Bloomberg, CRU, Renaissance Capital estimates |
|
|||||||
|
52% |
55% |
63% |
|
|
|
|
34% |
9% |
|
31% |
22% |
2% |
16% |
6% |
|
|
|
|
|
Historical average, 23% |
||
|
|
|
|
|
|
|
|
-21% |
-16% |
|
|
-4% |
-7% |
-8% |
2007 |
2008 |
2009 |
2010 |
2011 |
2012 |
2013 |
2014 |
2015 |
2016 |
2017 |
2018E |
2019E |
2020E |
2021E |
|
|
|
|
|
|
|
Source: Bloomberg, CRU, Renaissance Capital estimates |
|||||||
30
vk.com/id446425943
Manganese ore
Manganese ore cost curve (18.3mnt contained metal)
Figure 47: 2018E manganese lump cash costs plus sustaining capex, $/dmtu (44%, CIF China)
8.0
7.0Spot price: $6.88/dmtu*
6.0Incentive price: $5.9/dmtu
$/dmtu |
5.0 |
Average cash cost: $4.7/dmtu |
5.08Assmang, |
|
|||
|
|
|
|
|
4.0 |
|
|
|
3.0 |
2.94 |
|
|
(AU), |
|
|
|
|
|
|
|
2.0 |
Samancor |
|
|
|
|
|
|
1.0 |
|
|
*Priced as at 8 January 2019. |
|
||
Figure 48: Manganese – Chinese port inventory days (LHS) and manganese price, $/mtu (RHS)
70 |
58 58 |
|
|
|
|
|
|
|
|
|
|
|
|
|
|
|
8.65 |
|
|
|
|
|
|
|
|
|
|
|
|
|
|
|
|
|
|
|
|
10 |
||
|
|
|
|
|
|
|
|
|
|
|
|
|
|
|
|
|
|
|
|
|
|
|
|
|
|
|
|
|
|
|
|
|
|
|
|
9 |
||||
|
|
|
|
|
|
|
|
|
|
|
|
|
|
|
|
|
|
|
|
|
|
|
|
|
|
|
|
|
|
|
|
|
|
|
|
|
|
|||
60 |
57 |
57 |
|
|
|
|
|
|
|
|
|
|
|
|
|
|
|
|
|
|
|
|
|
|
|
|
|
|
7.40 |
|
|
|
|
|
|
|
|
|
||
|
53 |
|
|
|
|
|
|
|
|
|
|
|
|
|
|
|
|
|
|
|
|
|
|
|
|
|
|
|
|
|
|
|
|
|
|
|
|
|||
|
|
|
51 |
|
|
|
|
49 |
|
|
|
|
|
|
|
|
|
|
|
|
|
|
|
|
|
|
|
|
|
|
|
|
|
|
|
|
6.88 |
8 |
||
|
|
|
|
49 |
|
|
|
|
|
|
|
|
|
|
|
|
|
|
|
|
|
|
|
|
|
|
|
|
|
|
|
|
|
|
|
|||||
|
|
|
|
|
48 |
|
|
|
|
|
|
|
|
|
|
|
|
|
|
|
|
|
6.55 |
|
|
|
|
|
|
|
|
|
|
|
|
|
||||
|
|
|
|
|
|
47 |
47 |
|
|
|
|
|
|
|
|
|
|
45 |
45 |
|
|
|
|
|
|
|
|
|
|
|
|
|
|
|
||||||
50 |
|
|
|
|
|
|
47 |
|
|
|
|
|
|
|
|
|
|
|
|
|
|
|
|
|
|
|
|
|
|
|
|
|
|
|
7 |
|||||
|
|
|
|
|
|
|
|
|
|
|
|
|
|
|
|
|
|
|
|
42 |
|
|
39 |
|
|
|
|
|
|
38 |
|
|
|
|
39 |
|||||
|
Average exchange stock days, 37 |
|
|
|
|
|
|
|
|
|
|
|
|
|
|
|
|
|
|
|
|
6 |
||||||||||||||||||
|
|
|
|
|
|
|
|
34 |
38 |
|
|
|
|
33 |
36 |
37 |
|
|
39 |
|||||||||||||||||||||
40 |
|
|
|
|
|
|
|
|
|
33 |
|
|
|
30 |
32 |
|
|
|
32 |
|
|
|
|
5 |
||||||||||||||||
|
|
|
|
|
|
|
|
|
|
27 |
|
|
|
|
|
|
26 |
|
|
|
||||||||||||||||||||
30 |
|
|
|
|
|
|
|
|
|
|
|
|
|
|
|
|
|
|
|
|||||||||||||||||||||
|
|
|
|
|
|
|
|
|
24 |
28 |
|
|
26 |
31 |
|
|
37 |
|
33 |
24 |
25 |
|
|
36 |
37 |
|
4 |
|||||||||||||
|
|
|
|
|
|
|
|
|
|
21 |
25 |
|
29 |
|
24 |
|
|
|
|
36 |
31 |
22 |
|
33 |
|
|
|
35 |
|
|
||||||||||
|
|
|
|
|
|
|
|
|
|
|
|
|
|
|
|
|
|
|
|
|
|
|
||||||||||||||||||
20 |
|
|
|
|
|
|
|
|
|
|
|
|
|
|
|
|
|
|
|
|
|
|
|
|
|
|
|
|
|
|
|
|
|
|
|
|
|
|
|
3 |
10 |
|
|
|
|
|
|
|
|
|
|
|
|
|
2.80 |
|
|
|
|
|
|
|
|
|
|
|
|
|
|
|
|
|
|
|
|
|
|
|
|
2 |
|
|
|
|
|
|
|
|
|
|
|
|
|
|
|
|
|
|
|
|
|
|
|
|
|
|
|
|
|
|
|
|
|
|
|
|
|
|
|
|||
|
|
|
|
|
|
|
|
|
|
|
|
|
|
|
|
|
|
|
|
|
|
|
|
|
|
|
|
|
|
|
|
|
|
|
|
|
|
|
1 |
|
|
|
|
|
|
|
|
|
|
|
1.83 |
|
|
|
|
|
|
|
|
|
|
|
|
|
|
|
|
|
|
|
|
|
|
|
|
|
|
|
|
|
|
|
|
|
|
|
|
|
|
|
|
|
|
|
|
|
|
|
|
|
|
|
|
|
|
|
|
|
|
|
|
|
|
|
|
|
|
|
|
|
|
|
0 |
Jan-15 |
Mar-15 |
May-15 |
Jul-15 |
Sep-15 |
Nov-15 |
Jan-16 Mar-16 |
May-16 |
Jul-16 |
Sep-16 |
Nov-16 |
Jan-17 |
Mar-17 |
May-17 |
Jul-17 |
Sep-17 |
Nov-17 |
Jan-18 |
Mar-18 |
May-18 |
Jul-18 |
Sep-18 |
Nov-18 |
Jan-19 |
- |
|||||||||||||||
|
|
|||||||||||||||||||||||||||||||||||||||
Note: Calculated as Chinese port stocks/Chinese consumption*365.
Source: Bloomberg, CRU, Renaissance Capital
Renaissance Capital
14 January 2019
Metals & Mining
90th percentile: $5.57/dmtu
Vale,5.46 |
70th percentile: $5.16/dmtu |
5.57 |
|
|
Samancor (SA), |
Source: Bloomberg, CRU, Renaissance Capital estimates
Manganese ore inventory days have reduced to long-term average levels
Figure 49: Percentage of manganese ore cost curve that is cash-burning over time
|
9.00 |
|
|
|
|
|
% Cash burning |
|
|
|
Manganese ore (44%, CIF China), $/mtu |
|
|
Average LT cash burn |
|
|
|
70% |
|||||||||||||
|
|
|
|
|
|
|
|
|
|
|
|
|
|
|
|
|
63.0% |
|
|
|
|
|
|
|
|
|
|
|
|
||
|
8.00 |
|
|
|
|
|
|
|
|
|
|
|
|
|
|
|
|
|
|
7.76 |
|
|
|
|
|
|
|
|
|
|
|
|
|
|
|
|
|
|
|
|
|
|
|
|
|
|
|
|
|
|
|
|
|
|
|
|
|
|
|
|
|
||
|
|
|
|
|
|
|
|
|
|
|
|
|
|
|
|
50.0% |
|
|
|
|
|
|
|
|
|
|
|
|
|
60% |
|
|
|
|
|
|
|
|
|
|
|
|
|
|
|
|
|
|
|
|
|
|
|
|
|
|
|
|
|
|
6.88 |
||
|
|
|
|
|
|
|
|
|
|
|
|
|
|
|
|
|
|
|
|
|
|
|
|
|
|
|
|
|
|
||
|
7.00 |
|
|
|
|
|
|
|
|
|
|
|
|
|
|
|
|
|
|
|
|
|
|
|
|
|
|
|
|
|
|
|
6.00 |
|
|
|
|
|
5.71 |
|
|
|
|
|
|
|
|
|
|
|
|
|
|
|
|
|
|
|
|
|
|
|
50% |
|
|
|
|
|
|
|
|
|
|
|
|
|
|
|
|
|
|
|
|
|
|
|
|
|
|
|
|
|
|
|
|
$/mtu |
5.00 |
|
|
|
|
|
|
|
|
|
|
|
|
|
|
|
|
|
|
|
|
|
|
|
|
|
|
|
|
|
40% |
|
|
|
|
|
|
|
|
|
|
|
|
|
|
|
|
|
|
|
|
|
|
|
|
|
|
|
|
|
|
||
4.00 |
|
|
|
|
|
|
|
|
|
|
|
|
|
18.0% |
22.0% |
|
|
|
|
|
|
|
|
|
|
|
|
|
|
30% |
|
|
|
|
|
|
|
|
|
|
|
|
|
|
|
|
|
|
|
|
|
|
|
|
|
|
|
|
|
||||
3.00 |
14.0% |
14.0% |
|
|
|
|
|
|
|
11.0% |
11.0% |
11.0% |
|
|
|
|
|
|
|
|
|
|
|
|
|
|
|
20% |
|||
|
|
|
|
|
|
|
|
8.0% |
|
|
|
|
Average LT cash burn, |
|
|
|
|
|
|||||||||||||
2.00 |
|
|
|
|
|
|
6.5% |
|
|
6.5% |
6.5% |
7.5% |
7.5% |
7.5% |
7.5% |
7.5% |
|
||||||||||||||
|
|
|
|
|
|
|
|
|
|
10.2% |
|
|
|
||||||||||||||||||
|
3.0% |
3.0% |
|
|
|
2.5% |
|
|
|
|
|
|
|
||||||||||||||||||
1.00 |
1.5% |
1.0% |
1.5% |
|
2.07 |
0.0% |
1.0% |
1.5% |
1.0% |
1.0% |
10% |
||||||||||||||||||||
|
|
|
|||||||||||||||||||||||||||||
|
|
|
|
||||||||||||||||||||||||||||
|
0.00 |
Mar 12 |
Jun 12 |
Sep 12 |
Dec 12 |
Mar 13 |
Jun 13 |
Sep 13 |
Dec 13 |
Mar 14 |
Jun 14 |
Sep 14 |
Dec 14 |
Mar 15 |
Jun 15 |
Sep 15 |
Dec 15 |
Mar 16 |
Jun 16 |
Sep 16 |
Dec 16 |
Mar 17 |
Jun 17 |
Sep 17 |
Dec 17 |
Mar 18 |
Jun 18 |
Sep 18 |
Dec 18 |
Spot |
0% |
|
|
|
|||||||||||||||||||||||||||||
Source: Bloomberg, CRU, Renaissance Capital estimates
31

vk.com/id446425943
Renaissance Capital
14 January 2019
Metals & Mining
Figure 50: Manganese price vs cash costs* at the 90th percentile |
Figure 51: Manganese price premium (discount) to the 90th percentile |
|
|
|
Cash costs, $/t |
|
|
Manganese average price. $/t |
80% |
||||||
10 |
|
|
|
|
|
|
|
|
|
|
|
70% |
|
|
|
|
|
|
|
|
|
|
Forecasts |
|
|
||
|
9 |
|
|
|
|
|
|
|
|
|
|
||
|
|
|
|
|
|
|
|
|
|
|
|
60% |
|
|
|
|
|
|
|
|
|
|
|
|
|
|
|
|
8 |
|
|
|
|
|
|
7.1 |
|
|
|
|
50% |
$/t |
7 |
5.1 |
5.0 |
4.5 |
|
|
6.0 |
5.5 |
5.3 |
5.5 |
5.2 |
40% |
|
6 |
|
|
30% |
||||||||||
|
|
|
|
|
|
|
|
|
|
|
|
||
|
5 |
|
|
|
|
|
|
|
|
|
|
|
20% |
|
|
|
|
3.6 |
3.5 |
|
|
|
|
|
|
|
|
|
4 |
|
|
|
|
|
|
|
|
|
10% |
||
|
|
|
|
|
|
|
|
|
|
|
|
|
|
|
3 |
|
|
|
|
|
3.6 |
|
|
|
|
|
0% |
|
|
|
|
|
|
|
|
|
|
|
|
||
|
|
|
|
|
|
|
|
|
|
|
|
-10% |
|
|
2 |
|
|
|
|
|
|
|
|
|
|
|
|
|
2012 |
2013 |
2014 |
2015 |
2016 |
2017 |
2018E |
2019E |
2020E |
2021E |
LT (real) |
-20% |
|
|
|
||||||||||||
|
|
|
|||||||||||
*Cash costs net of by-product credits plus sustaining capex. |
|
|
|
|
|
|
|
||||||
|
|
|
|
|
|
|
Source: Bloomberg, CRU, Renaissance Capital estimates |
|
|||||
68%
|
|
|
|
24% |
|
28% |
|
|
|
|
8% |
|
|
|
|
Historical average, 14% |
|||
|
|
|
|
|
|
|
|
|
|
|
|
0% |
|
|
|
|
|
|
|
2012 -3% |
2013 |
2014 |
2015-12% |
2016 |
2017 |
2018E |
2019E -5% |
2020E-10% |
2021E-10% |
Source: Bloomberg, CRU, Renaissance Capital estimates
32