

vk.com/id446425943
Positive earnings momentum
Renaissance Capital
14 January 2019
Metals & Mining
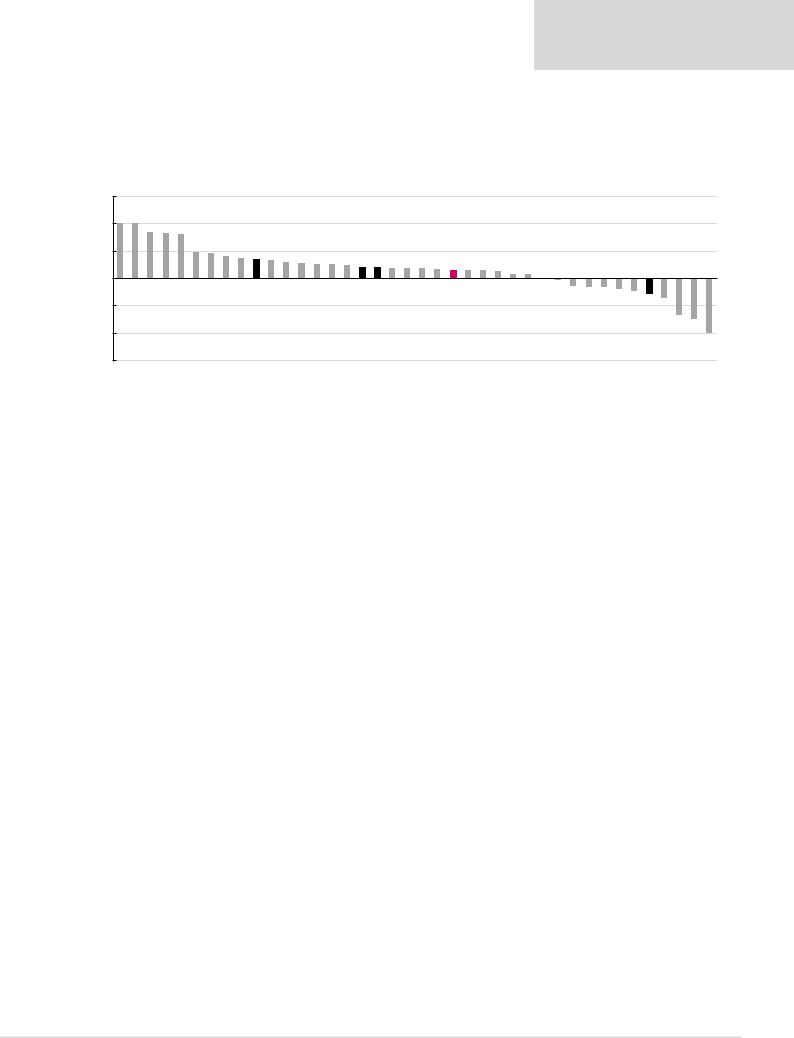
While we see some high commodity prices as unsustainable (such as coking coal, thermal coal, iron ore and manganese ore), we calculate upside potential to consensus earnings forecasts if spot commodity prices prevail.
However, a potential slowdown in the global economy may negatively affect earnings momentum.
Figure 32: Upside (downside) potential to one-year forward consensus earnings if spot prices prevail |
|
|
|
|
|
|
|
|
|
|
|
|
|
|
|
|
||||||||||||||||||||||||
150% |
100%+ |
100%+ |
|
|
|
|
|
|
|
|
|
|
|
|
|
|
|
|
|
|
|
|
|
|
|
|
|
|
|
|
|
|
|
|
|
|
|
|
|
|
100% |
84% |
82% |
80% |
48% |
|
|
|
|
|
|
|
|
|
|
|
|
|
|
|
|
|
|
|
|
|
|
|
|
|
|
|
|
|
|
|
|
|
|
||
|
|
|
|
|
46% |
40% |
|
|
|
|
|
|
|
|
|
|
|
|
|
|
|
|
|
|
|
|
|
|
|
|
|
|
|
|
|
|
|
|
||
50% |
|
|
|
|
|
36% |
35% |
33% |
30% |
27% |
26% |
25% |
25% |
21% |
20% |
19% |
18% |
18% |
16% |
16% |
15% |
14% |
13% |
8% |
8% |
|
|
|
|
|
|
|
|
|
|
|
|
|||
|
|
|
|
|
|
|
|
|
|
|
|
|
|
|
|
|
|
|||||||||||||||||||||||
0% |
|
|
|
|
|
|
|
|
|
|
|
|
|
|
|
|
|
|
|
|
|
|
|
|
|
|
|
|
|
|
|
|
|
|
|
|
|
|
|
|
-50% |
|
|
|
|
|
|
|
|
|
|
|
|
|
|
|
|
|
|
|
|
|
|
|
|
|
|
|
|
South32 -1% |
Alrosa -3% |
Northam** -14% |
Norilsk -16% |
Sasol -16% |
Glencore -19% |
Severstal -24% |
Steel* -28% |
NLMK -36% |
|
|
|
-100% |
|
|
|
|
|
|
|
|
|
|
|
|
|
|
|
|
|
|
|
|
|
|
|
|
|
|
|
|
MMK -67% |
Merafe -74% |
|
|||||||||
-150% |
Lonmin |
Impala |
Fortescue |
RBPlats |
Kumba |
Vale |
ARM |
Gold Fields |
Acron |
Platinum* |
Assore |
Sibanye |
Anglo |
Rio Tinto |
Harmony |
Amplats |
Gold* |
Diversified* |
BHP |
Mondi |
Polyus |
Polymetal |
W. average* |
AngloGold |
Evraz |
Phosagro |
Exxaro |
Sappi |
AMSA-100%+ |
|||||||||||
|
||||||||||||||||||||||||||||||||||||||||
*Weighted by market cap.
**Northam's upside potential calculated by comparing spot with RenCap's base-case earnings.
Source: Renaissance Capital estimates
The table below ranks miners in our global coverage universe by spot FCF yield. Some miners are trading at what we view as attractive spot FCF yields of 10%-plus.
Figure 33: Summary sector ratings and TPs (ranked by spot FCF yield)
Company |
|
Share price* |
|
TP |
|
Spot P/E, x |
|
Consensus |
|
Spot FCF |
|
Spot DY |
|
Rating |
|
|
|
|
P/E, x |
|
yield |
|
|
||||||
|
|
|
|
|
|
|
|
|
|
|
|
|
||
ARM, ZAR |
|
135.8 |
|
150.0 |
|
4.2 |
|
6.2 |
|
22.5% |
|
10.3% |
|
BUY |
Fortescue, AUD |
4.5 |
5.4 |
6.1 |
11.3 |
19.1% |
10.9% |
|
BUY |
||||||
Kumba Iron Ore, ZAR |
|
274.5 |
|
220.0 |
|
6.2 |
|
11.1 |
|
17.2% |
|
16.3% |
|
SELL |
Assore, ZAR |
294.3 |
300.0 |
4.8 |
6.4 |
17.0% |
10.4% |
|
HOLD |
||||||
Evraz, GBp |
|
475.4 |
|
620.0 |
|
4.7 |
|
5.4 |
|
16.7% |
|
16.2% |
|
BUY |
BHP, ZAR |
297.0 |
300.0 |
9.9 |
11.8 |
16.4% |
10.0% |
|
HOLD |
||||||
PhosAgro, $ |
|
13.0 |
|
17.0 |
|
6.1 |
|
5.8 |
|
14.1% |
|
8.1% |
|
BUY |
Glencore, ZAR |
50.7 |
55.0 |
9.9 |
8.0 |
13.8% |
9.6% |
|
HOLD |
||||||
Vale, $ |
|
13.8 |
|
15.5 |
|
5.6 |
|
8.3 |
|
13.8% |
|
8.9% |
|
BUY |
Gold Fields, ZAR |
50.7 |
43.0 |
13.5 |
18.8 |
13.6% |
2.4% |
|
SELL |
||||||
Anglo American, ZAR |
|
311.6 |
|
320.0 |
|
7.1 |
|
9.0 |
|
13.2% |
|
7.4% |
|
HOLD |
Alrosa, RUB |
|
101.6 |
|
109.0 |
|
6.6 |
|
6.4 |
|
13.1% |
|
12.9% |
|
BUY |
AngloGold Ashanti, ZAR |
|
181.0 |
|
110.0 |
|
11.4 |
|
13.1 |
|
12.8% |
|
1.0% |
|
SELL |
Exxaro, ZAR |
133.9 |
150.0 |
4.5 |
4.9 |
12.1% |
10.2% |
|
BUY |
||||||
Polyus, RUB |
|
5,286.5 |
|
6,300.0 |
|
7.2 |
|
8.5 |
|
11.1% |
|
6.2% |
|
BUY |
Rio Tinto, GBP |
38.3 |
46.0 |
8.1 |
10.2 |
10.8% |
7.4% |
|
BUY |
||||||
South32, ZAR |
|
33.2 |
|
37.0 |
|
9.6 |
|
9.5 |
|
10.1% |
|
7.5% |
|
HOLD |
Acron, RUB |
4,688.0 |
4,400.0 |
7.1 |
7.5 |
10.1% |
7.3% |
|
HOLD |
||||||
Polymetal, GBP |
|
8.7 |
|
8.6 |
|
8.8 |
|
10.2 |
|
9.2% |
|
5.7% |
|
HOLD |
NLMK, $ |
22.9 |
26.4 |
12.6 |
8.1 |
7.8% |
7.8% |
|
BUY |
||||||
Harmony, ZAR |
|
27.1 |
|
21.0 |
|
5.8 |
|
7.2 |
|
7.3% |
|
2.6% |
|
SELL |
Mondi, ZAR |
299.0 |
370.0 |
8.4 |
10.0 |
7.3% |
5.3% |
|
SELL |
||||||
Impala Platinum, ZAR |
|
37.5 |
|
45.0 |
|
9.2 |
|
16.1 |
|
7.1% |
|
0.0% |
|
BUY |
Sibanye-Stillwater, ZAR |
10.6 |
11.1 |
6.3 |
8.2 |
6.7% |
0.0% |
|
HOLD |
||||||
Norilsk, $ |
|
19.5 |
|
24.0 |
|
9.3 |
|
7.8 |
|
6.5% |
|
11.0% |
|
BUY |
Amplats, ZAR |
549.3 |
540.0 |
14.6 |
18.2 |
6.0% |
2.1% |
|
HOLD |
||||||
Sappi, ZAR |
|
77.3 |
|
85.0 |
|
7.5 |
|
8.1 |
|
5.7% |
|
4.5% |
|
HOLD |
Northam, ZAR |
42.6 |
40.0 |
13.8 |
- |
5.3% |
0.0% |
|
SELL |
||||||
Sasol, ZAR |
|
425.0 |
|
580.0 |
|
9.7 |
|
8.2 |
|
2.7% |
|
4.0% |
|
HOLD |
Severstal, $ |
14.3 |
17.1 |
9.2 |
7.0 |
2.4% |
9.2% |
|
BUY |
||||||
MMK, $ |
|
8.4 |
|
9.6 |
|
19.9 |
|
6.5 |
|
0.8% |
|
1.4% |
|
BUY |
Merafe, ZAR |
|
1.4 |
|
1.6 |
|
19.0 |
|
5.0 |
|
-0.7% |
|
4.8% |
|
BUY |
Lonmin, ZAR |
|
9.1 |
|
7.0 |
|
2.0 |
|
5.6 |
|
-9.7% |
|
0.0% |
|
SELL |
RBPlats, ZAR |
28.2 |
25.0 |
10.8 |
19.6 |
-27.6% |
0.0% |
|
SELL |
||||||
AMSA, ZAR |
|
3.8 |
|
4.2 |
|
-2.4 |
|
8.0 |
|
-76.0% |
|
0.0% |
|
HOLD |
*Priced at market close on 7 January 2019.
Source: Company data, Renaissance Capital estimates
22

vk.com/id446425943
Commodity price revisions
The table below shows changes to our commodity price forecasts. The most notable increases to our CY19 commodity price forecasts are: gold +7% to $1,350/t, silver +6% to $16.68/oz and 3PGM basket price +4% to $1,100/oz, while the most important reductions in our forecasts are: copper -8% to $6,000/t, nickel -17% to $11,530/t, zinc -9% to $2,543/t, iron ore -5% to $62/t and coking coal -6% to $178/t.
We reduce our long-term potash and uranium forecasts by 10% to $270/t and $45/t respectively, to reflect lower industry costs. However, we increase our long-term prices for PGM (by 5% for the 3PGM basket to $1,127/t) and zinc (4% to $2,700/t) to reflect higher industry costs. We incorporate a 2% weaker (compared with our previous forecast) rand of ZAR14.31/$1 into our CY19 forecasts. Our full commodity price table is shown on page 52.
We forecast falling prices for steelmaking materials (iron ore, coking coal and manganese), but a recovery in base metal prices over the medium term. Our long-term commodity price forecasts are around the 90th percentile of industry cash costs. See our cost curves on pages 26-45.
Figure 34: RenCap’s commodity price forecast revisions
Average per calendar year |
2019E |
2020E |
2021E |
2022E |
LT real |
Gold, $/oz |
|
|
|
|
|
New |
1,350 |
1,338 |
1,311 |
1,337 |
1,250 |
Old |
1,264 |
1,300 |
1,324 |
1,350 |
1,250 |
% change |
7% |
3% |
-1% |
-1% |
0% |
Silver, $/oz |
|
|
|
|
|
New |
16.68 |
17.83 |
18.77 |
19.15 |
17.90 |
Old |
15.80 |
17.35 |
18.96 |
19.34 |
17.90 |
% change |
6% |
3% |
-1% |
-1% |
0% |
3PGM basket (57% Pt, 36% Pd, 7% Rh), $/oz |
|
|
|
|
|
New |
1,100 |
1,153 |
1,182 |
1,206 |
1,127 |
Old |
1,056 |
1,112 |
1,142 |
1,165 |
1,078 |
% change |
4% |
4% |
4% |
4% |
5% |
Aluminium, $/t |
|
|
|
|
|
New |
1,953 |
2,166 |
2,254 |
2,300 |
2,150 |
Old |
2,150 |
2,200 |
2,277 |
2,323 |
2,150 |
% change |
-9% |
-2% |
-1% |
-1% |
0% |
Copper, $/t |
|
|
|
|
|
New |
6,000 |
6,367 |
6,606 |
6,739 |
6,300 |
Old |
6,500 |
6,576 |
6,672 |
6,806 |
6,300 |
% change |
-8% |
-3% |
-1% |
-1% |
0% |
Nickel, $/t |
|
|
|
|
|
New |
11,530 |
14,285 |
14,680 |
14,975 |
14,000 |
Old |
13,839 |
14,537 |
14,827 |
15,125 |
14,000 |
% change |
-17% |
-2% |
-1% |
-1% |
0% |
Zinc, $/t |
|
|
|
|
|
New |
2,543 |
2,732 |
2,831 |
2,888 |
2,700 |
Old |
2,786 |
2,747 |
2,754 |
2,809 |
2,600 |
% change |
-9% |
-1% |
3% |
3% |
4% |
Iron ore fines (62% Fe, CIF China), $/t |
|
|
|
|
|
New |
62 |
62 |
63 |
64 |
60 |
Old |
65 |
64 |
64 |
65 |
60 |
% change |
-5% |
-3% |
-1% |
-1% |
0% |
Iron ore lump premium (62% Fe), $/t |
|
|
|
|
|
New |
17 |
13 |
14 |
14 |
13 |
Old |
13 |
13 |
13 |
13 |
12 |
% change |
28% |
5% |
7% |
7% |
8% |
Hard coking coal, $/t |
|
|
|
|
|
New |
178 |
160 |
157 |
160 |
150 |
Old |
190 |
167 |
159 |
162 |
150 |
% change |
-6% |
-4% |
-1% |
-1% |
0% |
Brent crude oil, $/bl |
|
|
|
|
|
New |
65 |
60 |
63 |
64 |
60 |
Old |
65 |
64 |
64 |
65 |
60 |
% change |
0% |
-6% |
-1% |
-1% |
0% |
Source: Renaissance Capital estimates
Renaissance Capital
14 January 2019
Metals & Mining
23

vk.com/id446425943
Figure 34: RenCap’s commodity price forecast revisions (continued)
Average per calendar year |
2019E |
2020E |
2021E |
2022E |
LT real |
Uranium, $/lb |
|
|
|
|
|
New |
33 |
43 |
47 |
48 |
45 |
Old |
36 |
48 |
53 |
54 |
50 |
% change |
-10% |
-11% |
-11% |
-11% |
-10% |
MOP Potash Soluble Muriate FOB Saskatchewan, $/t |
|
|
|
|
|
New |
289 |
283 |
283 |
289 |
270 |
Old |
278 |
305 |
318 |
324 |
300 |
% change |
4% |
-7% |
-11% |
-11% |
-10% |
ZAR/$ |
|
|
|
|
|
New |
14.31 |
14.14 |
14.17 |
14.45 |
13.00 |
Old |
14.00 |
13.98 |
14.04 |
14.32 |
12.75 |
% change |
2% |
1% |
1% |
1% |
2% |
$/AUD |
|
|
|
|
|
New |
0.72 |
0.78 |
0.80 |
0.80 |
0.80 |
Old |
0.75 |
0.79 |
0.80 |
0.80 |
0.80 |
% change |
-3% |
-1% |
0% |
0% |
0% |
BRL/$ |
|
|
|
|
|
New |
3.78 |
3.50 |
3.42 |
3.49 |
3.20 |
Old |
3.77 |
3.41 |
3.30 |
3.37 |
3.00 |
% change |
0% |
3% |
4% |
4% |
7% |
RUB/$ |
|
|
|
|
|
New |
67.00 |
68.00 |
67.03 |
65.60 |
57.80 |
Old |
64.50 |
63.54 |
63.63 |
64.92 |
57.80 |
% change |
4% |
7% |
5% |
1% |
0% |
ZAR/$ |
|
|
|
|
|
New |
14.31 |
14.14 |
14.17 |
14.45 |
13.00 |
Old |
14.00 |
13.98 |
14.04 |
14.32 |
12.75 |
% change |
2% |
1% |
1% |
1% |
2% |
Source: Renaissance Capital estimates
Renaissance Capital
14 January 2019
Metals & Mining
24