


vk.com/id446425943
Copper
Consumer growth in emerging markets is likely to support copper demand. Copper should also benefit from strong electric vehicle demand growth and a shift to renewable energy generation such as wind and solar. The multi-government-led Electric Vehicle Initiative has set a goal for 30% electric vehicle market share for passenger cars, light commercial vehicles, buses and trucks by 2030. According to Glencore this could increase copper demand by 4.1mnt by 2030, which implies 18% supply growth compared with 2017 production.
Vale estimates that the number of electric vehicles could grow by 12mn units per year from 1.8mn in 2018 to around 13.8mn by 2025. Using NCM811 chemistry this could consume 43 kg of nickel, 6 kg of cobalt, 5 kg of manganese and 11 kg of lithium per vehicle.
The supply side is also supportive for copper. Mining capex remains at very low levels and few base metal projects are being approved. Given continued grade declines at existing mines, incremental volume growth from new copper projects will probably not be enough to meet demand over the medium term. We calculate the incentive price to approve new projects at $8,200/t, which is well above spot.
Renaissance Capital
14 January 2019
Metals & Mining
Positive demand outlook driven by consumer growth, electric vehicles and alternative energy
Supportive supply side
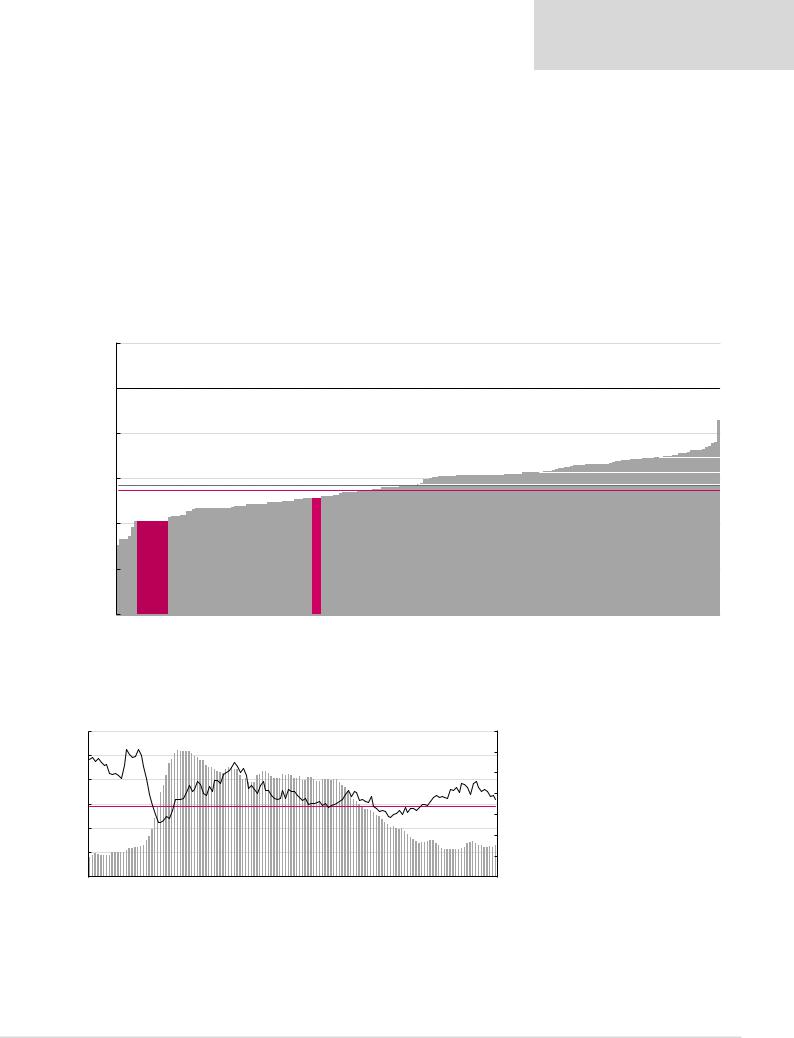
Copper cost curve (22mnt)
Figure 52: 2018E copper cash costs plus sustaining capex, $/t
|
9,000 |
|
|
|
|
|
|
|
|
|
|
Incentive price: $8,200/t |
|
|
|
|
|
|
|
|
8,000 |
|
|
|
|
|
|
|
|
|
7,000 |
|
|
|
|
|
|
|
|
|
6,000 |
Spot price: $5,904/t* |
|
|
|
|
|
|
|
|
|
|
|
|
|
|
|
|
|
$/t |
5,000 |
Average cash cost: $4,561/t |
|
|
|
|
|
|
|
|
3,163Copper,Southern |
3,227Norilsk, |
3,379Vale, 3,509Resources,Teck |
3,959BHP, |
4,007Glencore, |
4,548American,Anglo |
|||
|
4,000 |
2,655Freeport, |
2,748Antofagasta, |
||||||
|
|
|
|
|
|
|
|
|
|
|
3,000 |
|
|
|
|
|
|
|
|
|
2,000 |
|
|
|
|
|
|
|
|
|
1,000 |
|
|
|
|
|
|
|
|
|
0 |
|
|
|
|
|
|
|
|
*Priced as at 8 January 2019. |
|
|
|
|
|
|
|
||
Figure 53: Copper exchange inventory days and price, $/t (RHS)
18 |
|
|
|
|
|
16 |
9,811 |
|
|
|
16 |
|
|
|
|
|
|
|
|
|
|
|
|
11,000 |
|
|
|
|
|
|
|
|
|
|
|
|
|
|
|
|
|
|
|
|
|
|
|
||
16 |
|
|
|
8,693 |
|
|
|
|
|
|
|
|
|
|
|
|
|
|
|
|
14 |
|
|
10,000 |
|
|
|
|
|
|
|
|
|
|
|
|
|
|
|
|
|
|
|
|
|
|
|
||
|
|
|
|
|
|
|
|
|
|
|
|
|
|
|
|
|
|
|
|
|
|
|
|
|
14 |
|
|
|
|
|
|
|
|
|
|
|
|
|
|
|
|
|
|
12 |
|
|
|
|
9,000 |
12 |
|
|
|
|
|
|
11 |
|
|
|
|
7,136 |
|
|
|
|
|
|
|
|
8,000 |
|||
|
|
|
|
|
|
|
|
|
|
|
|
|
|
|
|
|
|
|
||||||
10 |
|
|
|
|
|
|
|
|
8 |
|
|
|
|
|
|
|
9 |
|
|
9 |
|
|
8 |
7,000 |
|
|
|
|
|
|
|
|
|
|
|
|
|
|
|
|
|
|
|
|
|
||||
|
|
|
|
|
|
|
|
|
|
|
|
|
|
|
|
|
|
|
|
|
|
|
||
8 |
6 |
|
Average exchange stock days, 9 |
|
|
|
|
|
|
|
|
|
|
6 |
|
|
|
|
|
6,000 |
||||
6 |
|
|
|
|
|
|
|
|
|
|
|
4 |
|
|
|
|
|
|
|
5,949 |
|
5,000 |
||
|
|
|
4 |
|
|
|
|
|
|
|
|
|
|
|
|
|
|
|
|
|||||
4 |
|
|
|
|
|
|
|
|
|
|
|
|
|
|
|
|
|
|
|
|
|
|
4,000 |
|
|
|
|
|
|
|
|
|
|
|
|
|
|
|
|
|
|
|
|
|
|
|
|
||
2 |
|
|
|
3,042 |
|
|
|
|
|
|
|
|
|
|
|
|
|
|
|
|
|
|
|
3,000 |
0 |
|
|
|
|
|
|
|
|
|
|
|
|
|
|
|
|
|
|
|
|
|
|
2,000 |
|
Jan-07 |
Jun-07 |
Nov-07 |
Apr-08 Sep-08 Feb-09 |
Jul-09 |
Dec-09 May-10 |
Oct-10 Mar-11 Aug-11 |
Jan-12 |
Jun-12 |
Nov-12 |
Apr-13 Sep-13 |
Feb-14 |
Jul-14 |
Dec-14 |
May-15 |
Oct-15 |
Mar-16 |
Aug-16 |
Jan-17 Jun-17 |
Nov-17 |
Apr-18 |
Sep-18 |
|
||
|
|
|
||||||||||||||||||||||
Note: Calculated as exchange inventory/global refined copper demand*365.
Source: Bloomberg, Renaissance Capital
|
90th percentile: $5,999/t |
4,858 |
Codelco,5,999 |
Rio Tinto, |
50th percentile: $3,959/t |
|
Source: Bloomberg, CRU, Renaissance Capital estimates
Copper exchange inventories have fallen below the 10-year average
33
vk.com/id446425943
Renaissance Capital
14 January 2019
Metals & Mining
We estimate that around 8.5% of the copper industry is cash-burning at spot prices.
Figure 54: Percentage of copper cost curve that is cash-burning over time
|
|
|
|
|
|
|
|
|
26.5% |
|
|
|
|
% Cash burning |
|
|
|
|
Copper, $/t |
|
|
|
|
Average LT cash burn |
|
|
|
|
|
|
|
|
|
|
|
|||||||||||||
12,000 |
|
|
|
|
|
|
|
26.0% |
|
|
|
|
|
|
|
|
|
|
|
|
|
|
|
|
|
|
|
|
|
|
|
|
|
|
|
|
|
|
|
|
|
|
|
|
|
|
30% |
|
10,000 |
|
|
|
|
|
|
|
|
|
|
|
|
|
9,646 |
|
|
|
|
|
|
|
|
|
|
|
|
|
|
|
|
23.0% |
|
|
|
|
|
|
|
|
|
|
|
|
25% |
||||
|
|
|
|
8,448 |
|
|
|
|
|
|
|
|
|
|
|
|
|
|
|
|
|
|
|
|
|
|
|
|
|
|
|
|
|
|
|
|
|
|
|
|
|
|||||||
|
|
|
|
|
|
|
|
|
|
|
|
|
|
|
|
|
|
|
|
|
|
|
|
|
|
|
|
|
|
|
17.5% |
18.5% |
17.5% |
17.5% |
|
|
|
|
|
|
|
|
|
|
|
|||
8,000 |
|
|
|
|
|
|
|
|
|
|
|
|
|
|
|
|
|
|
|
|
|
|
|
|
|
|
|
|
|
|
|
|
|
|
|
|
|
|
|
|
|
|
|
20% |
||||
|
|
|
|
|
|
|
|
|
|
|
|
|
|
|
|
|
|
|
|
|
|
|
|
|
|
|
|
|
|
|
|
|
|
|
|
|
|
|
|
|
|
|
|
|
||||
|
|
|
|
|
|
|
|
|
|
11.0% |
|
|
|
|
|
|
|
|
|
|
|
|
|
|
|
|
|
|
|
|
|
|
11.0% |
|
|
|
|
|
|
|
|
|
|
|
|
5,904 |
|
|
6,000 |
|
|
|
|
|
|
|
|
|
|
|
|
|
|
|
|
|
|
|
|
|
|
|
|
10.0% |
10.0% |
10.0% |
|
|
|
9.5% |
10.0% |
4,678 |
|
10.0% |
|
9.5% |
|
|
|
|
|
|
10.5% |
15% |
|||
|
|
|
|
|
|
|
|
|
|
|
|
|
|
|
|
|
|
|
|
|
|
|
|
|
|
9.0% |
8.5% |
|
8.5% |
|
|
|
|
9.0% |
8.5% |
|
||||||||||||
4,000 |
|
|
|
|
|
|
|
|
|
6.5% |
|
|
|
|
|
|
|
|
5.5% |
|
|
|
|
|
7.5% |
|
|
|
6.5% |
|
|
|
10% |
|||||||||||||||
4.5% |
|
|
|
|
|
|
|
|
|
|
|
|
|
|
|
|
|
|
|
4.5% |
|
4.5% |
|
|
|
|
|
|
|
|
5.0% |
5.0% |
||||||||||||||||
2,000 |
1.0% |
1.0% |
1.5% |
1.5% |
0.5% |
1.5% |
3,435 |
3.5% |
3.5% |
4.0% |
3.5% |
1.0% |
0.5% |
1.0% |
1.0% |
3.5% |
4.0% |
4.0% |
Average LT cash burn, 7.8% |
4.0% |
5% |
|||||||||||||||||||||||||||
|
|
|
||||||||||||||||||||||||||||||||||||||||||||||
|
|
|
|
|
|
|
|
|
|
|
|
|||||||||||||||||||||||||||||||||||||
0 |
Mar 07 |
Jun 07 |
Sep 07 |
Dec 07 |
Mar 08 |
Jun 08 |
Sep 08 |
Dec 08 |
Mar 09 |
Jun 09 |
Sep 09 |
Dec 09 |
Mar 10 |
Jun 10 |
Sep 10 |
Dec 10 |
Mar 11 |
Jun 11 |
Sep 11 |
Dec 11 |
Mar 12 |
Jun 12 |
Sep 12 |
Dec 12 |
Mar 13 |
Jun 13 |
Sep 13 |
Dec 13 |
Mar 14 |
Jun 14 |
Sep 14 |
Dec 14 |
Mar 15 |
Jun 15 Sep 15 |
Dec 15 Mar 16 |
Jun 16 |
Sep 16 |
Dec 16 |
Mar 17 |
Jun 17 |
Sep 17 |
Dec 17 |
Mar 18 |
Jun 18 |
Sep 18 |
Dec 18 |
Spot |
0% |
|
|
|||||||||||||||||||||||||||||||||||||||||||||||
Source: Bloomberg, CRU, Renaissance Capital estimates
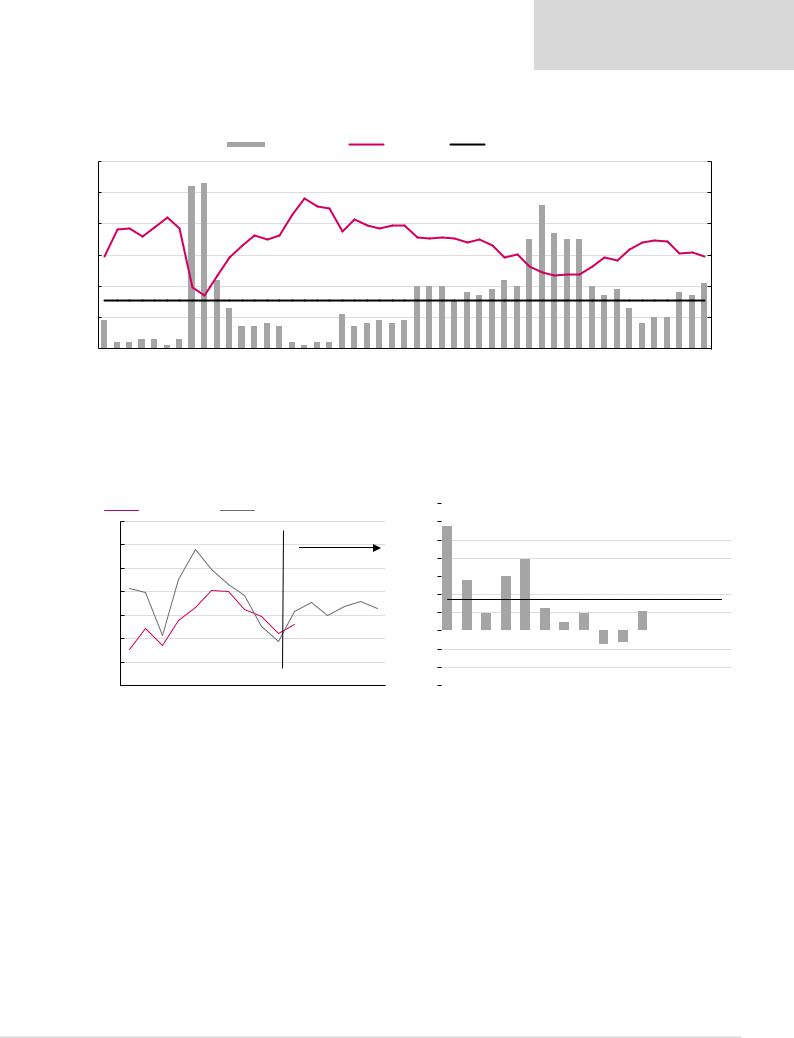
Our long-term copper price of $6,300/t is based on the 90th percentile of the copper cost curve.
Figure 55: Copper price vs cash costs* at the 90th percentile |
Figure 56: Copper price premium (discount) to the 90th percentile |
Cash costs, $/t |
Copper average price, $/t |
70% |
|
|
10,000 |
|
|
|
|
8,811 |
|
|
|
|
|
|
|
|
|
|
|
60% |
|
|
|
|
|
|
|
|
|
|
|
|
Forecasts |
|
|
50% |
|||
|
9,000 |
|
|
|
|
|
|
|
|
|
|
|
|
|
||||
|
|
|
|
|
|
|
|
|
|
|
|
|
|
|
|
|
||
|
|
|
|
|
|
|
|
|
|
|
|
|
|
|
|
|
|
|
|
|
|
|
|
|
|
7,060 |
7,009 |
|
|
|
|
|
|
|
|
|
40% |
|
8,000 |
|
|
|
|
6,323 |
|
|
|
|
6,532 |
|
6,367 |
6,606 |
6,300 |
30% |
||
|
|
|
|
|
|
6,254 |
5,958 |
|
|
6,000 |
||||||||
|
7,000 |
|
|
|
|
|
|
|
||||||||||
$/t |
|
5,440 |
|
5,792 |
|
5,587 6,170 |
20% |
|||||||||||
|
|
|
5,200 |
|||||||||||||||
6,000 |
4,515 |
4,701 |
10% |
|||||||||||||||
5,000 |
0% |
|||||||||||||||||
|
||||||||||||||||||
|
-10% |
|||||||||||||||||
|
|
|
|
|
|
|
|
|
|
|
|
|
|
|
|
|
|
|
|
4,000 |
|
|
|
|
|
|
|
|
|
|
|
|
|
|
|
|
-20% |
|
|
|
|
|
|
|
|
|
|
|
|
|
|
|
|
|
|
|
|
3,000 |
2007 |
2008 |
2009 |
2010 |
2011 |
2012 |
2013 |
2014 |
2015 |
2016 |
2017 |
2018E |
2019E |
2020E |
2021E |
LT… |
-30% |
|
|
|
||||||||||||||||
*Cash costs net of by-product credits plus sustaining capex.
Source: Bloomberg, CRU, Renaissance Capital estimates
|
|
|
|
|
|
|
|
|
|
|
|
|
|
|
|
|
|
58% |
|
|
|
|
|
|
|
|
|
|
|
|
|
|
|
|
|
|
28% |
|
30% |
39% |
|
Historical average, 17% |
|
|
|
|
|
|
|
||||
|
|
|
|
|
|
|
|
|
|
|
|||||||
|
|
|
|
|
|
|
|
|
|
|
|
|
|||||
|
|
10% |
|
|
13% |
|
10% |
|
|
10% |
9% |
|
|
|
|
|
|
|
|
|
|
|
|
5% |
|
|
|
|
0% |
1% |
|
||||
|
|
|
|
|
|
|
|
|
|
|
|
|
|
|
|
||
|
|
|
|
|
|
|
|
|
|
|
|
|
|
|
|||
|
|
|
|
|
|
|
|
|
|
|
|
|
|
|
|
|
|
|
|
|
|
|
|
|
|
|
|
|
|
|
|
|
|
|
|
|
|
|
|
|
|
|
|
-7% |
-6% |
|
|
|
-3% |
|
|
|
|
|
|
|
|
|
|
|
|
|
|
|
|
|
|
|
|
|
|
|
|
|
|
|
|
|
|
|
|
|
|
|
|
|
|
|
|
2007 |
2008 |
2009 |
2010 |
2011 |
2012 |
2013 |
2014 |
2015 |
2016 |
2017 |
2018E |
2019E |
2020E |
2021E |
|||
Source: Bloomberg, CRU, Renaissance Capital estimates
34
vk.com/id446425943
Aluminium
Consumer growth in emerging markets is likely to support aluminium demand.
We believe aluminium demand growth could remain strong as motor vehicle manufacturers continue to replace steel with lighter aluminium. Aluminium is also likely to continue benefiting from packaging growth (beverage cans, etc.). China’s environmental constraints and supply reform policies are likely to limit Chinese aluminium supply growth. We are not aware of major planned aluminium capacity from Western producers.
We calculate the incentive price to approve new projects at $3,000/t, which is significantly above spot.
Renaissance Capital
14 January 2019
Metals & Mining
Aluminium cost curve (67mnt supply)
Figure 57: 2018E aluminium cash costs plus sustaining capex, $/t
3,500
|
3,000 |
Incentive price: $3,000/t |
|
|
|
|
|
|
2,500 |
|
|
|
|
|
90th percentile: $2,231/t |
$/t |
|
Average cash cost: $1,927/t |
70th percentile: $2,072/t |
2,000 |
|
||
|
|
Spot price: $1,866/t* |
50th percentile: $1,939/t |
|
|
1,782 |
|
|
1,500 |
Tinto, 1,530 |
|
|
1,000 |
South32, |
|
|
|
Rio |
|
|
500 |
|
|
*Priced as at 8 January 2019. |
|
||
|
|
|
Source: Bloomberg, CRU, Renaissance Capital estimates |
Aluminium inventories have been declining since 2014 and are now at a supportive 13 days.
Figure 58: Aluminium exchange inventory days and price, $/t (RHS)
60 |
|
3,070 |
|
|
52 |
|
|
|
|
|
|
|
|
|
|
|
|
|
|
|
|
|
3,500 |
|
|
|
|
|
|
|
|
|
|
|
|
|
|
|
|
|
|
|
|
|
|
||
|
|
|
|
|
|
|
|
|
|
|
|
|
|
|
|
|
|
|
|
|
|
|
|
50 |
|
|
|
|
|
|
|
44 |
|
|
|
|
|
|
|
|
|
|
|
|
|
|
3,000 |
|
|
|
|
|
|
|
|
|
|
|
|
|
|
|
|
|
|
|
|
|
|
||
|
|
|
|
|
|
|
|
|
|
40 |
|
|
|
|
|
|
|
|
|
2,256 |
|
|
|
|
|
|
|
|
|
|
|
|
|
|
|
|
|
|
|
|
|
|
|
|
2,500 |
||
40 |
|
|
|
|
|
|
|
|
|
|
|
|
|
|
|
|
|
|
|
|
|
|
|
|
|
|
|
|
|
|
|
|
|
|
|
|
|
|
|
|
|
|
|
|
|
|
|
|
|
Average exchange stock days, 29 |
|
|
|
|
|
|
|
|
|
|
1,670 |
|
|
|
|
2,000 |
|||||
30 |
|
|
|
|
|
|
|
|
|
|
|
|
|
|
|
|
|
||||||
|
|
|
|
|
|
|
|
|
|
|
|
|
|
|
|
22 |
|
|
|
|
|
|
|
|
|
|
|
|
|
|
|
|
|
|
|
|
|
|
|
|
|
|
|
|
1,8631,500 |
||
20 |
|
|
15 |
|
|
|
|
|
|
|
|
|
|
|
|
|
|
|
15 |
|
|
13 |
1,000 |
9 |
|
|
|
|
|
|
|
|
|
|
|
|
|
|
|
|
|
|
|
|
|
||
|
|
|
|
|
|
|
|
|
|
|
|
|
|
|
|
|
|
|
|
|
|
||
|
|
|
|
|
|
|
|
|
|
|
|
|
|
|
|
|
|
|
|
|
|
|
|
10 |
|
|
|
|
|
|
|
|
|
|
|
|
|
|
|
|
|
|
|
|
|
|
500 |
|
|
|
|
|
|
|
|
|
|
|
|
|
|
|
|
|
|
|
|
|
|
|
|
0 |
|
|
|
|
|
|
|
|
|
|
|
|
|
|
|
|
|
|
|
|
|
|
0 |
Jan-07 |
Jun-07 |
Nov-07 Apr-08 |
Sep-08 |
Feb-09 |
Jul-09 Dec-09 |
May-10 |
Oct-10 Mar-11 Aug-11 |
Jan-12 |
Jun-12 |
Nov-12 |
Apr-13 |
Sep-13 |
Feb-14 |
Jul-14 |
Dec-14 |
May-15 |
Oct-15 |
Mar-16 Aug-16 |
Jan-17 |
Jun-17 |
Nov-17 Apr-18 |
Sep-18 |
|
Note: Calculated as exchange inventory/global refined aluminium demand*365.
Source: Bloomberg, Renaissance Capital
Aluminium inventories have been declining, supporting a more favourable price outlook
We calculate that around 56% of the aluminium industry is cash-burning at current spot prices, which could trigger capacity cuts and support our constructive medium-term view.
35

vk.com/id446425943
Renaissance Capital
14 January 2019
Metals & Mining
Figure 59: Percentage of aluminium cost curve that is cash-burning over time
|
|
|
|
|
|
|
|
|
|
% Cash burning |
|
|
|
Aluminium, $/t |
|
|
|
Average LT cash burn |
|
|
|
|
|
|
|
|
|
|||||||
|
3,200 |
|
|
|
|
|
|
|
|
2,941 |
70.0% 65.0% |
|
|
|
|
|
|
|
|
|
|
|
|
|
|
|
|
|
|
|
|
|
80% |
|
|
3,000 |
|
|
|
|
|
|
|
|
|
|
|
|
|
|
|
|
|
|
|
|
|
|
|
|
|
|
|
|
62.0% |
|
|||
|
|
|
|
|
|
|
|
|
|
|
|
|
|
|
|
|
|
|
|
|
|
|
|
|
|
|
|
|
|
|
70% |
|||
|
|
|
|
|
|
|
|
|
|
|
|
|
|
|
|
|
|
|
|
|
|
|
|
|
|
|
|
|
|
|
|
|||
|
2,800 |
|
|
|
|
|
|
|
|
|
|
|
|
|
|
|
|
|
|
|
|
|
|
|
|
|
|
|
|
|
|
|
||
|
|
|
|
|
|
|
|
|
|
|
|
|
|
|
2,600 |
|
|
|
|
|
|
|
|
|
|
|
|
|
|
51.5% |
|
|
||
|
|
|
|
|
|
|
|
|
|
|
|
49.0% |
|
|
|
48.0% |
|
|
|
|
|
|
|
|
|
|
|
|
|
|
|
|||
|
2,600 |
|
|
|
|
|
|
|
|
|
|
|
|
|
|
|
|
|
|
|
|
|
|
|
|
|
|
|
|
|
60% |
|||
|
|
|
|
|
|
|
|
|
|
|
|
|
|
|
|
|
|
|
|
|
|
|
|
|
|
|
|
|
|
|
||||
|
2,400 |
|
|
|
|
|
|
|
|
|
|
|
|
|
|
|
|
|
|
|
|
|
|
|
|
|
|
2,264 |
|
|
||||
|
|
|
|
|
|
|
|
|
|
|
|
|
|
|
|
|
|
|
|
|
|
|
|
|
|
|
|
|
|
|
50% |
|||
|
|
|
|
|
|
|
|
|
|
|
|
|
|
|
|
|
4.0% 20.0% 27.0% 17.0% 5.5% 18.0% 24.5% 26.5% 28.5% 18.0% 3.0% 4.0% 4.0% 4.5% 22.0% 32.0% 12.0% 7.0% 4.5% 1.5% 21.0% 14.5% 3.0% 1.0% 22.5% 7.5% 34.5% |
|
|
|||||||||||||||
$/t |
2,200 |
|
|
|
|
|
|
|
|
|
|
|
|
|
|
|
|
1,866 40% |
||||||||||||||||
2,000 |
|
|
|
|
|
|
|
|
|
|
|
|
|
|
|
|
||||||||||||||||||
|
|
|
|
|
|
|
|
|
|
|
|
|
|
|
|
|
|
|
||||||||||||||||
1,800 |
|
|
|
|
|
|
|
|
|
|
|
6.5% 3.0% 11.5% 18.5% 18.5% 1.5% 4.0% 1.5% 7.5% |
|
|
30% |
|||||||||||||||||||
1,600 |
|
|
|
|
|
|
|
|
|
|
|
|
|
20% |
||||||||||||||||||||
|
|
|
|
|
Average LT cash burn, 13.8% |
|
|
|
||||||||||||||||||||||||||
1,400 |
|
|
|
|
|
|
|
|
||||||||||||||||||||||||||
5.5% 4.5% 3.5% 1.0% 2.0% 7.5% 5.0% 0.5% 0.0% 0.0% 0.0% 0.0% 0.0% 0.0% 0.5% 1.5% 1.5% 0.5% 1.0% |
|
|
|
|
||||||||||||||||||||||||||||||
1,200 |
1,360 |
|
|
10% |
||||||||||||||||||||||||||||||
|
|
|
||||||||||||||||||||||||||||||||
|
|
|
|
|
||||||||||||||||||||||||||||||
|
1,000 |
Mar 04 |
Sep 04 |
Mar 05 |
Sep 05 |
Mar 06 |
Sep 06 |
Mar 07 |
Sep 07 |
Mar 08 |
Sep 08 |
Mar 09 |
Sep 09 |
Mar 10 |
Sep 10 |
Mar 11 |
Sep 11 |
Mar 12 |
Sep 12 |
Mar 13 |
Sep 13 |
Mar 14 |
Sep 14 |
Mar 15 |
Sep 15 |
Mar 16 |
Sep 16 |
Mar 17 |
Sep 17 |
Mar 18 |
Sep 18 |
|
Spot |
0% |
|
|
|
|
|||||||||||||||||||||||||||||||
Source: Bloomberg, CRU, Renaissance Capital estimates
Our long-term aluminium price forecast of $2,150/t is around 4% below the 90th percentile of the cost curve.
Figure 60: Aluminium price vs cash costs* at the 90th percentile |
Figure 61: Aluminium price premium (discount) to the 90th percentile |
||
Cash costs, $/t |
Aluminium average price. $/t |
40% |
|
|
|||
$/t |
3,000 |
1,557 |
1,751 |
2,5701,994 |
2,166 |
2,502 |
1,736 |
2,181 |
2,340 |
2,076 |
1,945 |
1,871 |
1,689 |
1,543 |
1,9291,968 |
1,953 |
2,166 |
2,254 |
2,150 |
0% |
10% |
8% |
29% |
22% |
3% |
|
|
2% |
|
|
|
4% |
2% |
|
|
|
|
|
|
|
|
|
|
|
|
|
|
|
|||||||||||||||||||||||||||||
|
2,800 |
|
|
|
|
|
|
|
|
|
|
|
|
|
|
Forecasts |
|
30% |
|
|
|
|
|
|
|
|
|
|
|
|
|
|
|
|
|
|||
|
|
|
|
|
|
|
|
|
|
|
|
|
|
|
|
|
|
|
|
|
|
|
|
|
|
|
|
|
|
|
|
|
|
|
|
|
||
|
2,600 |
|
|
|
|
|
|
|
|
|
|
|
|
|
|
2,110 |
|
|
|
|
|
|
|
|
|
|
|
|
|
|
|
|
|
|
|
|
|
|
|
2,400 |
|
|
|
|
|
|
|
|
|
|
|
|
|
|
|
|
|
|
20% |
|
|
|
|
|
|
|
|
|
|
|
|
|
|
|
|
|
|
|
|
|
|
|
|
|
|
|
|
|
|
|
|
|
|
|
|
|
|
|
|
|
|
|
|
|
|
|
|
|
|
|
|
|
|
|
||
|
2,200 |
|
|
|
|
|
|
|
|
|
|
|
|
|
|
|
|
|
|
|
|
|
|
|
|
|
|
|
Historical average, 5% |
|
|
|
|
|
||||
|
2,000 |
|
|
|
|
|
|
|
|
|
|
|
|
|
|
|
|
|
|
|
10% |
|
|
|
|
|
|
|
|
|
|
|
|
|||||
|
|
|
|
|
|
|
|
|
|
|
|
|
|
|
|
|
|
|
|
|
|
|
|
|
|
|
|
|
|
|
|
|
|
|
|
|
||
|
|
|
|
|
|
|
|
|
|
|
|
|
|
|
|
|
|
|
|
|
|
|
|
|
|
|
|
|
|
|
|
|
|
|
|
|
|
|
|
1,800 |
|
|
|
|
|
|
|
|
|
|
|
|
|
|
|
|
|
|
|
|
|
|
|
|
|
|
|
|
|
|
|
|
|
|
|
|
|
|
1,600 |
|
|
|
|
|
|
|
|
|
|
|
|
|
|
|
|
|
|
|
|
|
|
|
|
|
|
2010 0% |
|
|
2013 -5% 2014 0% |
2015 -1% |
|
|
|
|
|
|
|
1,400 |
|
|
|
|
|
|
|
|
|
|
|
|
|
|
|
|
|
|
|
-10% |
|
|
|
|
|
2009 -4% |
|
2012 -3% |
|
|
2018E -5% |
|
|
2021E -7% |
|||
|
1,200 |
|
|
|
|
|
|
|
|
|
|
|
|
|
|
|
|
|
|
|
|
|
|
|
|
|
|
|
|
2020E -7% |
||||||||
|
|
|
|
|
|
|
|
|
|
|
|
|
|
|
|
|
|
|
|
|
|
|
|
|
|
|
|
|
2019E -10% |
|||||||||
|
1,000 |
2004 |
2005 |
2006 |
2007 |
2008 |
2009 |
2010 |
2011 |
2012 |
2013 |
2014 |
2015 |
2016 |
2017 |
2018E |
2019E |
2020E |
2021E |
LT (real) |
-20% |
|
|
|
|
|
|
|
|
|||||||||
|
|
2004 |
2005 |
2006 |
2007 |
2008 |
2011 |
2016 |
2017 |
|||||||||||||||||||||||||||||
|
|
|
||||||||||||||||||||||||||||||||||||
*Cash costs net of by-product credits plus sustaining capex.
Source: Bloomberg, CRU, Renaissance Capital estimates |
Source: Bloomberg, CRU, Renaissance Capital estimates |
36