


vk.com/id446425943
African Rainbow Minerals – BUY
Renaissance Capital
14 January 2019
Metals & Mining
Figure 90: African Rainbow Minerals, ZARmn (unless otherwise stated)
|
|
|
|
African Rainbow Minerals |
ARIJ.J |
Target price, ZAR: |
150 |
Market capitalisation, ZARmn: |
29,947 |
Last price, ZAR: |
136 |
Enterprise value, ZARmn: |
31,146 |
Potential 12-month return: |
20.5% |
Jun-YE |
2017 |
2018 |
2019E |
2020E |
2021E |
Income statement |
|
|
|
|
|
Revenue |
8,158 |
8,346 |
9,745 |
10,188 |
10,771 |
Underlying EBITDA |
922 |
1,799 |
2,653 |
2,664 |
2,894 |
Underlying EBIT |
214 |
1,058 |
1,802 |
1,789 |
1,858 |
Net interest |
-185 |
-183 |
135 |
326 |
425 |
Equity accounted income |
3,446 |
4,129 |
4,159 |
2,471 |
2,108 |
Taxation |
409 |
-573 |
-543 |
-592 |
-639 |
Other |
-2,512 |
131 |
-451 |
-478 |
-409 |
Net profit for the year |
1,372 |
4,562 |
5,103 |
3,516 |
3,342 |
Headline earnings |
3,215 |
4,851 |
5,103 |
3,516 |
3,342 |
HEPS, ZAc |
1,684 |
2,526 |
2,670 |
1,840 |
1,749 |
Thomson Reuters consensus EPS, ZAc |
|
|
2,406 |
1,987 |
2,129 |
DPS declared, ZAc |
650 |
1,000 |
1,400 |
1,350 |
1,290 |
Underlying EBIT |
832 |
1,026 |
1,563 |
1,666 |
1,422 |
Platinum |
|||||
EBIT margin |
16% |
18% |
24% |
24% |
20% |
Nkomati |
120 |
18 |
-42 |
-31 |
400 |
EBIT margin |
6% |
1% |
-2% |
-2% |
17% |
Goedgevonden |
78 |
408 |
579 |
466 |
365 |
EBIT margin |
9% |
40% |
40% |
33% |
27% |
Other |
-816 |
-394 |
-298 |
-312 |
-329 |
Underlying EBIT |
214 |
1,058 |
1,802 |
1,789 |
1,858 |
Income statement ratios* |
|
|
|
|
|
EBITDA margin |
31% |
34% |
37% |
30% |
28% |
EBIT margin |
3% |
13% |
18% |
18% |
17% |
HEPS growth |
241% |
50% |
6% |
-31% |
-5% |
Dividend payout ratio |
39% |
40% |
52% |
73% |
74% |
Input assumptions |
|
|
|
|
|
$/ZAR |
13.60 |
12.85 |
14.25 |
14.25 |
14.09 |
Platinum, $/oz |
988 |
940 |
820 |
970 |
1,134 |
Iron ore (62%Fe, CIF China), $/t |
69 |
67 |
65 |
61 |
62 |
Manganese ore (44%, CIF China), $/mtu |
5.72 |
6.79 |
6.32 |
5.24 |
5.41 |
Nickel, $/t |
10,134 |
12,474 |
11,593 |
13,176 |
14,541 |
Required breakeven price |
|
|
|
|
|
3PGMs, $/3PGM oz |
811 |
860 |
872 |
932 |
986 |
Nickel, $/t |
9,132 |
12,384 |
12,444 |
13,749 |
11,308 |
Iron ore, $/t |
37 |
46 |
44 |
50 |
53 |
Manganese ore, $/mtu |
3.84 |
4.71 |
5.05 |
4.32 |
4.47 |
Export thermal coal, $/t |
62 |
65 |
65 |
66 |
67 |
Sales volumes |
|
|
|
|
|
PGMs in concentrate - attributable, k oz |
324 |
316 |
316 |
316 |
316 |
Iron ore, kt |
8,638 |
8,937 |
8,700 |
8,700 |
8,700 |
Manganese ore, kt |
1,487 |
1,589 |
1,550 |
1,550 |
1,860 |
Nickel, t |
7,938 |
6,651 |
6,825 |
6,825 |
7,875 |
Attributable Cu eq volumes, kt |
296 |
297 |
284 |
284 |
297 |
Volume growth |
-1.2% |
0.3% |
-4.4% |
0.0% |
4.5% |
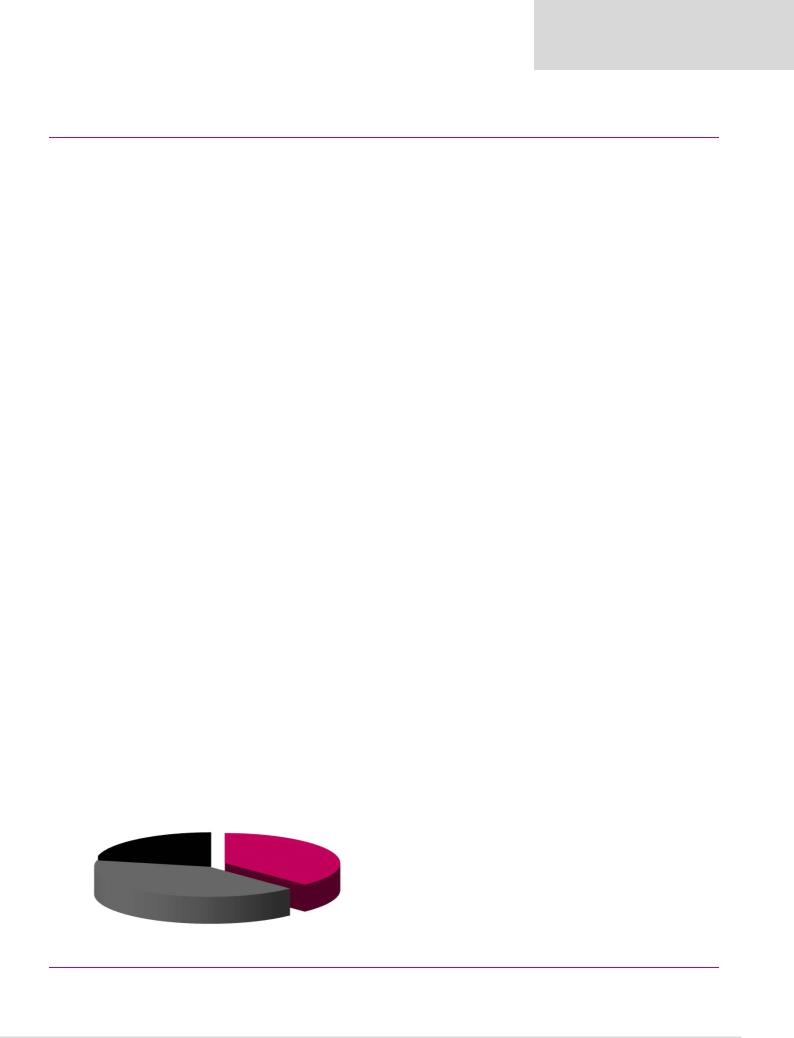
Contribution to FY19E attributable underlying EBITDA
|
Platinum |
Coal |
13% |
22% |
Nickel |
|
|
|
1% |
Iron ore Manganese 31%
33%
Jun-YE |
|
|
|
2019E |
2020E |
2021E |
|
2017 |
2018 |
|
|
||||
Balance sheet |
|
|
|
|
|
|
|
Net operating assets |
23,738 |
24,822 |
|
24,708 |
23,805 |
23,224 |
|
Investments |
1,573 |
1,561 |
|
1,772 |
1,772 |
1,772 |
|
Equity |
23,497 |
25,907 |
|
28,009 |
28,627 |
29,257 |
|
Minority interest |
543 |
1,471 |
|
1,561 |
1,657 |
1,739 |
|
Net debt (cash) |
1,271 |
-995 |
|
-3,090 |
-4,707 |
-6,000 |
|
Balance sheet ratios |
|
|
|
|
|
|
|
Gearing* |
5.1% |
-4.0% |
|
-12.4% |
-19.7% |
-25.8% |
|
Net debt to EBITDA plus equity income |
0.3x |
-0.2x |
|
-0.5x |
-0.9x |
-1.2x |
|
RoCE (excluding Harmony) |
19.9% |
23.5% |
|
28.3% |
19.9% |
18.8% |
|
RoIC |
15.9% |
22.1% |
|
27.4% |
18.5% |
16.9% |
|
RoE |
13.5% |
19.5% |
|
18.9% |
12.4% |
11.5% |
|
*net debt/(net debt+equity) |
|
|
|
|
|
|
|
Cash flow statement |
|
|
|
|
|
|
|
Operating cash flow |
2,312 |
3,914 |
|
6,833 |
5,893 |
5,171 |
|
Capex (net of disposals) |
-981 |
-944 |
|
-1,282 |
-1,251 |
-1,163 |
|
Other cash flows |
2,030 |
1,179 |
|
0 |
0 |
0 |
|
FCF |
3,361 |
4,149 |
|
5,551 |
4,643 |
4,007 |
|
Equity shareholders' cash |
3,390 |
3,980 |
|
5,096 |
4,515 |
4,005 |
|
Dividends and share buy-backs |
-426 |
-1,714 |
|
-3,001 |
|
-2,898 |
-2,712 |
Movement in net debt |
2,964 |
2,266 |
|
2,095 |
1,617 |
1,294 |
|
Cash flow ratios |
|
|
|
|
|
|
|
Working capital days |
66 |
88 |
|
69 |
67 |
67 |
|
Capex/EBITDA |
106.4% |
52.5% |
|
48.3% |
47.0% |
40.2% |
|
Cash conversion |
1.1x |
0.8x |
|
1.0x |
1.3x |
1.2x |
|
FCF yield |
16.8% |
19.1% |
|
22.7% |
20.3% |
18.5% |
|
Equity shareholders' yield |
18.7% |
18.7% |
|
19.6% |
17.4% |
15.4% |
|
Valuation |
|
|
|
|
|
|
|
SoTP DCF valuation and calculation of target price |
|
ZARmn |
ZAR/sh |
|
|||
Iron ore |
|
|
|
|
7,406 |
35.8 |
|
Manganese |
|
|
|
|
9,987 |
48.2 |
|
Two Rivers (effective interest = 54%) |
|
|
|
|
2,576 |
12.4 |
|
Modikwa (41.5%) |
|
|
|
|
916 |
4.4 |
|
Nkomati |
|
|
|
|
1,700 |
8.2 |
|
PCB Coal less debt (effective interest = 20.2%) |
|
|
|
1,949 |
9.4 |
|
|
Goedgevonden (effective interest = 26%) |
|
|
|
|
2,228 |
10.8 |
|
Copper and exploration |
|
|
|
|
0 |
0.0 |
|
Harmony at listed market value |
|
|
|
|
2,089 |
10.1 |
|
Corporate and other |
|
|
|
|
-1,522 |
-7.4 |
|
Enterprise value |
|
|
|
|
27,329 |
132.0 |
|
Net cash and other |
|
|
|
|
1,795 |
8.7 |
|
Equity value |
|
|
|
|
29,124 |
140.7 |
|
Plus: equity shareholders' cash/share |
|
|
|
|
|
25.1 |
|
Less: DPS |
|
|
|
|
|
-13.7 |
|
TP, rounded to |
|
|
|
|
|
150.0 |
|
Share price on 7/1/2019 |
|
|
|
|
|
135.8 |
|
Expected share price return |
|
|
|
|
|
10.4% |
|
Plus: expected dividend yield |
|
|
|
|
|
10.1% |
|
Total implied one-year return |
|
|
|
|
|
20.5% |
|
Share price range, ZAR: |
|
|
|
|
|
|
|
12-month high on 31/12/2018 |
144 |
12-month low on 4/4/2018 |
90 |
|
|||
Price move since high |
-5.9% |
Price move since low |
|
50.5% |
|
||
Calculation of discount rate |
|
|
|
|
|
|
|
WACC |
16.2% |
Cost of debt |
|
|
10.0% |
|
|
Risk-free rate |
9.0% |
Tax rate |
|
|
28% |
|
|
Equity risk premium |
5.5% |
After-tax cost of debt |
|
7.2% |
|
||
Beta |
1.30 |
Debt weighting |
|
0% |
|
||
Cost of equity |
16.2% |
Terminal growth rate |
|
2.0% |
|
||
Valuation ratios |
|
|
|
|
|
|
|
Jun-YE |
2017 |
2018 |
|
2019E |
2020E |
2021E |
|
P/E multiple |
5.7x |
4.4x |
|
5.1x |
7.4x |
7.8x |
|
Dividend yield |
6.8% |
9.0% |
|
10.3% |
9.9% |
9.5% |
|
EV/EBITDA |
4.6x |
3.7x |
|
3.6x |
4.5x |
4.3x |
|
P/B |
0.8x |
0.8x |
|
0.9x |
0.9x |
0.9x |
|
NAV per share, ZAR |
124 |
136 |
|
147 |
150 |
153 |
|
* Proportionately consolidated
Source: Bloomberg, Thomson Reuters, Company data, Renaissance Capital estimates
55

vk.com/id446425943
Alrosa – BUY
Renaissance Capital
14 January 2019
Metals & Mining
Figure 91: Alrosa, RUBmn (unless otherwise stated |
|
|
|
|
|
|
|
|
|
|
|
|
|
|
Alrosa |
|
ALRS.MM |
|
|
|
|
|
Target price, RUB: |
|
|
109.0 |
|
||
Market capitalisation, RUBmn: |
|
736,555 |
|
|
|
|
|
Share price, RUB: |
|
|
101.6 |
|
||
Enterprise value, RUBmn: |
|
837,502 |
|
|
|
|
|
Potential 12-month return: |
|
20.1% |
|
|||
|
|
|
|
|
|
|
|
|
|
|
|
|
|
|
Dec-YE |
2016 |
2017 |
2018E |
2019E |
2020E |
Dec-YE |
2016 |
2017 |
|
2018E |
2019E |
2020E |
||
Income statement |
|
|
|
|
|
|
Balance sheet ratios |
|
|
|
|
|
|
|
Revenue |
317,090 |
275,381 |
302,368 |
336,787 |
355,901 |
|
Gearing (net debt/(net debt+equity) |
24.5% |
24.4% |
|
18.7% |
16.4% |
13.8% |
|
Adjusted EBITDA |
176,418 |
126,890 |
162,410 |
172,162 |
181,928 |
|
Net debt/(EBITDA+dividends from associat |
0.5x |
0.7x |
|
0.3x |
0.3x |
0.2x |
|
Adjusted EBIT |
151,750 |
103,098 |
139,183 |
146,384 |
155,918 |
|
RoCE |
40.0% |
27.4% |
|
39.2% |
42.9% |
44.2% |
|
EBIT |
142,965 |
99,083 |
140,265 |
146,384 |
155,918 |
|
RoIC (after tax) |
35.8% |
17.6% |
|
30.0% |
33.5% |
34.6% |
|
Net interest |
24,124 |
-1,320 |
-12,662 |
-8,870 |
-11,013 |
|
RoE |
65.3% |
30.0% |
|
42.2% |
48.0% |
48.6% |
|
Taxation |
-36,268 |
-22,174 |
-27,740 -30,253 -31,879 |
|
Cash flow statement |
|
|
|
|
|
|
|
||
Equity accounted income |
2,650 |
3,027 |
3,681 |
3,665 |
3,795 |
|
|
|
|
|
|
|
|
|
Net profit for the year |
133,471 |
78,616 |
103,544 |
110,925 |
116,821 |
|
Operating cash flow |
143,138 |
100,464 |
|
146,925 |
130,108 |
145,843 |
|
Minority interest in profit |
-2,079 |
-1,541 |
-2,086 |
-2,219 |
-2,336 |
|
Capex |
-31,752 |
-26,944 |
|
-31,600 |
-26,400 |
-28,000 |
|
Attributable net profit |
131,392 |
77,075 |
101,457 |
108,707 |
114,484 |
|
Other FCF |
0 |
0 |
|
30,801 |
0 |
0 |
|
|
|
|
|
|
|
|
FCF |
111,386 |
73,520 |
|
146,126 |
103,708 |
117,843 |
|
EPS, RUB |
17.85 |
10.47 |
14.12 |
15.08 |
15.88 |
|
Equity shareholders' cash |
134,076 |
63,014 |
|
129,410 |
94,970 |
107,371 |
|
|
Dividends and share buy backs |
-14,775 |
-65,706 |
|
-94,823 |
-90,247 |
-99,429 |
|
||||||
Thomson Reuters consensus EPS, RUB |
|
|
14.72 |
15.89 |
16.05 |
|
Surplus (deficit) cash |
119,301 |
-2,692 |
|
34,588 |
4,723 |
7,942 |
|
DPS declared, RUB |
2.09 |
8.93 |
16.40 |
12.95 |
15.53 |
|
Cash flow ratios |
|
|
|
|
|
|
|
Adjusted EBIT |
|
-0.41345 |
|
|
|
|
|
|
|
|
|
|
|
|
|
|
|
|
|
|
Working capital days |
104 |
145 |
|
112 |
115 |
115 |
|
|
Diamonds |
205,235 |
132,879 |
171,624 |
187,647 |
199,173 |
|
Cash conversion |
1.0x |
0.8x |
|
1.3x |
0.9x |
0.9x |
|
Transportation |
933 |
1,298 |
1,869 |
856 |
904 |
|
FCF yield |
17.3% |
10.1% |
|
19.9% |
13.3% |
15.3% |
|
Social infrastructure |
-5,559 |
-3,537 |
-3,409 |
-4,977 |
-5,259 |
|
Equity shareholders' yield |
23.9% |
9.8% |
|
18.9% |
13.0% |
14.7% |
|
Other (SG&A, other expenses) |
-48,859 |
-27,542 |
-30,901 |
-37,142 |
-38,899 |
|
Capex/Adjusted EBITDA |
18.0% |
21.2% |
|
19.5% |
15.3% |
15.4% |
|
Income statement ratios |
|
|
|
|
|
|
Valuation |
|
|
|
|
|
|
|
EBITDA margin |
56% |
46% |
54% |
51% |
51% |
|
SoTP DCF valuation and calculation of target price |
|
|
|
RUBmn |
RUB/sh |
||
EBIT margin |
45% |
36% |
46% |
43% |
44% |
|
Diamonds |
|
|
|
|
993,344 |
137.8 |
|
EPS growth |
328% |
-41% |
35% |
7% |
5% |
|
Transportation |
|
|
|
|
6,604 |
0.9 |
|
Payout ratio |
12% |
85% |
116% |
86% |
98% |
|
Other |
|
|
|
|
-127,648 |
-17.7 |
|
Input assumptions |
|
|
|
|
|
|
Total enterprise value |
|
|
|
|
872,300 |
121.0 |
|
|
|
|
|
|
|
Net debt as at 31 December 2017 |
|
|
|
|
-86,047 |
-11.9 |
|
|
Rough diamond index, $/c |
197 |
198 |
202 |
202 |
208 |
|
Cash used in share buy-backs |
|
|
|
|
14,077 |
2.0 |
|
Alrosa average gem realisations, $/ct |
150.1 |
135.4 |
160.3 |
157.1 |
162.3 |
|
Other investments |
|
|
|
|
0 |
0.0 |
|
Gem realisations vs. index prices |
76% |
68% |
80% |
78% |
78% |
|
Minority interest |
|
|
|
|
-14,900 |
-2.1 |
|
Alrosa average industrial realisations, $/ct |
8.5 |
7.6 |
9.7 |
10.4 |
10.8 |
|
Equity value as at 8/1/2019 |
|
|
|
|
785,430 |
109.0 |
|
Alrosa average realisations, $/ct |
110.8 |
101.0 |
118.3 |
113.1 |
116.9 |
|
|
|
|
|
|
|
|
|
Rounded to |
|
|
|
|
|
109.0 |
|
|||||||
RUB/$ |
67 |
58 |
63 |
67 |
68 |
|
Share price on 7/1/2019 |
|
|
|
|
|
101.6 |
|
All in cash costs, net of by-products |
|
|
|
|
|
|
Expected share price return |
|
|
|
|
|
7.3% |
|
|
|
|
|
|
|
Plus: expected dividend yield |
|
|
|
|
|
12.8% |
|
|
Estimated required breakeven price, $/c |
128 |
148 |
131 |
138 |
142 |
|
Total implied one-year return |
|
|
|
|
|
20.1% |
|
Production volumes, kct |
|
|
|
|
|
|
Share price range, RUB: |
|
|
|
|
|
|
|
Diamonds |
|
|
|
|
|
|
12-month high on 1/10/2018 |
107.9 |
12-month low on 12/1/2018 |
75.1 |
|
|||
Aikhal division |
12,228 |
13,010 |
11,300 |
8,962 |
8,539 |
|
Price move since high |
-5.9% |
Price move since low |
|
35.2% |
|
||
Mirny division |
7,808 |
7,231 |
4,415 |
3,692 |
3,691 |
|
|
|
|
|
|
|
|
|
Udachny division |
3,167 |
3,821 |
5,288 |
8325 |
8343 |
|
Calculation of discount rate |
|
|
|
|
|
|
|
Nyurba division |
6,793 |
7,713 |
7,351 |
7,321 |
7,382 |
|
|
|
|
|
|
|
|
|
Severalmaz |
2,217 |
2,642 |
3,320 |
3,823 |
4,198 |
|
WACC |
14.0% |
Cost of debt |
|
|
8.5% |
|
|
Almazy Anabara & Nizhne-Lenskoye |
5,145 |
5,197 |
4,977 |
4,973 |
4,999 |
|
Risk-free rate |
7.0% |
Tax rate |
|
|
20% |
|
|
Other production |
0 |
0 |
-5 |
0 |
0 |
|
Equity risk premium |
6.0% |
After-tax cost of debt |
|
6.8% |
|
||
Total |
37,358 |
39,614 |
36,646 |
37,096 |
37,152 |
|
Beta |
1.30 |
Debt weighting |
|
10% |
|
||
Sales volumes , kct |
|
|
|
|
|
|
Cost of equity |
14.8% |
Terminal growth rate |
|
4.0% |
|
||
|
|
|
|
|
|
Valuation ratios |
|
|
|
|
|
|
|
|
Gem-quality |
28,900 |
30,100 |
26,700 |
27,856 |
28,068 |
|
|
|
|
|
|
|
|
|
Industrial |
11,100 |
11,100 |
10,300 |
11,938 |
12,029 |
|
Dec-YE |
2016 |
2017 |
|
2018E |
2019E |
2020E |
|
Total |
40,000 |
41,200 |
37,000 |
39,794 |
40,097 |
|
P/E multiple |
4.3x |
8.3x |
|
6.7x |
6.7x |
6.4x |
|
Balance sheet |
|
|
|
|
|
|
Dividend yield |
2.7% |
10.3% |
|
17.5% |
12.7% |
15.3% |
|
|
|
|
|
|
|
EV/(EBITDA+Equity income) |
3.6x |
5.6x |
|
4.4x |
4.4x |
4.1x |
||
Net operating assets |
340,325 |
352,534 |
273,784 |
284,653 |
279,478 |
|
P/B |
2.2x |
2.4x |
|
3.1x |
3.1x |
3.0x |
|
Equity |
257,202 |
266,825 |
223,576 |
238,945 |
241,479 |
|
NAV per share, USc |
52.1 |
62.1 |
|
48.9 |
49.5 |
49.3 |
|
Minority interest |
-232 |
-338 |
-1,250 |
-1,029 |
-795 |
|
NAV per share, RUB |
34.9 |
36.2 |
|
30.7 |
33.1 |
33.5 |
|
Net debt |
83,355 |
86,047 |
51,459 |
46,736 |
38,794 |
|
|
|
|
|
|
|
|
|
Source: Bloomberg, Thomson Reuters, Company data, Renaissance Capital estimates
56

vk.com/id446425943
Anglo American – HOLD
Renaissance Capital
14 January 2019
Metals & Mining
Figure 92: Anglo American, $mn (unless otherwise noted)
|
|
|
|
Anglo American |
AGLJ.J |
Target price, ZAR: |
320 |
Market capitalisation, $mn: |
31,660 |
Share price, ZAR: |
312 |
Enterprise value, $mn: |
45,876 |
Potential 12-month return: |
8.6% |
Dec-YE |
|
|
2016 |
2017 |
2018E |
2019E |
2020E |
Income statement |
|
|
|
|
|
|
|
Revenue |
|
|
23,142 |
28,650 |
28,990 |
27,691 |
27,880 |
Underlying EBITDA |
|
|
6,104 |
8,823 |
9,210 |
9,308 |
8,349 |
Underlying EBIT |
|
|
3,822 |
6,247 |
6,454 |
6,421 |
5,399 |
Net interest |
|
|
-567 |
-635 |
-474 |
-318 |
-262 |
Taxation |
|
|
-821 |
-1,770 |
-2,016 |
-1,931 |
-1,627 |
Minority interest in profit |
|
|
-329 |
-891 |
-899 |
-936 |
-844 |
Net profit for the year |
|
|
1,594 |
3,166 |
2,870 |
3,236 |
2,666 |
Underlying earnings |
|
|
2,210 |
3,272 |
3,145 |
3,236 |
2,666 |
Underlying EPS, USc |
|
|
172 |
257 |
247 |
255 |
210 |
Thomson Reuters consensus EPS, USc |
|
|
|
246 |
250 |
228 |
|
DPS declared, USc |
|
|
0 |
102 |
99 |
127 |
199 |
Underlying EBIT |
|
|
185 |
512 |
826 |
1,051 |
1,289 |
Platinum |
|
|
|||||
EBIT margin |
|
|
4% |
10% |
15% |
22% |
26% |
Diamonds |
|
|
1,019 |
873 |
759 |
779 |
792 |
EBIT margin |
|
|
17% |
15% |
13% |
13% |
13% |
Copper |
|
|
261 |
923 |
1,253 |
1,074 |
1,004 |
EBIT margin |
|
|
9% |
22% |
27% |
25% |
23% |
Nickel |
|
|
-15 |
0 |
92 |
37 |
113 |
EBIT margin |
|
|
-4% |
0% |
16% |
7% |
18% |
Iron ore and manganese |
|
|
1,275 |
1,978 |
1,207 |
1,515 |
1,280 |
EBIT margin |
|
|
46% |
57% |
36% |
48% |
42% |
Coal |
|
|
1,112 |
2,274 |
2,599 |
2,271 |
1,230 |
EBIT margin |
|
|
21% |
32% |
35% |
33% |
20% |
Other |
|
|
-15 |
-313 |
-282 |
-307 |
-309 |
Underlying EBIT |
|
|
3,822 |
6,247 |
6,454 |
6,421 |
5,399 |
Income statement ratios |
|
|
|
|
|
|
|
EBITDA margin |
|
|
26% |
31% |
32% |
34% |
30% |
EBIT margin |
|
|
17% |
22% |
22% |
23% |
19% |
EPS Growth |
|
|
169% |
49% |
-4% |
3% |
-18% |
Dividend payout ratio |
|
|
0% |
40% |
40% |
50% |
95% |
Input assumptions |
|
|
|
|
|
|
|
$/ZAR |
|
|
14.70 |
13.31 |
13.24 |
14.31 |
14.14 |
Platinum, $/oz |
|
|
988 |
950 |
880 |
870 |
1,070 |
Copper, USc/lb |
|
|
221 |
280 |
296 |
272 |
289 |
Hard coking coal, $/t |
|
|
114 |
210 |
202 |
190 |
163 |
Iron ore fines (62%Fe, CIF China), $/t |
|
|
58 |
71 |
66 |
62 |
62 |
Required breakeven price |
|
|
|
|
|
|
|
Breakeven price - 3PGM, $/oz |
|
|
754 |
774 |
803 |
759 |
701 |
Breakeven price - copper, USc/lb |
|
|
198 |
216 |
206 |
208 |
228 |
Breakeven price - coking coal, $/t |
|
|
85 |
129 |
122 |
122 |
123 |
Breakeven price - Export thermal coal, $/t |
|
46 |
59 |
60 |
62 |
71 |
|
Sales volumes |
|
|
|
|
|
|
|
Platinum, koz |
|
|
2,416 |
2,505 |
2,430 |
2,000 |
2,000 |
Diamonds (consolidated sales), mn ct |
|
|
30.0 |
33.1 |
32.4 |
30.3 |
30.3 |
Total iron ore, mnt |
|
|
59 |
61 |
46 |
60 |
65 |
Total copper segment, kt |
|
|
577 |
579 |
660 |
663 |
653 |
Metallurgical coal, mnt |
|
|
20.7 |
19.8 |
21.4 |
22.0 |
22.0 |
Attributable Cu eq volumes, kt |
|
|
2,962 |
2,910 |
2,700 |
2,768 |
2,834 |
Volume growth |
|
|
0.1% |
-1.7% |
-7.2% |
2.5% |
2.4% |
Contribution to FY18E attributable underlying EBITDA |
|
|
|
||||
|
|
|
|
Platinum (80% of |
|
|
|
|
|
|
|
AMS) |
|
|
|
Coal |
|
|
|
11% |
|
Diamonds (85% of |
|
|
|
|
|
|
De Beers) |
|
|
38% |
|
|
|
|
|
13% |
|
|
|
|
|
|
|
Copper |
|
Samancor |
|
|
|
|
Nickel |
16% |
|
Manganese |
|
|
|
|
|
|
|
Minas Rio Kumba Iron Ore |
2% |
|
|
||||
8% |
|
|
|||||
|
-4% |
|
(51%) |
|
|
|
|
|
|
|
|
8% |
|
|
|
Dec-YE |
|
|
|
2018E |
2019E |
2020E |
2016 |
2017 |
|
||||
Balance sheet |
|
|
|
|
|
|
Net operating assets |
32,315 |
33,172 |
|
31,972 |
31,909 |
32,872 |
Financial instruments |
497 |
211 |
|
169 |
195 |
205 |
Equity |
19,016 |
22,972 |
|
23,343 |
25,062 |
25,727 |
Minority interest |
5,309 |
5,910 |
|
5,719 |
5,953 |
6,164 |
Net debt |
8,487 |
4,501 |
|
3,080 |
1,089 |
1,186 |
Balance sheet ratios |
|
|
|
|
|
|
Gearing* |
30.9% |
16.4% |
|
11.7% |
4.2% |
4.4% |
Net debt to EBITDA |
1.4x |
0.5x |
|
0.3x |
0.1x |
0.1x |
RoCE |
10.8% |
17.8% |
|
18.8% |
19.3% |
15.6% |
RoIC (after tax) |
6.0% |
15.1% |
|
10.3% |
14.6% |
10.5% |
RoE |
12.4% |
15.6% |
|
13.6% |
13.4% |
10.5% |
Cash flow statement |
|
|
|
|
|
|
Operating cash flow |
4,573 |
8,101 |
|
6,137 |
8,301 |
6,489 |
Capex (net of disposals) |
-2,388 |
-2,150 |
|
-2,240 |
-3,950 |
-3,868 |
Other cash flows |
2,045 |
-688 |
|
-182 |
0 |
0 |
FCF |
4,230 |
5,263 |
|
3,715 |
4,351 |
2,621 |
Equity shareholders' cash |
4,423 |
4,607 |
|
2,732 |
3,507 |
1,904 |
Dividends and share buy-backs |
0 |
-621 |
|
-1,311 |
-1,516 |
-2,000 |
Surplus (deficit) cash |
4,423 |
3,986 |
|
1,421 |
1,990 |
-96 |
Cash flow ratios |
|
|
|
|
|
|
Working capital days |
52 |
33 |
|
32 |
20 |
23 |
Capex/EBITDA |
43.4% |
28.0% |
|
28.7% |
49.5% |
53.2% |
FCF yield |
15.9% |
16.9% |
|
9.9% |
12.2% |
7.3% |
Equity shareholders' yield |
34.7% |
22.1% |
|
9.5% |
12.3% |
6.7% |
Cash conversion |
2.0x |
1.4x |
|
0.9x |
1.1x |
0.7x |
Valuation |
|
|
|
|
|
|
SoTP DCF fair value and calculation of target price |
|
$mn |
ZAR/sh |
|||
Platinum |
|
|
|
|
8,248 |
91.5 |
Diamonds |
|
|
|
|
6,962 |
77.3 |
Coal |
|
|
|
|
6,745 |
74.9 |
Copper |
|
|
|
|
5,957 |
66.1 |
Nickel |
|
|
|
|
981 |
10.9 |
Kumba Iron Ore |
|
|
|
|
3,269 |
36.3 |
Samancor manganese |
|
|
|
|
3,535 |
39.2 |
Anglo Ferrous Brazil |
|
|
|
|
1,336 |
14.8 |
Corporate & other |
|
|
|
|
-3,966 |
-44.0 |
Total enterprise value excluding minority interests |
|
|
|
33,068 |
367.0 |
|
Attributable net debt as at 31 December 2017 |
|
|
|
-4,536 |
-50.3 |
|
Investments as at 31 December 2017 |
|
|
|
|
211 |
2.3 |
Equity value as at 8/1/2019 |
|
|
|
|
28,743 |
319.0 |
Rounded to |
|
|
|
|
|
320.0 |
Share price on 7/1/2019 |
|
|
|
|
|
311.6 |
Expected share price return |
|
|
|
|
|
2.7% |
Plus: expected dividend yield |
|
|
|
|
|
5.9% |
Total implied one-year return |
|
|
|
|
|
8.6% |
Share price range, ZAR: |
|
|
|
|
|
|
12-month high on 4/10/2018 |
336 |
12-month low on 4/4/2018 |
262 |
|||
Price move since high |
-7.2% |
Price move since low |
|
19.2% |
||
Calculation of discount rate |
|
|
|
|
|
|
WACC |
9.5% |
Cost of debt |
|
|
5.0% |
|
Risk-free rate |
4.0% |
Tax rate |
|
|
30% |
|
Equity risk premium |
5.0% |
After-tax cost of debt |
|
3.5% |
||
Beta |
1.30 |
Debt weighting |
|
15% |
||
Cost of equity |
10.5% |
Terminal growth rate |
|
3.0% |
||
Valuation ratios |
|
|
|
|
|
|
Dec-YE |
2016 |
2017 |
|
2018E |
2019E |
2020E |
P/E multiple |
5.8x |
6.4x |
|
9.1x |
8.8x |
10.7x |
Dividend yield |
0.0% |
6.2% |
|
4.4% |
5.7% |
8.8% |
EV/EBITDA |
4.8x |
4.1x |
|
4.8x |
4.5x |
4.9x |
P/B |
0.7x |
0.9x |
|
1.2x |
1.1x |
1.1x |
NAV per share, $ |
14.8 |
18.0 |
|
18.4 |
19.7 |
20.3 |
NAV per share, ZAR |
217 |
240 |
|
243 |
282 |
286 |
* Gearing defined as net debt/(net debt +equity)
Source: Bloomberg, Thomson Reuters, Company data, Renaissance Capital estimates
57
vk.com/id446425943
Assore – HOLD
Renaissance Capital
14 January 2019
Metals & Mining
Figure 93: Assore, ZARmn (unless otherwise stated)
|
|
|
|
Assore |
ASRJ.J |
Target price, ZAR: |
300 |
Market capitalisation, ZARmn: |
40,815 |
Last price, ZAR: |
294 |
Enterprise value, ZARmn: |
33,863 |
Potential 12-month return: |
10.3% |
Jun-YE |
2017 |
2018 |
2019E |
2020E |
2021E |
Income statement |
|
|
|
|
|
Revenue |
5,945 |
6,306 |
5,751 |
6,226 |
6,510 |
Underlying EBITDA |
2,237 |
1,846 |
1,680 |
1,685 |
1,791 |
Underlying EBIT |
2,120 |
1,683 |
1,493 |
1,484 |
1,580 |
Investment and other income |
372 |
649 |
738 |
843 |
1,058 |
Interest paid |
-20 |
-19 |
-12 |
0 |
0 |
Taxation |
-583 |
-646 |
-621 |
-652 |
-739 |
Equity income |
3,249 |
3,508 |
3,590 |
2,132 |
1,962 |
Minority interest in profit |
-117 |
-56 |
17 |
18 |
18 |
Net profit for the year |
5,021 |
5,119 |
5,204 |
3,826 |
3,880 |
Headline earnings |
5,209 |
5,109 |
5,204 |
3,826 |
3,880 |
HEPS, ZAc |
5,410 |
4,953 |
5,045 |
3,709 |
3,761 |
Thomson Reuters consensus EPS, ZAc |
|
|
5,328 |
3,903 |
4,186 |
DPS declared, ZAc |
1,400 |
2,200 |
2,610 |
2,190 |
2,500 |
Underlying EBIT |
1,200 |
704 |
473 |
588 |
636 |
Other mining and trading business |
|||||
EBIT margin |
20% |
11% |
8% |
9% |
10% |
Commissions on sales and technical fees |
920 |
979 |
1,020 |
895 |
943 |
Total consolidated |
2,120 |
1,683 |
1,493 |
1,484 |
1,580 |
Equity accounted: Assmang |
2,881 |
2,115 |
2,239 |
1,185 |
1,033 |
Iron ore |
|||||
EBIT margin |
36% |
29% |
30% |
18% |
16% |
Manganese |
1,681 |
2,553 |
2,809 |
1,837 |
1,764 |
EBIT margin |
33% |
40% |
40% |
29% |
26% |
Chrome |
-5 |
-29 |
0 |
0 |
0 |
Underlying EBIT* |
6,677 |
6,322 |
6,541 |
4,505 |
4,377 |
Income statement ratios |
|
|
|
|
|
EBITDA margin * |
41% |
37% |
38% |
30% |
29% |
EBIT margin * |
35% |
31% |
32% |
24% |
22% |
HEPS growth |
220% |
-8% |
2% |
-26% |
1% |
Dividend payout ratio |
38% |
60% |
70% |
80% |
90% |
Input assumptions |
|
|
|
|
|
Iron ore spot (CIF China), $/t |
69 |
67 |
65 |
61 |
62 |
Manganese ore (44%, CIF China), $/mtu |
5.72 |
6.79 |
6.32 |
5.24 |
5.41 |
Ferro Manganese - CIF, $/t |
1,166 |
1,341 |
1,169 |
1,100 |
1,135 |
Chrome ore, $/t |
278 |
207 |
181 |
189 |
202 |
ZAR/$ |
13.60 |
12.85 |
14.25 |
14.25 |
14.09 |
Required breakeven price |
|
|
|
|
|
Iron ore, $/t |
42 |
45 |
47 |
52 |
53 |
Manganese ore, $/mtu |
4.37 |
5.08 |
4.58 |
4.37 |
4.55 |
Chrome ore, $/t |
208 |
153 |
153 |
158 |
168 |
Assmang sales volumes (100%) |
17.3 |
17.9 |
17.4 |
17.4 |
17.4 |
Iron ore, mnt |
|||||
Manganese ore, mnt |
3.0 |
3.2 |
3.1 |
3.1 |
3.7 |
Manganese alloys, kt |
303 |
378 |
400 |
400 |
400 |
Chrome ore, kt |
1,279 |
1,557 |
1,400 |
1,500 |
1,500 |
Attributable Cu eq volumes, kt |
217 |
227 |
223 |
223 |
233 |
Volume growth |
5.7% |
4.5% |
-1.8% |
0.0% |
4.4% |
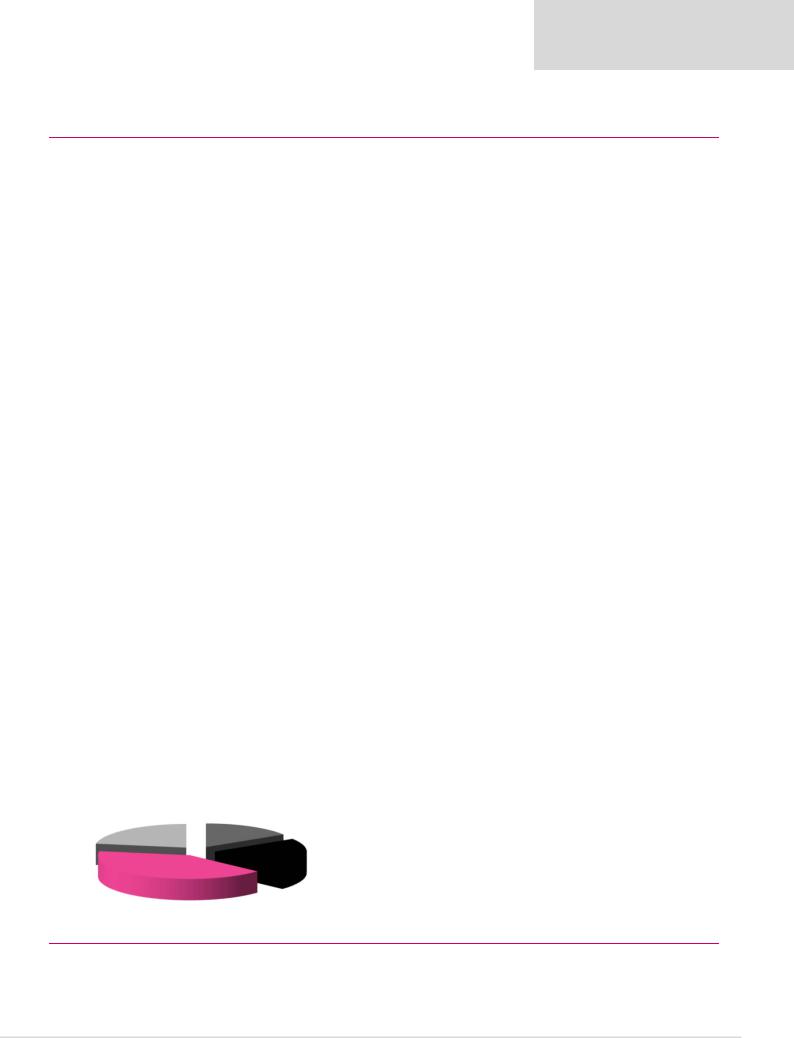
Contribution to FY19E attributable underlying EBITDA
Other mining, |
|
|
trading and |
|
|
shipping activities |
Iron ore |
|
21% |
||
38% |
||
|
Manganese
41%
Jun-YE |
|
|
|
2019E |
2020E |
2021E |
2017 |
2018 |
|
||||
Balance sheet |
|
|
|
|
|
|
Net operating assets |
17,547 |
17,915 |
|
17,007 |
17,065 |
17,103 |
Investments |
253 |
270 |
|
208 |
208 |
208 |
Equity |
22,872 |
26,091 |
|
27,670 |
28,226 |
28,862 |
Minority interest |
-24 |
-41 |
|
-44 |
-48 |
-52 |
Net (cash) debt |
-5,047 |
-7,865 |
|
-10,411 |
-10,905 |
-11,500 |
Balance sheet ratios |
|
|
|
|
|
|
Gearing* |
-28.3% |
-43.2% |
|
-60.3% |
-63.0% |
-66.2% |
Net debt to EBITDA plus equity income |
-0.9x |
-1.5x |
|
-2.0x |
-2.9x |
-3.1x |
RoCE |
39.5% |
35.0% |
|
36.7% |
25.9% |
25.1% |
RoIC (after tax) |
30.8% |
27.3% |
|
28.6% |
20.2% |
19.5% |
RoE (ex. cash) |
28.6% |
25.6% |
|
25.6% |
17.2% |
16.3% |
*net debt/(net debt+equity) |
|
|
|
|
|
|
Cash flow statement |
|
|
|
|
|
|
Operating cash flow |
4,904 |
4,746 |
|
5,845 |
3,438 |
3,357 |
Capex |
-127 |
-367 |
|
-272 |
-296 |
-295 |
Other cash flows |
-1,422 |
-25 |
|
0 |
0 |
0 |
FCF |
3,356 |
4,354 |
|
5,573 |
3,143 |
3,062 |
Equity shareholders' cash |
3,473 |
4,718 |
|
6,171 |
3,764 |
3,838 |
Dividends and share buy-backs |
-1,095 |
-1,900 |
|
-3,626 |
-3,269 |
-3,243 |
Movement in net debt |
2,378 |
2,818 |
|
2,545 |
495 |
595 |
Cash flow ratios |
|
|
|
|
|
|
Working capital days |
30 |
12 |
|
17 |
14 |
12 |
Capex/EBITDA * |
19.8% |
25.6% |
|
26.6% |
34.1% |
31.6% |
FCF yield |
20.2% |
19.4% |
|
28.0% |
16.2% |
16.3% |
Equity shareholders' yield |
16.0% |
15.5% |
|
20.3% |
12.4% |
12.6% |
Cash conversion |
0.7x |
0.9x |
|
1.2x |
1.0x |
1.0x |
Valuation |
|
|
|
|
|
|
SoTP DCF fair value |
|
|
|
|
ZARmn |
ZAR/sh |
Assmang |
|
|
|
|
18,494 |
132 |
Marketing fee |
|
|
|
|
5,178 |
37 |
Other mining and trading |
|
|
|
|
3,239 |
23 |
Other |
|
|
|
|
0 |
0 |
Enterprise value |
|
|
|
|
26,911 |
193 |
Other Investments |
|
|
|
|
270 |
2 |
Net cash (debt) as at 30 June 2018 |
|
|
|
|
7,865 |
56 |
Dividends retained against BEE vendor loans |
|
|
|
3,500 |
25 |
|
DCF fair value for equity |
|
|
|
|
38,546 |
276 |
Plus: equity shareholders' cash/share |
|
|
|
|
|
47 |
Less: DPS |
|
|
|
|
|
-25 |
Rounded to |
|
|
|
|
|
300 |
Share price on 7/1/2019 |
|
|
|
|
|
294 |
Expected share price return |
|
|
|
|
|
1.9% |
Plus: expected dividend yield |
|
|
|
|
|
8.4% |
Total implied one-year return |
|
|
|
|
|
10.3% |
Share price range, ZAR: |
|
|
|
|
|
|
12-month high on 18/1/2018 |
430 |
12-month low on 20/7/2018 |
252 |
|||
Price move since high |
-31.6% |
Price move since low |
|
16.6% |
||
Calculation of discount rate |
|
|
|
|
|
|
WACC |
15.1% |
Cost of debt |
|
|
9.5% |
|
Risk-free rate |
9.0% |
Tax rate |
|
|
28% |
|
Equity risk premium |
5.0% |
After-tax cost of debt |
|
6.8% |
||
Beta |
1.30 |
Debt weighting |
|
0% |
||
Cost of equity |
15.5% |
Terminal growth rate |
|
3.0% |
||
Valuation ratios |
|
|
|
|
|
|
Jun-YE |
2017 |
2018 |
|
2019E |
2020E |
2021E |
P/E multiple |
4.7x |
7.0x |
|
6.9x |
9.3x |
9.2x |
Dividend yield |
6.7% |
7.5% |
|
8.9% |
7.4% |
8.5% |
Average enterprise value, ZARmn |
24,246 |
33,217 |
|
30,631 |
30,132 |
29,534 |
EV/(EBITDA + equity income) |
4.4x |
6.2x |
|
5.8x |
7.9x |
7.9x |
P/B |
1.3x |
1.6x |
|
1.5x |
1.5x |
1.4x |
NAV per share, ZAR |
164 |
187 |
|
198 |
202 |
207 |
Net cash (debt) per share, ZAR |
36 |
56 |
|
75 |
78 |
82 |
* Proportionately consolidated
Source: Bloomberg, Thomson Reuters, Company data, Renaissance Capital estimates
58
vk.com/id446425943
BHP – HOLD
Renaissance Capital
14 January 2019
Metals & Mining
Figure 94: BHP, $mn (unless otherwise stated) |
|
|
|
BHP |
BILJ.J |
Target price, ZAR: |
300 |
Market capitalisation, $mn: |
110,086 |
Share price, ZAR: |
297 |
Enterprise value, $mn: |
131,291 |
Potential 12-month return: |
9.8% |
Jun-YE |
2017 |
2018 |
2019E |
2020E |
2021E |
Income statement |
|
|
|
|
|
Revenue |
38,285 |
43,650 |
41,690 |
40,472 |
40,917 |
Underlying EBITDA |
20,296 |
23,183 |
22,466 |
20,454 |
20,105 |
Underlying EBIT |
12,391 |
16,564 |
15,643 |
13,852 |
13,489 |
Net interest |
-1,431 |
-1,245 |
-1,091 |
-1,012 |
-992 |
Taxation |
-4,100 |
-7,007 |
-4,780 |
-4,299 |
-4,179 |
Minority interest in profit |
-332 |
-1,118 |
-823 |
-894 |
-968 |
Attributable profit |
5,890 |
4,823 |
8,950 |
7,648 |
7,350 |
Underlying attributable profit |
6,732 |
8,933 |
8,950 |
7,648 |
7,350 |
Underlying EPS, USc |
127 |
168 |
174 |
152 |
145 |
Thomson Reuters consensus EPS, USc |
|
|
184 |
166 |
174 |
DPS declared, USc |
83 |
118 |
241 |
137 |
145 |
Underlying EBIT |
-777 |
467 |
0 |
0 |
0 |
Petroleum - US onshore |
|||||
EBIT margin |
-36% |
47% |
- |
- |
- |
Petroleum - Conventional |
1,349 |
1,082 |
1,710 |
1,295 |
1,145 |
EBIT margin |
29% |
25% |
31% |
27% |
25% |
Copper |
1,985 |
4,330 |
2,494 |
3,185 |
3,595 |
EBIT margin |
27% |
37% |
25% |
29% |
30% |
Iron ore |
7,174 |
7,194 |
7,442 |
6,811 |
6,999 |
EBIT margin |
49% |
49% |
51% |
49% |
49% |
Coal |
3,050 |
3,683 |
4,239 |
2,806 |
1,997 |
EBIT margin |
40% |
41% |
45% |
34% |
26% |
Other |
-390 |
-192 |
-241 |
-245 |
-246 |
Underlying EBIT |
12,391 |
16,564 |
15,643 |
13,852 |
13,489 |
Income statement ratios |
|
|
|
|
|
EBITDA margin |
55% |
55% |
55% |
52% |
51% |
EBIT margin |
32% |
38% |
38% |
34% |
33% |
EPS growth |
455% |
33% |
4% |
-13% |
-5% |
Dividend payout ratio |
66% |
70% |
139% |
90% |
100% |
Input assumptions |
|
|
|
|
|
Brent crude oil, $/bbl |
51 |
64 |
69 |
63 |
61 |
Iron ore fines (62%Fe, CIF China), $/t |
69 |
67 |
65 |
61 |
62 |
Copper, USc/lb |
245 |
306 |
275 |
278 |
296 |
Hard coking coal, $/t |
190 |
200 |
196 |
166 |
157 |
$/AUD |
0.75 |
0.78 |
0.72 |
0.75 |
0.80 |
Oil breakeven price - conventional, $/boe |
29 |
37 |
48 |
47 |
44 |
Copper breakeven price, $/t |
3,752 |
4,001 |
3,960 |
3,866 |
4,018 |
Iron ore breakeven price, $/t |
34 |
34 |
34 |
38 |
36 |
Coking coal breakeven price, $/t |
81 |
92 |
84 |
93 |
102 |
Sales volumes (BHP's share) |
|
|
|
|
|
Petroleum products, MMboe* |
209 |
193 |
118 |
111 |
108 |
Iron ore, mnt |
231 |
237 |
241 |
253 |
256 |
Copper, kt |
991 |
1,238 |
1,179 |
1,235 |
1,258 |
Metallurgical coal, mnt |
38 |
41 |
44 |
45 |
45 |
Export thermal coal, mnt |
28 |
28 |
27 |
28 |
28 |
Attributable Cu eq volumes, kt |
5,989 |
6,300 |
5,888 |
6,014 |
5,907 |
Volume growth |
-6.9% |
5.2% |
-6.5% |
2.1% |
-1.8% |
Contribution to FY19E underlying EBITDA
|
US onshore |
Conventional |
Coal |
petroleum |
petroleum |
22% |
0% |
16% |
|
|
Copper |
|
|
21% |
Iron ore |
|
|
41% |
|
|
Jun-YE |
|
|
|
2019E |
2020E |
2021E |
2017 |
2018 |
|
||||
Balance sheet |
|
|
|
|
|
|
Net operating assets |
79,194 |
71,636 |
|
62,680 |
63,904 |
64,266 |
Investments |
-147 |
-32 |
|
39 |
39 |
39 |
Equity |
57,258 |
55,592 |
|
47,268 |
47,930 |
48,174 |
Minority interest |
5,468 |
5,078 |
|
5,243 |
5,421 |
5,615 |
Net debt |
16,321 |
10,934 |
|
10,208 |
10,591 |
10,515 |
Balance sheet ratios |
|
|
|
|
|
|
Gearing* |
22.2% |
16.4% |
|
17.8% |
18.1% |
17.9% |
Net debt to EBITDA |
0.8x |
0.5x |
|
0.5x |
0.5x |
0.5x |
RoCE |
13.6% |
19.5% |
|
20.2% |
18.8% |
18.0% |
RoIC |
11.0% |
14.6% |
|
12.9% |
12.5% |
12.1% |
RoE |
12.1% |
15.8% |
|
17.4% |
16.1% |
15.3% |
Cash flow statement |
|
|
|
|
|
|
Operating cash flow |
17,837 |
19,610 |
|
16,391 |
15,722 |
15,597 |
Capex (net of disposals) |
-4,252 |
-4,979 |
|
2,800 |
-8,000 |
-7,262 |
Other |
-841 |
1,159 |
|
0 |
0 |
0 |
FCF |
12,744 |
15,790 |
|
19,191 |
7,722 |
8,335 |
Equity shareholders' cash |
12,659 |
10,607 |
|
18,000 |
6,602 |
7,182 |
Dividends and share buy backs |
-2,878 |
-5,220 |
|
-17,274 |
-6,985 |
-7,106 |
Excess cash |
9,781 |
5,387 |
|
726 |
-383 |
76 |
Cash flow ratios |
|
|
|
|
|
|
Working capital days** |
28 |
20 |
|
24 |
26 |
26 |
Capex/EBITDA |
21% |
21% |
|
-12% |
39% |
36% |
FCF yield |
12.3% |
13.0% |
|
15.5% |
6.2% |
6.7% |
Equity shareholders' yield |
15.5% |
10.0% |
|
16.6% |
6.1% |
6.6% |
Cash conversion |
1.9x |
1.2x |
|
2.0x |
0.9x |
1.0x |
Valuation |
|
|
|
|
|
|
SoTP valuation and calculation of target price |
|
|
|
$mn |
ZAR/sh |
|
US onshore petroleum at estimated sales value |
|
|
|
10,369 |
29 |
|
Conventional petroleum |
|
|
|
|
5,855 |
16 |
Copper |
|
|
|
|
19,895 |
55 |
Iron ore |
|
|
|
|
71,911 |
199 |
Coal |
|
|
|
|
18,283 |
51 |
Other |
|
|
|
|
-3,239 |
-9 |
Enterprise value as at 8/1/2019 |
|
|
|
|
123,073 |
341 |
Net debt, investments and buy-backs |
|
|
|
|
-16,166 |
-45 |
Equity value as at 8/1/2019 |
|
|
|
|
106,907 |
296 |
Plus: One year forward FCF/share |
|
|
|
|
|
33 |
Less: DPS |
|
|
|
|
|
-26 |
TP, rounded to |
|
|
|
|
|
300 |
Share price on 7/1/2019 |
|
|
|
|
|
297 |
Expected share price return |
|
|
|
|
|
1.0% |
Plus: expected dividend yield |
|
|
|
|
|
8.8% |
Total implied one-year return |
|
|
|
|
|
9.8% |
Share price range, ZAR: |
|
|
|
|
|
|
12-month high |
327 |
12-month low |
|
226 |
||
Price move since high |
-9.1% |
Price move since low |
|
31.5% |
||
Calculation of discount rate |
|
|
|
|
|
|
WACC |
9.0% |
Cost of debt |
|
|
4.5% |
|
Risk-free rate |
4.0% |
Tax rate |
|
|
30% |
|
Equity risk premium |
5.0% |
After-tax cost of debt |
|
3.2% |
||
Beta |
1.30 |
Debt weighting |
|
20.0% |
||
Cost of equity |
10.5% |
Terminal growth rate |
|
3.0% |
||
Valuation ratios |
|
|
|
|
|
|
Jun-YE |
2017 |
2018 |
|
2019E |
2020E |
2021E |
P/E multiple |
12.1x |
11.8x |
|
12.3x |
14.1x |
14.8x |
Dividend yield |
5.4% |
5.9% |
|
11.3% |
6.4% |
6.8% |
EV/EBITDA |
5.1x |
5.2x |
|
5.5x |
6.1x |
6.2x |
P/B |
1.4x |
1.9x |
|
2.3x |
2.3x |
2.2x |
NAV per share, $ |
10.8 |
10.4 |
|
9.3 |
9.5 |
9.5 |
NAV per share, ZAR |
146 |
134 |
|
133 |
135 |
134 |
*Net debt/(net debt+equity)
** Working capital/revenue*365
Source: Bloomberg, Thomson Reuters, Company data, Renaissance Capital estimates
59