


vk.com/id446425943
Gold Fields – SELL
Renaissance Capital
14 January 2019
Metals & Mining
Figure 104: Gold Fields, $mn (unless otherwise stated)
|
|
|
|
Gold Fields |
GFIJ.J |
Target price, ZAR: |
43 |
Market capitalisation, $mn: |
2,982 |
Share price, ZAR: |
51 |
Enterprise value, $mn: |
4,412 |
Potential 12-month return: |
-11.6% |
Dec-YE |
|
|
2016 |
2017 |
2018E |
2019E |
2020E |
Income statement |
|
|
|
|
|
||
Revenue |
|
|
2,749 |
2,811 |
2,552 |
2,988 |
3,051 |
EBITDA |
|
|
1,361 |
1,407 |
1,274 |
1,622 |
1,570 |
EBIT |
|
|
690 |
635 |
574 |
817 |
695 |
Other items |
|
|
-247 |
-251 |
-257 |
-241 |
-231 |
Net interest |
|
|
-51 |
-31 |
-4 |
-88 |
-84 |
Taxation |
|
|
-192 |
-172 |
81 |
-175 |
-143 |
Minority interest in profit |
11 |
11 |
-3 |
-19 |
-18 |
||
Net profit for the year |
185 |
-13 |
-294 |
319 |
241 |
||
Headline earnings |
208 |
194 |
139 |
319 |
241 |
||
Headline EPS, USc |
26 |
24 |
16 |
40 |
29 |
||
Thomson Reuters consensus HEPS, USc |
|
|
11 |
19 |
22 |
||
DPS declared, USc |
8 |
7 |
4 |
13 |
10 |
||
Underlying EBIT |
15 |
-25 |
-58 |
33 |
24 |
||
South Africa Region |
|||||||
EBIT margin |
|
4% |
-7% |
-28% |
10% |
7% |
|
West Africa Region |
227 |
221 |
204 |
263 |
245 |
||
EBIT margin |
|
25% |
25% |
23% |
26% |
24% |
|
South America Region |
67 |
108 |
97 |
89 |
58 |
||
EBIT margin |
|
21% |
27% |
27% |
23% |
19% |
|
Australia Region |
382 |
332 |
331 |
432 |
368 |
||
EBIT margin |
|
32% |
28% |
30% |
34% |
27% |
|
Adjusted EBIT |
690 |
635 |
574 |
817 |
695 |
||
Income statement ratios |
|
|
|
|
|
||
EBITDA margin |
49% |
50% |
50% |
54% |
51% |
||
EBIT margin |
|
25% |
23% |
22% |
27% |
23% |
|
HEPS Growth |
|
750% |
-8% |
-33% |
150% |
-28% |
|
Dividend payout ratio |
29% |
28% |
26% |
33% |
33% |
||
Input assumptions |
|
|
|
|
|
||
Gold, $/oz |
|
|
1,248 |
1,258 |
1,269 |
1,350 |
1,338 |
Copper, $/t |
|
|
4,867 |
6,170 |
6,532 |
6,000 |
6,367 |
ZAR/$ |
|
|
14.70 |
13.31 |
13.24 |
14.31 |
14.14 |
AUD/$ |
|
|
1.34 |
1.30 |
1.34 |
1.38 |
1.28 |
PEN/$ |
|
|
3.38 |
3.26 |
3.29 |
3.40 |
3.32 |
Gold production volumes, koz |
|
|
|
|
|
||
South Africa |
lumes |
290 |
281 |
155 |
244 |
268 |
|
West Africa |
lumes |
644 |
639 |
673 |
790 |
808 |
|
South America |
lumes |
270 |
307 |
302 |
307 |
252 |
|
Australia |
lumes |
942 |
935 |
865 |
934 |
1,010 |
|
Total lumes |
2,147 |
2,162 |
1,995 |
2,276 |
2,338 |
||
Volume growth |
|
-0.6% |
0.7% |
-7.7% |
14.0% |
2.7% |
|
Calculated breakeven price, $/oz |
|
|
|
|
|
||
South Africa breakeven |
1,192 |
1,342 |
1,763 |
1,126 |
1,155 |
||
West Africa breakeven |
939 |
885 |
852 |
870 |
886 |
||
South America breakeven |
715 |
611 |
777 |
862 |
907 |
||
Australia breakeven |
886 |
902 |
857 |
814 |
892 |
||
Group breakeven |
1,028 |
1,012 |
1,025 |
968 |
1,012 |
||
|
|
|
|
|
|
|
|
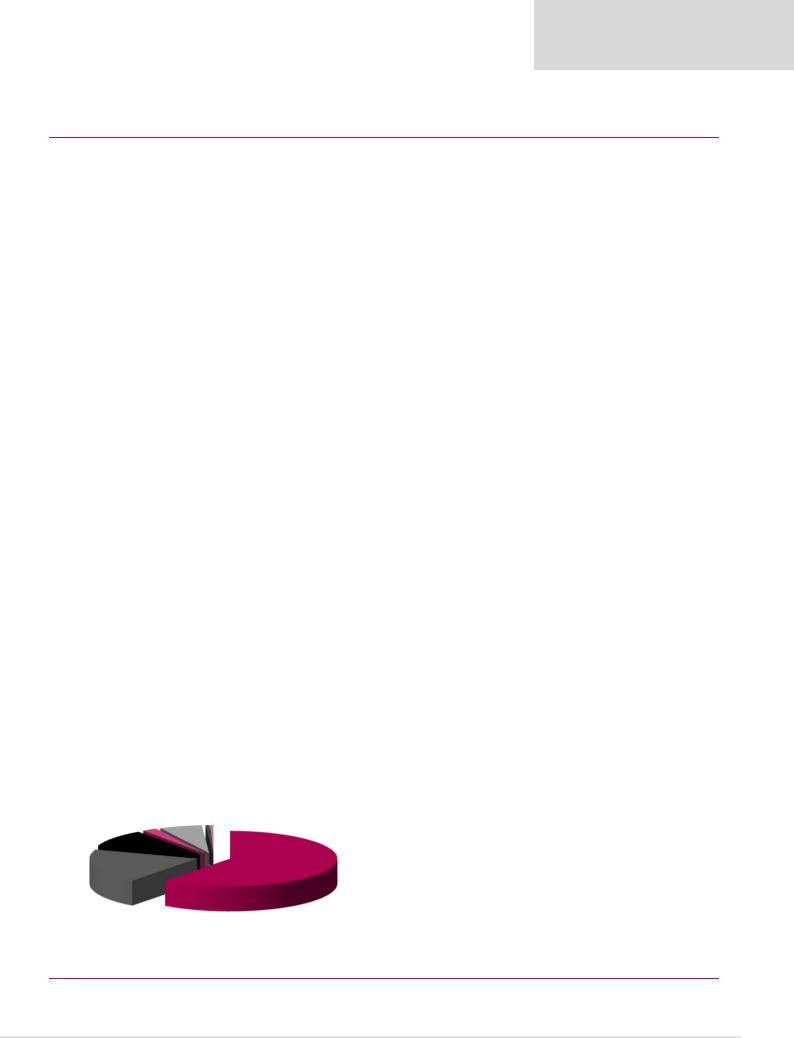
Contribution to FY18E underlying EBITDA
South Africa
-1%
West Africa
Australia 36%
49%
South America
14%
Dec-YE |
|
2016 |
2017 |
|
2018E |
2019E |
2020E |
Balance sheet |
|
|
|
|
|
|
|
Net operating assets |
|
4,449 |
4,711 |
|
4,461 |
4,342 |
4,159 |
Investments, net of rehab provision |
|
-93 |
-6 |
|
-2 |
-2 |
-2 |
Equity |
|
3,067 |
3,276 |
|
2,811 |
3,103 |
3,281 |
Minority interest |
|
123 |
127 |
|
126 |
130 |
133 |
Net debt |
|
1,166 |
1,303 |
|
1,523 |
1,107 |
744 |
Balance sheet ratios |
|
|
|
|
|
|
|
Gearing (net debt/(net debt+equity)) |
|
27.5% |
28.4% |
|
35.1% |
26.3% |
18.5% |
Net debt to EBITDA |
|
0.9x |
0.9x |
|
1.2x |
0.7x |
0.5x |
RoCE |
|
14.4% |
12.7% |
|
11.7% |
17.7% |
15.5% |
RoIC (after tax) |
|
11.0% |
9.7% |
|
12.1% |
13.3% |
11.7% |
RoE |
|
7.1% |
6.1% |
|
4.6% |
10.8% |
7.6% |
Cash flow statement |
|
|
|
|
|
|
|
Operating cash flow |
|
1,332 |
1,150 |
|
1,239 |
1,417 |
1,429 |
Capex (net of disposals) |
|
-649 |
-834 |
|
-799 |
-638 |
-698 |
Other cash flows |
|
-492 |
-237 |
|
-602 |
-217 |
-186 |
Free cash flow |
|
191 |
79 |
|
-162 |
563 |
545 |
Equity shareholders' cash |
|
113 |
-36 |
|
-173 |
486 |
472 |
Dividends and share buy-backs |
|
101 |
-100 |
|
-48 |
-70 |
-108 |
Surplus (deficit) cash |
|
214 |
-136 |
|
-220 |
416 |
364 |
Cash flow ratios |
|
-23 |
-8 |
|
-2 |
-1 |
-4 |
Working capital turnover, days |
|
|
|||||
FCF yield |
|
4.0% |
1.7% |
|
-3.6% |
13.3% |
14.1% |
Equity shareholders' yield |
|
3.2% |
-1.2% |
|
-6.1% |
16.2% |
15.7% |
Capex/EBITDA |
|
47.7% |
59.3% |
|
62.7% |
39.3% |
44.5% |
Cash conversion |
|
0.5x |
-0.2x |
|
-1.2x |
1.5x |
2.0x |
Valuation |
|
|
|
|
|
|
|
SoTP DCF fair value and calculation of target price |
|
$mn |
ZAR/sh |
||||
South Africa Region |
|
|
|
|
587 |
10.2 |
|
West Africa Region |
|
|
|
|
1,983 |
34.6 |
|
South America Region |
|
|
|
|
927 |
16.2 |
|
Australia Region |
|
|
|
|
2,364 |
41.2 |
|
Other |
|
|
|
|
-1,953 |
-34.0 |
|
Operating value |
|
|
|
|
3,908 |
68.1 |
|
Financial instruments and rehab provision as at 31 December 2017 |
|
-6 |
-0.1 |
||||
Enterprise value |
|
|
|
|
3,902 |
68.0 |
|
Net debt as at 31 December 2017 |
|
|
|
|
-1,303 |
-22.7 |
|
Minority interest |
|
|
|
|
-127 |
-2.2 |
|
Cash used in share buy-backs during 2018E |
|
|
|
|
0 |
0.0 |
|
Equity value |
|
|
|
|
2,472 |
43.1 |
|
Rounded to |
|
|
|
|
|
43.0 |
|
Share price on 7/1/2019 |
|
|
|
|
|
50.7 |
|
Expected share price return |
|
|
|
|
|
-15.1% |
|
Plus: expected dividend yield |
|
|
|
|
|
3.5% |
|
Total implied one-year return |
|
|
|
|
|
-11.6% |
|
Share price range, ZAR: |
|
|
|
|
|
|
|
12-month high on 15-1-2018 |
56 |
12-month low on 11-9-2018 |
33 |
||||
Price move since high |
-10.3% Price move since low |
|
54.0% |
||||
Calculation of WACC |
|
|
|
|
|
|
|
WACC |
7.4% |
Cost of debt |
|
|
5.0% |
||
Risk-free rate |
4.0% |
Tax rate |
|
|
30% |
||
Equity risk premium |
5.0% After-tax cost of debt |
|
1.1% |
||||
Beta |
1.00 |
Debt weighting |
|
30% |
|||
Cost of equity |
9.0% |
Terminal growth rate |
|
2.0% |
|||
Valuation ratios |
|
|
|
|
|
|
|
Dec-YE, $mn |
|
2016 |
2017 |
|
2018E |
2019E |
2020E |
P/E multiple |
|
16.5x |
15.8x |
|
21.4x |
9.1x |
12.6x |
Dividend yield |
|
1.8% |
1.8% |
|
1.2% |
3.6% |
2.6% |
EV/EBITDA |
|
3.5x |
3.2x |
|
3.5x |
2.6x |
2.5x |
P/B |
|
1.1x |
0.9x |
|
1.0x |
1.0x |
0.9x |
NAV per share, $ |
|
3.7 |
4.0 |
|
3.4 |
3.8 |
4.0 |
NAV per share, ZAR |
|
55 |
53 |
|
45 |
54 |
57 |
Source: Bloomberg, Thomson Reuters, Renaissance Capital estimates
69
vk.com/id446425943
Harmony Gold – SELL
Renaissance Capital
14 January 2019
Metals & Mining
Figure 105: Harmony Gold, ZARmn (unless otherwise stated) |
|
|
|
|
|
|
|
|
|
|
|||||
Harmony |
|
|
|
HARJ.J |
|
|
|
|
|
Target price, ZAR: |
|
|
21 |
||
Market capitalisation, ZARmn: |
|
13,893 |
|
|
|
|
|
Share price, ZAR: |
|
|
27 |
||||
Enterprise value, ZARmn: |
|
18,801 |
|
|
|
|
|
Potential 12-month return: |
|
-18.9% |
|||||
|
|
|
|
|
|
|
|
|
|
|
|
|
|
|
|
Jun-YE |
|
|
|
2017 |
2018 |
2019E |
2020E |
2021E |
Jun-YE |
2017 |
2018 |
2019E |
2020E |
2021E |
|
Income statement |
|
|
|
|
|
|
|
Balance sheet |
|
|
|
|
|
||
Revenue |
|
|
19,264 |
20,358 |
26,675 |
27,616 |
25,701 |
|
Net operating assets |
28,225 |
29,794 |
31,772 |
32,825 |
33,118 |
|
Underlying EBITDA |
|
4,452 |
5,356 |
8,641 |
9,646 |
7,543 |
|
Investments, net of rehab provision |
1,953 |
496 |
496 |
496 |
496 |
||
Underlying EBIT |
|
1,933 |
2,786 |
5,618 |
6,667 |
4,571 |
|
Equity |
29,291 |
25,382 |
28,286 |
31,493 |
33,436 |
||
Other items |
|
|
-2,292 |
-6,862 |
-1,271 |
-1,383 |
-1,363 |
|
Minority interest |
0 |
0 |
0 |
0 |
0 |
|
Net interest |
|
|
233 |
-669 |
-468 |
-335 |
-147 |
|
Net debt |
887 |
4,908 |
3,982 |
1,827 |
178 |
|
Taxation |
|
|
|
510 |
234 |
-1,018 |
-1,443 |
-918 |
|
|
|
|
|
|
|
Net profit for the year |
362 |
-4,473 |
2,861 |
3,506 |
2,143 |
|
Balance sheet ratios |
|
|
|
|
|
|||
Headline earnings |
|
1,306 |
763 |
2,861 |
3,506 |
2,143 |
|
Gearing (net debt/(net debt+equity)) |
2.9% |
16.2% |
12.3% |
5.5% |
0.5% |
||
Headline EPS, ZAR |
|
2.98 |
1.71 |
5.72 |
7.01 |
4.28 |
|
Net debt to EBITDA |
0.2x |
0.9x |
0.5x |
0.2x |
0.0x |
||
|
|
RoCE |
6.3% |
8.9% |
17.0% |
19.2% |
12.8% |
||||||||
Thomson Reuters consensus HEPS, ZAR |
|
|
3.06 |
3.87 |
2.97 |
|
RoIC (after tax) |
8.8% |
7.3% |
14.3% |
15.5% |
10.5% |
|||
DPS declared, ZAR |
|
0.85 |
0.35 |
0.82 |
1.05 |
0.65 |
|
RoE |
4.5% |
2.8% |
10.7% |
11.7% |
6.6% |
||
Production EBIT |
|
|
|
|
|
|
|
Cash flow statement |
|
|
|
|
|
||
South Africa underground |
1,768 |
2,432 |
3,585 |
4,866 |
2,995 |
|
Operating cash flow |
5,224 |
4,811 |
7,637 |
8,382 |
6,803 |
|||
EBIT margin |
|
|
11% |
14% |
18% |
22% |
15% |
|
Capex (net of disposals) |
-3,887 |
-4,571 |
-5,146 |
-4,304 |
-3,485 |
|
South Africa Surface |
|
174 |
235 |
284 |
347 |
200 |
|
Other cash flows |
317 |
-5,930 |
-1,053 |
-1,165 |
-1,144 |
||
EBIT margin |
|
|
10% |
12% |
13% |
18% |
11% |
|
Free cash flow |
1,654 |
-5,690 |
1,438 |
2,913 |
2,174 |
|
Hidden Valley |
|
-9 |
119 |
1,288 |
1,442 |
1,377 |
|
Equity shareholders' cash |
635 |
-4,714 |
1,101 |
2,671 |
2,068 |
||
EBIT margin |
|
|
-1% |
29% |
35% |
41% |
41% |
|
Dividends and share buy-backs |
-439 |
693 |
-175 |
-516 |
-419 |
|
Group production EBIT |
1,933 |
2,786 |
5,618 |
6,667 |
4,571 |
|
Surplus (deficit) cash |
196 |
-4,021 |
926 |
2,155 |
1,649 |
|||
Income statement ratios |
|
|
|
|
|
|
Cash flow ratios |
|
|
|
|
|
|||
EBITDA margin |
|
23% |
26% |
32% |
35% |
29% |
|
Working capital turnover, days |
3 |
4 |
5 |
4 |
3 |
||
EBIT margin |
|
|
10% |
14% |
21% |
24% |
18% |
|
FCF yield |
9.3% |
-34.1% |
8.2% |
19.0% |
15.9% |
|
HEPS Growth |
|
35% |
-43% |
235% |
23% |
-39% |
|
Equity shareholders' yield |
3.7% |
-40.0% |
8.1% |
19.7% |
15.3% |
||
Dividend payout ratio |
29% |
20% |
14% |
15% |
15% |
|
Capex/EBITDA |
87.3% |
85.3% |
59.6% |
44.6% |
46.2% |
|||
Input assumptions |
|
|
|
|
|
|
|
Cash conversion |
0.5x |
-6.2x |
0.4x |
0.8x |
1.0x |
||
|
|
|
|
|
|
|
Valuation |
|
|
|
|
|
|||
Gold, $/oz |
|
|
1,257 |
1,298 |
1,273 |
1,369 |
1,309 |
|
|
|
|
|
|
||
$/ZAR |
|
|
|
13.60 |
12.85 |
14.25 |
14.25 |
14.09 |
|
SoTP DCF fair value and calculation of target price |
|
|
ZARmn |
ZAR/sh |
|
Calculated breakeven price, $/oz |
|
|
|
|
|
|
Kusasalethu |
|
|
|
540 |
1.1 |
|||
|
|
|
|
|
|
Doornkop |
|
|
|
720 |
1.4 |
||||
South Africa breakeven |
1,097 |
1,117 |
1,061 |
1,086 |
1,111 |
|
Tshepong/Phakisa |
|
|
|
4,263 |
8.5 |
|||
International breakeven |
1,168 |
1,105 |
897 |
828 |
667 |
|
Masimong |
|
|
|
444 |
0.9 |
|||
Group breakeven |
|
1,193 |
1,208 |
1,084 |
1,120 |
1,123 |
|
Target 1 |
|
|
|
327 |
0.7 |
||
Gold production volumes, koz |
|
|
|
|
|
|
Bambanani |
|
|
|
1,659 |
3.3 |
|||
|
|
|
|
|
|
Joel |
|
|
|
379 |
0.8 |
||||
Kusasalethu |
lumes |
141 |
142 |
156 |
156 |
156 |
|
Unisel |
|
|
|
73 |
0.1 |
||
Doornkop |
lumes |
|
86 |
110 |
107 |
88 |
88 |
|
Moab |
|
|
|
5,645 |
11.3 |
|
Tshepong/Phakisa lumes |
284 |
302 |
287 |
290 |
290 |
|
Surface |
|
|
|
2,203 |
4.4 |
|||
Masimong |
lumes |
|
82 |
84 |
73 |
74 |
74 |
|
Hidden Valley |
|
|
|
2,247 |
4.5 |
|
Target 1 |
lumes |
|
86 |
92 |
87 |
100 |
100 |
|
Other |
|
|
|
-6,467 |
-12.9 |
|
Bambanani |
lumes |
|
88 |
91 |
82 |
84 |
84 |
|
Operating value |
|
|
|
12,033 |
24.1 |
|
Joel lumes |
|
72 |
53 |
50 |
72 |
72 |
|
Financial instruments and rehab provision as at 30 June 2018 |
|
496 |
1.0 |
||||
Unisel |
lumes |
|
51 |
41 |
32 |
21 |
0 |
|
Enterprise value |
|
|
|
12,529 |
25.0 |
|
Moab |
lumes |
|
0 |
106 |
248 |
250 |
250 |
|
Net debt as at 30 June 2018 |
|
|
|
-4,908 |
-9.8 |
|
Surface |
lumes |
|
102 |
115 |
124 |
100 |
100 |
|
Minority interest |
|
|
|
0 |
0.0 |
|
South Africa Total |
lumes |
993 |
1,136 |
1,244 |
1,235 |
1,214 |
|
50% Golpu value assuming it trades at avg. replacement cost |
|
2,814 |
5.6 |
||||
Hidden Valley lumes |
84 |
26 |
202 |
180 |
180 |
|
Cash used in share buy-backs during 2019E |
|
|
0 |
0.0 |
||||
International total |
lumes |
84 |
26 |
202 |
180 |
180 |
|
Equity value |
|
|
|
10,435 |
20.9 |
||
Total production |
lumes |
1,076 |
1,161 |
1,445 |
1,415 |
1,394 |
|
|
|
|
|
|
|
||
Rounded to |
|
|
|
|
21.0 |
||||||||||
Attributable Cu eq volumes, kt |
214 |
230 |
287 |
281 |
277 |
|
Share price on 7/1/2019 |
|
|
|
|
27.1 |
|||
Volume growth |
|
-0.5% |
7.9% |
24.5% |
-2.1% |
-1.5% |
|
Expected share price return |
|
|
|
|
-22.4% |
||
|
|
|
|
|
|
|
|
|
|
Plus: expected dividend yield |
|
|
|
|
3.5% |
Contribution to FY19E mining EBITDA |
|
|
|
|
|
|
Total implied one-year return |
|
|
|
|
-18.9% |
|||
Share price range, ZAR:
|
Kusasalethu |
|
||
Hidden Valley |
|
7% |
Doornkop |
|
|
|
6% |
|
|
22% |
|
|
|
|
|
|
|
Tshepong/Phakisa |
|
|
|
|
|
|
|
|
|
|
18% |
Surface |
|
|
|
|
6% |
|
|
|
Masimong |
|
|
|
|
|
|
|
|
|
4% |
Moab |
|
|
Bambanani |
Target 1 |
Unisel |
Joel |
3% |
||
25% |
8% |
|
||
|
1% |
0% |
|
|
12-month high on 16-10-2018 |
32 |
12-month low on 30-1-2018 |
19 |
|||
Price move since high |
-14.1% |
Price move since low |
|
42.4% |
||
Calculation of WACC |
|
|
|
|
|
|
WACC |
13.0% |
Cost of debt |
|
|
10.0% |
|
Risk-free rate |
9.0% |
Tax rate |
|
|
28% |
|
Equity risk premium |
5.0% |
After-tax cost of debt |
|
1.1% |
||
Beta |
1.00 |
Debt weighting |
|
15% |
||
Cost of equity |
14.0% |
Terminal growth rate |
|
6.0% |
||
Valuation ratios |
|
|
|
|
|
|
Dec-YE, $mn |
2017 |
2018 |
|
2019E |
2020E |
2021E |
P/E multiple |
12.9x |
13.8x |
|
4.7x |
3.9x |
6.3x |
Dividend yield |
2.2% |
1.5% |
|
3.0% |
3.9% |
2.4% |
EV/EBITDA |
4.0x |
3.1x |
|
2.0x |
1.6x |
1.8x |
P/B |
0.6x |
0.5x |
|
0.5x |
0.4x |
0.4x |
NAV per share, ZAR |
66.6 |
50.7 |
|
56.5 |
63.0 |
66.8 |
Source: Bloomberg, Thomson Reuters, Renaissance Capital estimates
70

vk.com/id446425943
Polymetal – HOLD
Renaissance Capital
14 January 2019
Metals & Mining
Figure 106: Polymetal, $mn (unless otherwise stated) |
|
|
|
|
|
|
|
|
|
|
|
|||||||
Polymetal |
|
|
|
|
POLYP.L |
|
|
|
|
|
Target price, GBP: |
|
|
8.60 |
||||
Market capitalisation, $mn: |
|
|
|
5,175 |
|
|
|
|
|
|
Share price, GBP: |
|
|
8.66 |
||||
Enterprise value, $mn: |
|
|
|
6,595 |
|
|
|
|
|
|
Potential 12-month return: |
|
5.9% |
|||||
|
|
|
|
|
|
|
|
|
|
|
|
|
|
|
|
|
|
|
Dec-YE |
|
|
|
|
2016 |
2017 |
|
2018E |
2019E |
2020E |
Dec-YE |
2016 |
2017 |
|
2018E |
2019E |
2020E |
|
Income statement |
|
|
|
|
|
|
|
|
|
|
Balance sheet |
|
|
|
|
|
|
|
Revenue |
|
|
|
1,583 |
1,815 |
|
1,914 |
2,148 |
2,181 |
|
Net operating assets |
2,424 |
2,828 |
|
3,085 |
3,214 |
3,445 |
|
EBITDA |
|
|
|
|
759 |
745 |
|
788 |
1,094 |
1,105 |
|
Investments, net of rehab provision |
-113 |
-101 |
|
-99 |
-99 |
-99 |
EBIT |
|
|
|
|
604 |
531 |
|
601 |
920 |
925 |
|
Equity |
981 |
1,307 |
|
1,545 |
1,956 |
2,270 |
Net interest |
|
|
|
-17 |
-67 |
|
-60 |
-60 |
-51 |
|
Minority interest |
0 |
0 |
|
0 |
0 |
0 |
|
Taxation |
|
|
|
|
-169 |
-89 |
|
-103 |
-172 |
-175 |
|
Net debt |
1,330 |
1,420 |
|
1,442 |
1,159 |
1,076 |
Minority interest in profit |
|
|
0 |
0 |
|
0 |
0 |
0 |
|
|
|
|
|
|
|
|
||
Net profit for the year |
|
|
395 |
354 |
|
446 |
688 |
699 |
|
Balance sheet ratios |
|
|
|
|
|
|
||
Underlying earnings |
|
|
382 |
376 |
|
426 |
688 |
699 |
|
Gearing (net debt/(net debt+equity)) |
57.6% |
52.1% |
|
48.3% |
37.2% |
32.2% |
||
Underlying EPS, USc |
|
|
90 |
88 |
|
94 |
147 |
149 |
|
Net debt to EBITDA |
1.8x |
1.9x |
|
1.8x |
1.1x |
1.0x |
||
|
|
|
|
RoCE |
28.1% |
20.0% |
|
20.1% |
28.7% |
27.3% |
||||||||
Consensus EPS, USc |
|
|
|
|
|
90 |
108 |
120 |
|
RoIC (after tax) |
21.2% |
15.9% |
|
17.5% |
23.0% |
22.0% |
||
DPS declared, USc |
|
|
|
42 |
44 |
|
47 |
74 |
75 |
|
RoE |
52.1% |
32.9% |
|
29.9% |
39.3% |
33.1% |
|
Consensus DPS, USc |
|
|
|
|
|
44 |
52 |
61 |
|
Cash flow statement |
|
|
|
|
|
|
||
|
|
|
|
|
|
|
|
|
|
|
|
|
|
|
|
|
|
|
Adjusted EBIT |
|
|
|
|
|
|
|
|
|
|
Operating cash flow |
490 |
574 |
|
687 |
927 |
929 |
|
Voro |
|
|
|
|
102 |
85 |
|
73 |
64 |
62 |
|
Capex (net of disposals) |
-288 |
-432 |
|
-365 |
-380 |
-420 |
EBIT margin |
|
|
|
65% |
55% |
|
57% |
59% |
58% |
|
Other cash flows |
-116 |
-29 |
|
-87 |
60 |
0 |
|
Okhotsk operations |
|
|
|
78 |
138 |
|
152 |
118 |
114 |
|
Free cash flow |
86 |
114 |
|
236 |
607 |
509 |
|
EBIT margin |
|
|
|
44% |
49% |
|
55% |
58% |
56% |
|
Equity shareholders' cash |
126 |
48 |
|
184 |
560 |
468 |
|
Dukat |
|
|
|
|
246 |
141 |
|
112 |
149 |
166 |
|
Dividends and share buy-backs |
-158 |
-138 |
|
-206 |
-277 |
-385 |
EBIT margin |
|
|
|
49% |
35% |
|
31% |
39% |
41% |
|
Surplus (deficit) cash |
-32 |
-90 |
|
-22 |
283 |
83 |
|
Omolon |
|
|
|
|
96 |
93 |
|
75 |
109 |
107 |
|
Cash flow ratios |
|
|
|
|
|
|
EBIT margin |
|
|
|
46% |
35% |
|
35% |
42% |
41% |
|
115 |
109 |
|
108 |
94 |
92 |
||
Varvara |
|
|
|
|
25 |
39 |
|
62 |
87 |
78 |
|
Working capital turnover, days |
|
|||||
EBIT margin |
|
|
|
25% |
25% |
|
34% |
42% |
37% |
|
FCF yield |
1.4% |
1.7% |
|
3.9% |
9.6% |
8.1% |
|
Amursk-Albazino |
|
|
|
130 |
113 |
|
156 |
157 |
148 |
|
Equity shareholders' yield |
2.6% |
0.9% |
|
4.1% |
10.8% |
9.0% |
|
EBIT margin |
|
|
|
44% |
32% |
|
37% |
42% |
40% |
|
Capex/EBITDA |
37.9% |
58.0% |
|
46.3% |
34.7% |
38.0% |
|
Other |
|
|
|
|
-73 |
-77 |
|
-29 |
235 |
251 |
|
Cash conversion |
0.3x |
0.1x |
|
0.4x |
0.8x |
0.7x |
Adjusted EBIT |
|
|
|
604 |
531 |
|
601 |
920 |
925 |
|
Valuation |
|
|
|
|
|
|
|
|
|
|
|
|
|
|
|
|
|
|
|
|
|
|
|
|
|
|
Income statement ratios |
|
|
|
|
|
|
|
|
|
SoTP DCF fair value and calculation of target price |
|
|
|
$mn |
GBP/sh |
|||
EBITDA margin |
|
|
|
48% |
41% |
|
41% |
51% |
51% |
|
Voro |
|
|
|
|
331 |
0.55 |
|
EBIT margin |
|
|
|
38% |
29% |
|
31% |
43% |
42% |
|
Okhotsk operations |
|
|
|
|
612 |
1.01 |
|
Underlying EPS Growth |
|
|
28% |
-2% |
|
7% |
56% |
1% |
|
Dukat |
|
|
|
|
998 |
1.65 |
||
Dividend payout ratio |
|
|
47% |
50% |
|
50% |
50% |
50% |
|
Omolon |
|
|
|
|
628 |
1.04 |
||
Input assumptions |
|
|
|
|
|
|
|
|
|
|
Varvara |
|
|
|
|
900 |
1.49 |
|
|
|
|
|
|
|
|
|
|
|
Amursk-Albazino |
|
|
|
|
705 |
1.17 |
||
Gold, $/oz |
|
|
|
1,248 |
1,258 |
|
1,269 |
1,350 |
1,338 |
|
Armenia |
|
|
|
|
-4 |
-0.01 |
|
Silver, $/oz |
|
|
|
17.1 |
17.1 |
|
15.7 |
16.7 |
17.8 |
|
Mayskoye |
|
|
|
|
237 |
0.39 |
|
$/RUB |
|
|
|
|
67.0 |
58.3 |
|
62.8 |
67.0 |
68.0 |
|
Kyzyl |
|
|
|
|
2,094 |
3.47 |
$/KZT |
|
|
|
|
342 |
326 |
|
345 |
363 |
353 |
|
Nezhda |
|
|
|
|
828 |
1.37 |
Gold breakeven price, $/oz |
|
|
748 |
861 |
|
861 |
780 |
762 |
|
Corporate and other |
|
|
|
|
-771 |
-1.28 |
||
Gold equivalent production volumes, koz |
|
|
|
|
|
|
|
|
Operating value |
|
|
|
|
6,556 |
10.85 |
|||
|
|
|
|
|
|
|
|
Financial instruments and rehab provision as at 31 December 2017 |
|
-101 |
-0.17 |
|||||||
Voro lumes |
|
|
|
129 |
120 |
|
101 |
80 |
80 |
|
Enterprise value |
|
|
|
|
6,455 |
10.69 |
|
Okhotsk operations |
lumes |
|
|
131 |
186 |
|
229 |
152 |
152 |
|
Net debt as at 31 December 2017 |
|
|
|
|
-1,420 |
-2.35 |
|
Dukat |
lumes |
|
|
|
369 |
322 |
|
310 |
304 |
304 |
|
Minority interest |
|
|
|
|
0 |
0.00 |
Omolon |
lumes |
|
|
|
170 |
202 |
|
182 |
195 |
195 |
|
Prognoz valued at 70% of acquisition price |
|
|
|
|
151 |
0.25 |
Varvara |
lumes |
|
|
|
85 |
130 |
|
143 |
157 |
157 |
|
Cash raised in rights issue during 2018E |
|
|
|
|
0 |
0.00 |
Amursk-Albazino |
lumes |
|
|
244 |
268 |
|
322 |
278 |
278 |
|
Equity value |
|
|
|
|
5,186 |
8.59 |
|
Armenia lumes |
|
|
|
26 |
50 |
|
54 |
8 |
0 |
|
|
|
|
|
|
|
|
|
|
|
|
Rounded to |
|
|
|
|
|
8.60 |
|||||||||
Mayskoye lumes |
|
|
|
116 |
124 |
|
136 |
135 |
135 |
|
Share price on 7/1/2019 |
|
|
|
|
|
8.66 |
|
Kyzyl lumes |
|
|
|
0 |
0 |
|
80 |
300 |
330 |
|
Expected share price return |
|
|
|
|
|
-0.7% |
|
Total volumes |
|
|
|
1,268 |
1,402 |
|
1,556 |
1,610 |
1,631 |
|
Plus: expected dividend yield |
|
|
|
|
|
6.7% |
|
Volume growth |
|
|
|
0% |
11% |
|
11% |
3% |
1% |
|
Total implied one-year return |
|
|
|
|
|
5.9% |
|
Contribution to FY18E adjusted EBITDA |
|
|
|
|
|
|
|
|
Share price range, GBP: |
|
|
|
|
|
|
|||
|
|
|
|
|
|
|
|
|
|
|
|
|
|
|||||
|
|
|
|
|
|
|
|
|
|
|
|
12-month high on 15-1-2018 |
9.45 12-month low on 10-4-2018 |
5.78 |
||||
|
|
|
Mayskoye |
Kyzyl |
Voro |
|
|
|
|
Price move since high |
-8.3% Price move since low |
|
49.9% |
|||||
|
|
|
|
|
|
|
|
|
|
|
|
|
|
|||||
|
Armenia |
6% |
|
2% |
10% |
|
|
|
|
Calculation of WACC |
|
|
|
|
|
|
||
|
|
2% |
|
|
|
|
|
|
|
|
|
|
|
|
|
|
|
|
Amursk-Albazino |
|
|
|
|
|
|
|
|
Okhotsk |
WACC |
8.2% |
Cost of debt |
|
|
5.0% |
|||
|
|
|
|
|
|
|
|
Risk-free rate |
4.0% |
Tax rate |
|
|
20% |
|||||
23% |
|
|
|
|
|
|
|
|
|
|
||||||||
|
|
|
|
|
|
|
|
|
|
20% |
|
Equity risk premium |
6.0% After-tax cost of debt |
|
1.2% |
|||
|
|
|
|
|
|
|
|
|
|
|
|
Beta |
1.00 |
Debt weighting |
|
30% |
||
|
|
|
|
|
|
|
|
|
|
|
|
Cost of equity |
10.0% |
Terminal growth rate |
|
2.0% |
||
|
Varvara |
|
|
|
|
|
|
|
|
|
Valuation ratios |
|
|
|
|
|
|
|
|
|
|
|
|
|
|
|
|
|
Dec-YE, $mn |
2016 |
2017 |
|
2018E |
2019E |
2020E |
||
|
9% |
|
|
|
|
|
|
|
Dukat |
|
|
|
||||||
|
|
Omolon |
|
|
|
|
|
|
P/E multiple |
12.5x |
13.6x |
|
10.3x |
7.5x |
7.4x |
|||
|
|
|
|
|
|
|
17% |
|
|
|
||||||||
|
|
|
11% |
|
|
|
|
|
|
|
|
Dividend yield |
3.7% |
3.7% |
|
4.9% |
6.7% |
6.8% |
|
|
|
|
|
|
|
|
|
|
|
|
EV/EBITDA |
8.1x |
8.8x |
|
7.6x |
5.8x |
5.7x |
|
|
|
|
|
|
|
|
|
|
|
|
P/B |
4.9x |
3.9x |
|
2.9x |
2.7x |
2.3x |
|
|
|
|
|
|
|
|
|
|
|
|
NAV per share, $ |
2.3 |
3.0 |
|
3.3 |
4.2 |
4.8 |
Source: Bloomberg, Thomson Reuters, Renaissance Capital estimates
71
vk.com/id446425943
PJSC Polyus – BUY
Renaissance Capital
14 January 2019
Metals & Mining
Figure 107: Polyus Gold, $mn (unless otherwise stated)
|
|
|
|
PJSC Polyus (MOEX) |
PLZL.MM |
Target price, RUB: |
6,300 |
Market capitalisation, $mn: |
10,279 |
Share price, RUB: |
5,287 |
Enterprise value, $mn: |
13,448 |
Potential 12-month return: |
25.5% |
Dec-YE |
|
|
2016 |
2017 |
2018E |
2019E |
2020E |
Income statement |
|
|
|
|
|
||
Revenue |
|
|
2,458 |
2,721 |
2,829 |
3,749 |
3,707 |
Adjusted EBITDA |
1,536 |
1,702 |
1,831 |
2,514 |
2,457 |
||
Adjusted EBIT |
1,363 |
1,485 |
1,507 |
2,188 |
2,123 |
||
Net interest |
|
410 |
76 |
-676 |
-194 |
-177 |
|
Taxation |
|
|
-326 |
-290 |
-101 |
-399 |
-389 |
Minority interest in profit |
-25 |
-1 |
-10 |
0 |
0 |
||
Net profit for the year |
1,420 |
1,240 |
756 |
1,592 |
1,556 |
||
Adjusted earnings |
952 |
1,015 |
1,298 |
1,595 |
1,556 |
||
Adjusted EPS, USc |
676 |
789 |
981 |
1,205 |
1,176 |
||
Consensus EPS, USc |
|
|
956 |
915 |
1,025 |
||
DPS declared, USc |
0 |
405 |
425 |
495 |
576 |
||
Consensus DPS, USc |
|
|
431 |
469 |
508 |
||
Adjusted EBITDA |
753 |
953 |
1,104 |
1,275 |
1,286 |
||
Olimpiada |
|
|
|||||
EBITDA margin |
63% |
66% |
71% |
73% |
72% |
||
Blagodatnoye |
|
417 |
414 |
365 |
440 |
459 |
|
EBITDA margin |
72% |
71% |
67% |
71% |
69% |
||
Verninskoye |
|
146 |
149 |
184 |
184 |
179 |
|
EBITDA margin |
62% |
57% |
63% |
65% |
64% |
||
Alluvials |
|
|
90 |
54 |
40 |
55 |
49 |
EBITDA margin |
40% |
28% |
24% |
31% |
29% |
||
Kuranakh |
|
|
107 |
109 |
117 |
139 |
134 |
EBITDA margin |
53% |
50% |
52% |
56% |
54% |
||
Natalka |
|
|
0 |
0 |
11 |
419 |
351 |
EBITDA margin |
- |
- |
33% |
62% |
61% |
||
Other |
|
|
-150 |
-194 |
-316 |
-325 |
-334 |
Adjusted EBITDA |
1,363 |
1,485 |
1,507 |
2,188 |
2,123 |
||
Income statement ratios |
|
|
|
|
|
||
EBITDA margin |
62% |
63% |
65% |
67% |
66% |
||
EBIT margin |
|
55% |
55% |
53% |
58% |
57% |
|
Adjusted EPS Growth |
38% |
17% |
24% |
23% |
-2% |
||
Dividend payout ratio |
0% |
51% |
43% |
41% |
49% |
||
Input assumptions |
|
|
|
|
|
||
Gold, $/oz |
|
|
1,248 |
1,258 |
1,269 |
1,350 |
1,338 |
$/RUB |
|
|
67.0 |
58.3 |
62.8 |
67.0 |
68.0 |
Gold breakeven price, $/oz |
715 |
830 |
909 |
931 |
1,021 |
||
Gold production volumes, koz |
|
|
|
|
|
||
Olimpiada lumes |
984 |
1,177 |
1,304 |
1,313 |
1,354 |
||
Blagodatnoye |
lumes |
457 |
457 |
415 |
462 |
493 |
|
Verninskoye lumes |
186 |
206 |
228 |
210 |
210 |
||
Alluvials |
lumes |
169 |
146 |
136 |
132 |
128 |
|
Kuranakh |
lumes |
160 |
171 |
178 |
185 |
185 |
|
Natalka |
lumes |
6 |
3 |
137 |
498 |
429 |
|
Sukhoi Log |
lumes |
0 |
0 |
0 |
0 |
0 |
|
Total volumes |
1,960 |
2,160 |
2,398 |
2,801 |
2,800 |
||
Volume growth |
11% |
10% |
11% |
17% |
0% |
||
Contribution to FY18E adjusted EBITDA
Alluvials |
Kuranakh |
NatalkaOther |
|
2% |
6% |
1% |
1% |
Verninskoye |
|
|
Olimpiada |
10% |
|
|
60% |
Blagodatnoye
20%
Dec-YE |
2016 |
2017 |
|
2018E |
2019E |
2020E |
Balance sheet |
|
|
|
|
|
|
Net operating assets |
3,254 |
4,406 |
|
4,538 |
4,847 |
5,089 |
Investments, net of rehab provision |
-427 |
-673 |
|
-767 |
-767 |
-767 |
Equity |
-508 |
564 |
|
403 |
1,340 |
2,135 |
Minority interest |
94 |
92 |
|
86 |
86 |
86 |
Net debt |
3,241 |
3,077 |
|
3,281 |
2,653 |
2,102 |
Balance sheet ratios |
|
|
|
|
|
|
Gearing (net debt/(net debt+equity)) |
118.6% |
84.5% |
|
89.1% |
66.4% |
49.6% |
Net debt to EBITDA |
2.1x |
1.8x |
|
1.8x |
1.1x |
0.9x |
RoCE |
47.1% |
37.5% |
|
32.8% |
45.8% |
42.0% |
RoIC (after tax) |
40.6% |
31.0% |
|
24.7% |
36.8% |
33.7% |
RoE |
129.7% |
3625.0% |
|
268.4% |
183.0% |
89.6% |
Cash flow statement |
|
|
|
|
|
|
Operating cash flow |
1,386 |
1,483 |
|
1,440 |
2,037 |
2,021 |
Capex (net of disposals) |
-466 |
-804 |
|
-814 |
-596 |
-565 |
Other cash flows |
-1,036 |
-245 |
|
192 |
-3 |
0 |
Free cash flow |
-116 |
434 |
|
818 |
1,439 |
1,456 |
Equity shareholders' cash |
714 |
738 |
|
371 |
1,283 |
1,314 |
Dividends and share buy-backs |
-3,591 |
-574 |
|
-575 |
-655 |
-762 |
Surplus (deficit) cash |
-2,877 |
164 |
|
-204 |
628 |
552 |
Cash flow ratios |
23 |
20 |
|
29 |
26 |
28 |
Working capital turnover, days |
|
|||||
FCF yield |
-1.0% |
3.3% |
|
6.0% |
11.0% |
11.6% |
Equity shareholders' yield |
8.7% |
7.3% |
|
3.6% |
12.4% |
12.7% |
Capex/EBITDA |
30.3% |
47.2% |
|
44.4% |
23.7% |
23.0% |
Cash conversion |
0.8x |
0.7x |
|
0.3x |
0.8x |
0.8x |
Valuation |
|
|
|
|
LSE |
MOEX |
|
|
|
|
|||
SoTP DCF fair value and calculation of target price |
$mn |
$/share |
RUB/sh |
|||
Olimpiada |
|
|
|
9,306 |
35.2 |
4,712 |
Blagodatnoye |
|
|
|
3,140 |
11.9 |
1,590 |
Verninskoye |
|
|
|
1,297 |
4.9 |
657 |
Alluvials |
|
|
|
110 |
0.4 |
56 |
Kuranakh |
|
|
|
868 |
3.3 |
439 |
Natalka |
|
|
|
2,985 |
11.3 |
1,511 |
Sukhoi Log |
|
|
|
-40 |
-0.2 |
-20 |
Other |
|
|
|
-1,282 |
-4.8 |
-649 |
Operating value |
|
|
|
16,384 |
61.9 |
8,295 |
Financial instruments and rehab provision as at 31 December 20 |
-673 |
-2.5 |
-341 |
|||
Enterprise value |
|
|
|
15,711 |
59.4 |
7,954 |
Net debt as at 31 December 2017 |
|
|
|
-3,077 |
-11.6 |
-1,558 |
Minority interest |
|
|
|
-92 |
-0.3 |
-47 |
Convertible debt cost at conversion price |
|
|
|
-58 |
-0.2 |
-29 |
Cash raised in rights issue during 2018E |
|
|
|
0 |
0.0 |
0 |
Equity value |
|
|
|
12,485 |
47.2 |
6,321 |
Rounded to |
|
|
|
|
47.0 |
6,300 |
Share price on 7/1/2019 |
|
|
|
|
38.0 |
5,287 |
Expected share price return |
|
|
|
|
23.7% |
19.2% |
Plus: expected dividend yield |
|
|
|
|
6.4% |
6.4% |
Total implied one-year return |
|
|
|
|
30.0% |
25.5% |
Share price range, RUB |
|
|
|
|
|
|
12-month high on 3-1-2019 |
5,468 12-month low on 9-4-2018 |
3,208 |
||||
Price move since high |
-3.3% |
Price move since low |
|
64.8% |
||
Calculation of WACC |
|
|
|
|
|
|
WACC |
8.7% |
Cost of debt |
|
|
7.0% |
|
Risk-free rate |
4.0% |
Tax rate |
|
|
20% |
|
Equity risk premium |
6.0% After-tax cost of debt |
|
1.7% |
|||
Beta |
1.00 |
Debt weighting |
|
30% |
||
Cost of equity |
10.0% |
Terminal growth rate |
|
2.0% |
||
Valuation ratios |
|
|
|
|
|
|
Dec-YE, $mn |
2016 |
2017 |
|
2018E |
2019E |
2020E |
P/E multiple |
9.4x |
9.7x |
|
8.0x |
6.5x |
6.6x |
Dividend yield |
0.0% |
5.3% |
|
5.4% |
6.3% |
7.4% |
EV/EBITDA |
7.5x |
7.8x |
|
7.5x |
5.2x |
5.1x |
P/B |
-16.2x |
17.9x |
|
25.7x |
7.7x |
4.8x |
NAV per share, $ |
-3.9 |
4.3 |
|
3.0 |
10.1 |
16.1 |
Source: Bloomberg, Thomson Reuters, Renaissance Capital estimates
72