

Emerging Tools for Single-Cell Analysis
.pdfConstruction of the Nozzle Assembly |
37 |
F i g . 2.9. Relationship break-off point and the amplitude of the piezosignal. A piezoelement element driven by an oscillator seeds a periodic vibration onto the jet surface. The break-off point, which can be expressed either as a length (distance from the nozzle tip) or a time (microseconds of drop periods traveled from nozzle tip to break-off point), is proportional to the logarithm of the signal amplitude (see text).
drop formation is already achieved at 150 mV or a surface wave with an amplitude of 6 nm. The graph in Figure 2.9 also demonstrates an increase in jet-length stability with signal amplitude. At a drive voltage of 1 V, a 25-mV variation in the drive signal changes the position of the break-off point by only 1/10 of a drop. The same change in a drive voltage of 100 mV causes the break-off point to shift one drop.
CONSTRUCTION OF THE NOZZLE ASSEMBLY
The nozzle assembly must impose a small but stable vibration onto the jet. The placement of the vibrating element and the path of the acoustic waves are crucial. A path that leads the waves through the sheath fluid may efficiently guide the energy to the nozzle throat but may render the energy coupling dependent on the properties of the fluid and the presence or absence of air pockets in the fluid cavity. For these reasons, the vibrations are best transmitted through the nozzle body. Resonance frequencies in the nozzle body and associated hardware may be helpful or destructive. A clear
38 |
High-Speed Cell Sorting |
resonance frequency may help to preferentially transfer the desired seed frequency while suppressing other parasitic frequencies. On the other hand, resonant modes are difficult to maintain at a constant amplitude, and a small drift in the resonance frequency may cause phase shifts between the vibration driver and the resonant body. Add to all of this that the fluid path must allow laminar flow, deliver the sample precisely, and be easy to sterilize, and it will be clear that the construction of the nozzle assembly and vibration unit is one of the most critical aspects of sorter design.
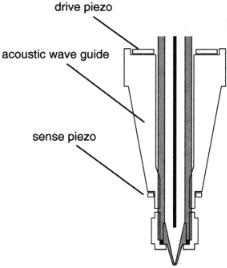
Figure 2.10 shows an example of a good nozzle and acoustic waveguide combination (van den Engh, 1998, 1999). The fluid and the acoustic waves are guided toward the nozzle tip via separate paths. The presence of air bubbles has minimal effect on the energy transfer. The wetted channels consist of simple straight tubes that can be replaced easily. The annular piezodriver connects to the base of a horn that focuses the energy toward the tip. The horn shape suppresses transverse or higher-order longitudinal resonance modes that may interfere with the vibration signal. A piezosensor near the nozzle tip monitors the acoustic waves in the nozzle body and may be used in a closed-loop oscillator for improved long-term stability of the vibration transfer. This design may be further enhanced with temperature and pressure sensors for stabilizing the physical properties of the fluid and resonator body.
Small acoustic signals guide the drop formation. External noise signals may interfere with the drive signal and temporarily shift the drop boundaries. Therefore, all fluid paths and containers must be acoustically isolated from the outside world. Temperature stability is crucial. Heatand noise-producing devices should be mechanically isolated from the fluidics and placed well away from the nozzle head and drop deflection system. The trend to build neatly packaged sorters in which lasers, which generate more heat than light, fluidics, pumps, power supplies, and other noisy com-
F i g . 2.10. Nozzle with separate acoustic waveguide and sense piezoelement.

Timing and Drop Deflection Synchronization |
39 |
ponents are housed in a single enclosure with tubing firmly affixed to an acoustically polluted frame is detrimental for instrument stability. It is remarkable that none of the commercial instruments provides the means to monitor the temperature of the critical sorter components or to thermally stabilize system components other than the sample input and collection path. Apparently the biologists who work with the machines are more concerned about their sample than are the engineers about the stability of the instrument. There is much opportunity to improve sorter performance by paying attention to the thermal and acoustic properties of flow cytometers and cell sorters.
TIMING AND DROP DEFLECTION SYNCHRONIZATION
One of the challenges of cell sorting is to correctly synchronize cell identification with drop deflection and to keep the two in sync over long periods. The drop formation is guided by a periodic vibration that is coupled to the nozzle tip. Drops are deflected by a circuit that applies a charge to the stream in synchrony with the drop separation. The particles to be sorted pass the measurement point at random times. Special circuitry must calculate when these cells are being sequestered into a drop and whether this drop is free of unwanted particles. To deflect the wanted drops, a charge pulse of appropriate polarity and amplitude must be applied during a critical time interval. In current sorters, calibration and adjustment of the timing of these circuits are inaccurate, inconvenient, or both and are surrounded by a certain degree of mystery. Furthermore, the settings tend to drift, becoming less accurate as the experiment gets underway. Temporary disturbances, though easily induced, are not easily detected. These deficiencies rapidly become evident under the high-occupancy conditions associated with high-speed sorting. Often recoveries are less than expected, and contamination is higher than acceptable. Obviously, detailed attention to the timing of the sort events is critical and probably is the aspect with most room for improvement.
In order to appreciate problems that may be encountered in sort timing, some theory is useful. In the following we will revisit the relationship between the jet length, the break-off time, and the amplitude of the vibration that guides the drop formation. This time we will include the discontinuity of drop formation and will determine exactly when a drop separates from the main stream. The piezoelement that causes the vibration is driven by a signal with a period τ = 2π/ω. At the nozzle tip, the vibration is transferred to the jet, where it imprints a very small amplitude on the jet surface:
δa = δA cos(ωt)
The disturbance moves with the jet at velocity vj. The magnitude of the disturbance at point x at some distance from the tip is
a(x, t) = A(x) cos ω t – x
vj
40 |
High-Speed Cell Sorting |
where A(x) represents the local amplitude of the oscillation. In case of a disturbance of suitable wavelength (πDjet < λ), the amplitude of the surface oscillations will grow at an exponential rate as it travels down the jet,
A(x) = δA eγt or A(x) = δA eγx/vj |
|
Therefore, at x the jet radius is |
|
ωx |
|
rj = rav + a(x) = rav + δA eγx/vj cos ω t – vj |
At the break-off point xbreak-off, the amplitude of the oscillation is just great enough to bisect the jet,
|
γ |
δA |
dA eγxbreak-off /vj = rav |
v |
rav |
xbreak-off = j ln |
|
This happens at the time when the waist of the oscillation passes the break-off point:
cos ω t – vj |
= –1 |
or ω t – vj |
= π + n2π |
xbreak-off |
|
xbreak-off |
|
where n is an integer. The moment at which a drop separates from the jet is
tbreak-off |
1 |
π |
n2π |
= + + |
|||
|
γ ln (rav/δA) |
ω |
ω |
= nτ + φdrop
The events at the jet tip are of a cyclical nature and are repeated with the periodicity of the drive signal τ. The phase φdrop denotes the phase difference between the signal that drives the piezoelement and the drop cycle at the tip of the jet. At a precise moment during each cycle, a drop snaps from the main stream (Fig. 2.8, snap shot 0). Any electrical charges that are present on the drop at that moment will remain after the drop has separated. An electric pulse that is applied to the jet in synchrony with the drop formation will charge the drop that separated during the presence of the charge pulse. At the beginning of each drop cycle, one must decide whether to charge the next drop or not. Drop charging is therefore carried out in two stages. The charging circuit is prepared (armed) during the drop cycle that precedes the wanted drop. The charge circuit is then triggered at the moment that the preceding drop separates from the main stream.
Consider a cell that is contained in the drop being formed during the cycle that is bounded by times (n – 1)τ + φ and nτ + φ. The drop boundaries passed the measurement point earlier between (n – 1)τ + φ – ∆t and nτ + φ – ∆t. In order to deflect the drop that contains the cell, we must arm the charge circuit after a time ∆t – τ has elapsed since the cell entered the illumination spot.

Adjustment of Charge Synchronization |
41 |
ADJUSTMENT OF CHARGE SYNCHRONIZATION
In order to calculate when to apply a charge pulse to the jet to deflect drops that contain desired particles, we need the following information:
1.the status of the drop drive oscillator;
2.the phase difference between the drop formation and the signal to the drive piezo; and
3.the delay time ∆t between the measurement point and the break-off point.
The drop drive oscillator is derived from a reference signal in the cell sorter and is therefore known.
The phase of drop formation φ can be determined by charging the stream with a pulse that can be varied in phase with respect to the drive signal. The phase setting is optimal when maximal drop deflection is achieved. It is helpful to have a strobe signal that coincides with the charge cycle, rather than with a fixed point of the drive cycle, so that the status of the jet at the onset of charging time may be observed. When adjusted correctly, a strobed video of the jet tip should always show the same image. In a well-tuned system the onset of the charge cycle should coincide with the moment of drop separation (Fig. 2.8, image 0).
The delay between measurement and arming of the charge circuit is determined by sorting test particles onto a microscope slide. The efficiency of the sort is evaluated by counting the number of events in the collected drops. The time delay is set at the value that deposited the largest number of particles onto the slide. This calibration method yields a delay setting with the accuracy of the timing clock.
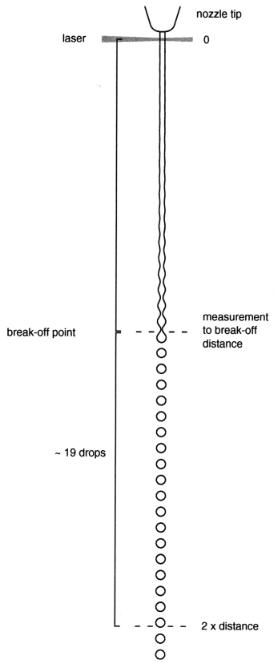
The delay setting is often determined by the visual method illustrated in Figure 2.11, instead of the empirical method described above. The distance from the measurement point to the break-off point is determined using a microscope with an attached micrometer. The microscope is moved an equal distance downstream from the break-off point. The number of drops along this second trajectory is counted and is used as the number of cycles (minus 1) between measurement and charge notification. This method suffers from the following inaccuracies. The method assumes a constant jet velocity. However, due to jet contraction, some acceleration occurs after the jet leaves the nozzle. In addition, drops will accelerate due to the pull of gravity, inducing further inaccuracy in the measurement. There is also a considerable read error in the determination of the illumination point and the break-off point. There is an error in drop count. If each of these measurements has an error of one-eighth of a drop cycle (the time it takes the particle to travel approximately one-fourth of the jet diameter), the cumulative error can be as high as 0.35 of one drop cycle. The visual method should therefore only be used as a rough indication of the delay time and must always be followed with a test sort in which the delay time is varied until maximum particle recovery is achieved.
The accuracy of the delay time is critical. If the delay time is off by a fraction of the drop cycle, that fraction of events will end up in a drop adjacent to the one that is charged and will be missed. Worse, the lost fraction is replaced by a volume of liquid
42 |
High-Speed Cell Sorting |
F i g . 2.11. Procedure for setting the deflection delay with a visual method. The distance between the point where the laser intersects the jet of a cell sorter and the break-off point is measured with a microscope. The microscope is then moved an equal distance down from the tip of the jet. The number of drops counted in the second distance is an estimate for the number of drop periods that elapsed between the illumination point and the tip of the jet.

Stability Break-Off Point |
43 |
that may contain unwanted particles. Contamination due to charge synchronization errors is a serious problem in high-duty-cycle sorting, often resulting in lower yields and higher contamination with unwanted cells than expected.
The importance of an accurate determination of the delay times is illustrated by the following calculation. Consider a sort in which, on average, one in four drops contains a cell. The delay time is determined with an error of one-eighth of a drop cycle. The yield of wanted particles is 7/8, or 87%. For every deflected drop there is a chance of 1/8 × 1/4 = 1/32 that we collect a contaminating particle. The purity of the sorted fraction is (7/8) / (7/8 + 1/32) = ~96%. If the error in the delay time is one-third of a drop, the sort purity will be only ~89%.
The contamination due to inaccuracies in the drop boundary calculation can be avoided by setting an exclusion zone. If any unwanted particles fall in an interval before or after the drop that is calculated to be deflected, the deflection request is ignored. It is prudent to enforce an exclusion zone of twice the timing error on each side of a selected drop. In that case, if the delay time error is one-eighth of a drop, the total area that should be free of coincident events is 1.5 drops. At one cell per four drops, the sort rejection rate will be ~0.35.
Recovery losses that are due to an inaccurate delay setting may be reduced by deflecting more than one drop for each sorted cell. If the drops that precede and follow a selected drop are deflected as well, there is virtually no chance that a cell will be lost because the wrong drop was deflected. However, the coincident rejection zone will obviously increase as the number of sorted drops is increased. A frequently applied strategy is to deflect 1.5 drops. If the cell that is to be selected is calculated to be in the first or last fourth of the drop, the preceding or following drop is deflected as well. Approximately half the sort instructions will result in the deflection of two drops, so that the average number of drops per sorted cell is 1.5. With a further exclusion zone of one-fourth of a drop on either side, the coincident rejection losses at a drop occupancy of 1 in 4 become 0.5. At a drop occupancy exceeding 1 in 20 drops, multiple-drop deflection schemes become counterproductive because the higher recovery of the selected cells is more than negated by the increase in coincident-event rejection.
The foregoing demonstrates that an accurate estimate of the delay time is critical to the cell yield and purity of a sorting experiment. The sorter must have accurate means to determine the proper delay setting at a given break-off point. Once adjusted, the break-off point must remain stable. The next section discusses the monitoring and adjustment of the position of the break-off point.
STABILITY BREAK-OFF POINT
The tip of the jet is observed on a video monitor. During an experiment, a change in conditions may cause the break-off point to drift from its starting position. It is common practice to compensate for changes in the position of the break-off point by adjusting the signal voltage to the piezoelement. If the change in the jet tip is due to a change in efficiency of the coupling of the piezovibration to the nozzle tip, for instance due to the formation of a small air bubble, changing the vibration amplitude of the piezoelement is indeed the proper action. However, not all drifts in the break-off

44 |
High-Speed Cell Sorting |
point are associated with a change in the coupling efficiency and therefore do not require adjustment of the vibration energy.
Besides the seed amplitude δA, the position of the break-off point is also dependent on the properties of the sheath fluid, γ, and the velocity of the jet. A change in γ, for instance due to a change in temperature, will change the break-off time. This alteration, like a change in coupling efficiency, should be corrected by adjusting the vibration amplitude.
On the other hand, the theory predicts that a change in position of the tip of the jet that is due to a change in jet velocity will not result in a change of the delay time. A lower jet velocity will move the break-off point up, but the time at which oscillation cleaves the jet remains the same. Experimental observation confirms the notion that the break-off time is relatively insensitive to changes in the jet velocity. A 20-m/s jet vibrating around 70 kHz must be slowed down by approximately five drop cycles in order to change the delay setting one full drop cycle. This concept is important because the velocity of the jet is quite sensitive to environmental conditions and therefore is a likely cause of changes in the position of the break-off point. During the course of an experiment, the level in the sheath fluid reservoir will slowly decrease. This decrease may cause a change in the nozzle pressure large enough to noticeably affect the velocity of the jet. A jet at 30 psi has a break-off point about 8 mm from the nozzle tip. A drop of 10 cm in the fluid level represents a change of 0.5% in pressure. This change will cause a velocity reduction of 0.25%, which brings the break-off point about 20 m, or 1/10 of a drop, closer to the nozzle tip but will not change the break-off time. If the change in break-off distance is incorrectly compensated by a decrease in voltage to the piezoelement, an error of ~0.1 drop cycle is introduced in the delay setting, which, as demonstrated before, may cause a significant change in cell recovery and/or purity.
Even greater than the effect of the fluid level on the jet velocity are the effects due to temperature changes of the sheath fluid. Roughly 10–20% of the pressure is needed to overcome the friction of the sheath fluid flowing through narrow tubes. The friction is proportional to a property of the fluid called the kinematic viscosity. The kinematic viscosity is very sensitive to temperature. A change of 10°C is associated with a change of 20–30% in the kinematic viscosity. A few degrees Celsius therefore may change the jet velocity by a few percent.
It is evident that the actions in response to a change in the break-off point must be based on a proper diagnosis of the problem. Considering the inaccuracies of the visual method for estimating the delay time and the possible adverse effects of vibra- tion–amplitude adjustments, systems that automatically adjust the break-off point based on measurements on video images should be used with caution.
DROP DEFLECTION, DROP CHARGE, AND FIELD STRENGTH
The charged drops are deflected in a high-voltage (~4000 V) electrostatic field. The deflection distance over which the drops are deflected depends on their charge-to- mass ratio. The charge of the drop is carried on its surface. At the same voltage, small

Multiple Sort Directions and Automated Cell Collection |
45 |
drops, because of their relatively large surface area, have a larger charge-to-mass ratio than do large drops and hence are deflected over a greater distance. The charge density on the drop surface should not be too large. The surface charges repel each other and counteract the surface tension that keeps the drop together. Drops carrying a high charge become unstable and may fragment into smaller droplets. In addition, surface tension is an important component of γ, the property of the jet that controls the position of the jet’s break-off point. A charge pulse of a high voltage may interfere temporarily with the stability of the jet. Information about proper charge pulses and the best methods to apply the charge to the sheath fluid is fragmentary. My personal observation with 70-µm-diameter jets is that these phenomena may cause problems if the charge voltages exceed 80 V. In recurrent stream instabilities, the effect of different charge voltages should be considered. If larger deflection distances are desired, it may be better to extend the length of the deflection plates than to increase the charge voltage.
The surface charge–density of drops may also change by evaporation. In a dry environment, the volume reduction due to evaporation may be significant. Air currents and turbulence from forceful air conditioning equipment that emits alternating blasts of dry and humid air may cause instabilities in the side streams. For long-term stability, the wet bench of the cell sorter should be protected from air currents. The air humidity should be kept constant at a relatively high level, and temperature fluctuations should be avoided. As noted before, the control of temperature (and humidity) is facilitated if heat-producing modules are placed at some distance from the nozzle and sample stream and are thermally isolated from the drop separation and collection area.
MULTIPLE SORT DIRECTIONS AND AUTOMATED CELL COLLECTION
Once stable sort conditions have been obtained, it is possible to apply charge voltages with different amplitudes. Separating a sample into multiple fractions may increase the efficiency of an experiment. Eight-way sorting has been used at the Lawrence Livermore National Laboratory to deposit chromosomes in spots onto hybridization filter (van den Engh et al., unpublished results). One could envision a sorter that would deflect particles with a distance proportional to their fluorescence intensity. An analysis of the gene expression patterns of such a sort could indicate which range of fluorescence intensities is associated with a (DNA) marker with a previously unknown distribution pattern. In this approach the distribution of our marker is determined in a single sort and one test.
In sort experiments, a relatively large amount of time is spent changing sample and collection tubes. These interruptions reduce the effective sort rate. Automated instruments that position tubes, trays, or filters automatically in the collection area or automatically change input samples may greatly increase the overall speed of our experiments. Automated collection equipment may be particularly effective in the collection and presentation of single sorted events. Single-event selection is an important growing area in cell biology. Improvement of collection methods for cell sorters may make a major contribution.

46 |
High-Speed Cell Sorting |
CELL VIABILITY
A discussion of high-speed sorting must include the question of cell viability. Higher pressures and jet velocities increase the risk of cell damage. Fragile cells may be ruptured by high shear forces. Turbulence and rapid acceleration or deceleration of fluid streams should be avoided in all parts of the equipment. The tubing should be short, straight, and without sharp corners and edges. This task is not difficult. The fluid path of the sample can be kept quite simple. Damage due to shear can be kept under control. In the region of highest forces, near the nozzle orifice, the cells follow a trajectory through the center of the stream where the shear forces are smallest. A variety of cell types have been sorted in high-pressure sorters without noticeable detrimental effects (Peters et al., 1985; Sasaki et al., 1995; van den Engh, unpublished observations). There are, however, anecdotal reports of cell damage in systems that use pressures of 30 psi and higher. In reduced recovery of viable cells, the effect of pressure (and sample path modifications) should be considered.
Rapid decompression may cause more of a problem than do shear forces. Oxygen and nitrogen readily dissolve in saline. Under high pressure, significant amounts of gas enter the carrier liquid. In prolonged sort experiments, the content of dissolved gases may change significantly over the course of the experiment. It is possible that high oxygen pressures by themselves are toxic to certain cell types. In passing through the nozzle orifice, the cells undergo a significant and rapid change in pressure that may force the dissolved gases out of solution. Gas bubbles may be an explanation for reduced cell viability. If it is a factor in cell destruction, bubble formation will very much depend on the length of the experiment and the treatment of the sheath fluid before the experiment. Hence the effects of dissolved gases will be erratic in nature. In order to avoid problems with dissolved gases, the use of gas mixtures with a low solubility in water seems worth exploring.
CONCLUSION: PRACTICAL LIMITS OF HIGH-SPEED
CELL SORTING
High-speed sorting concerns instruments that generate 105 drops/s while processing cells at a rate greater than 104 events/s. At such speeds, overall precision and sample purity are determined by coincident events at the illumination site, the maximum frequency of drop formation, multiple cells per drop, and the accuracy of drop boundary calculations. Therefore, high-speed sorting is not merely a matter of increasing the speed of the sorter subsystems. It involves the development of strategies for using the instruments at a high duty cycle, that is, conditions under which the sorter’s components operate near their performance limits. High duty cycles present unique problems that the electronic and logical modules must handle unambiguously, without creating measurement artifacts or sorting errors. For overall efficiency, robustness is at least as important as raw speed. Immunity to failure, low-drift mechanical design, closed-loop alignment, and short turnaround times are important in achieving high effective throughput rates.