

Professional Visual Studio 2005 (2006) [eng]
.pdfChapter 4
Adding Web References
Adding web references is handled in a similar fashion to normal references. It is used to find and connect to web service definitions so that their functions can be consumed from within your application. Choose Add Web Reference from the project’s context menu and the associated dialog will appear, as shown in Figure 4-8.
Figure 4-8
At this point you can browse to web services registered on the machine you’re working on or those specifically created in the active solution. If the web service is external to both of these locations, enter the URL to the WSDL file associated with the required web service and click the OK button.
After the web service is found (assuming it is), the main window will be populated with a list of functions contained within the web service, and the Web Reference Name field will be enabled. Name the reference something that will make sense in your code, as this is the identifier you need to use when creating items based on the web reference, and click the Add Reference button.
Setting Solution Properties
When there is more than one project within a solution, you can choose to select a single or even multiple startup projects in addition to setting a number of other properties relating to the solution as a whole. Locate the solution’s entry in the Solution Explorer, right-click, and choose the Properties command from the context menu.
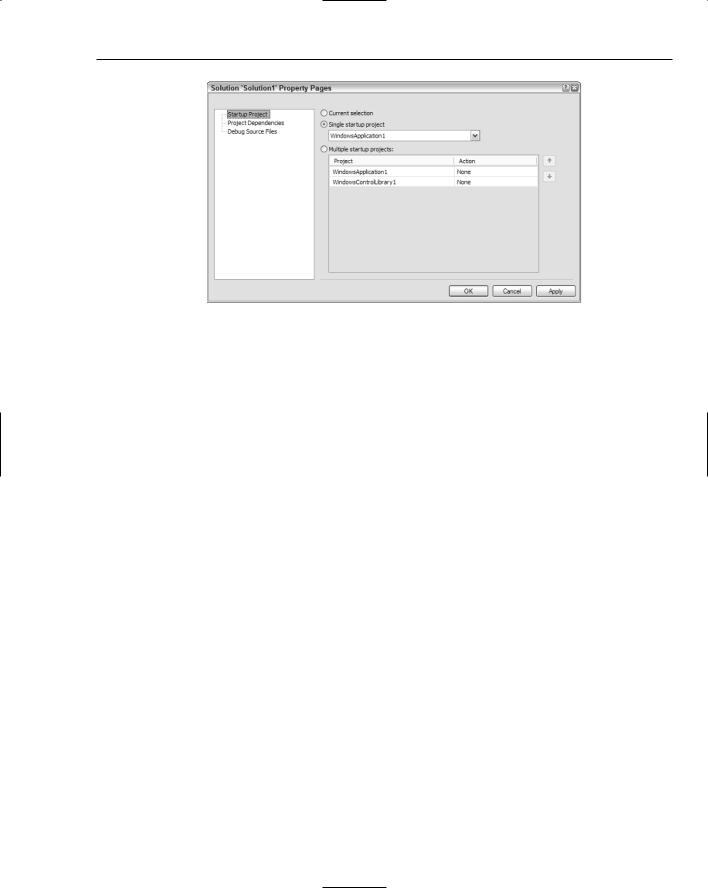
The Solution Property Pages dialog will be displayed, as shown in Figure 4-9. The first item to choose is how the solution should start up when you begin execution. The default behavior is to set a single startup project, which is usually the first one you added to the solution. To change this to another project, you can choose it from the drop-down menu associated with the Single Startup Project option.
46
The Solution Explorer
Figure 4-9
Alternatively, if you require multiple projects to start simultaneously, as is sometimes the case when you have a single solution with separate projects that depend on each other (such as a Windows application and a Windows service), select the Multiple Startup Projects option. Each project can be started with or without debugging symbols, depending on how you want to perform the testing.
This dialog also enables you to specify otherwise implicit project dependencies. For example, if you had a solution with a Windows application and a Windows service but didn’t have an explicit reference to the service and needed to consume it, you could specify here that the service is a dependency in the application, forcing it to build even if it normally wouldn’t need to.
Summar y
The Solution Explorer is a powerful tool window that gives you direct access to the structure of the currently active solution, showing you the files that belong to each project and giving you the ability to add or remove items to available projects, and even add whole projects to the solution. In Chapter 7 you’ll learn a lot more details about how to manage your projects and solutions by examining the properties that belong to solutions, looking at project configurations, and detailing the solution file structure. The next chapter deals with how to customize the IDE of Visual Studio 2005, including how to fine-tune the Solution Explorer window’s position and size.
47


Customizing the IDE
Now that you’re familiar with the general layout of Visual Studio 2005 and what all the various components of the IDE mean, it’s time to shake them up and have some fun — some fun aimed at making the graphical layout more suited to your own way of doing things.
In this chapter you’ll learn several ways to change the environment — from moving the various tool windows and lists around and opening multiple files in separate areas of the workspace so you can view them simultaneously to backing up your settings for retrieval on another machine.
Tool Window Customization
Tool windows are the core of how Visual Studio 2005 can make your working life more efficient, particularly if you’re more comfortable working in an environment that uses the mouse extensively. Each tool window focuses on one particular task or aspect of development. You’ve seen several windows in action already — the Solution Explorer, which enables you to browse through the projects and files that make up the current solution, and the Properties window, which gives you direct access to the properties of the currently selected item in the Design pane, are both tool windows. Similarly, the Toolbox is another window that has a specialized function — to provide the capability to design forms graphically without needing to resort to code to define the various objects that make up a form’s layout.
The preconfigured Visual Studio 2005 environment comes with a small number of these tool windows positioned in logical and useful locations, but these windows are only a small subset of what’s available to you.
Working with Tool Windows
Before you can do anything with a specific tool window, you need to be able to make it visible. Some are shown by default, such as the Properties and Toolbox windows, whereas others, such as the Immediate window, are shown in certain contexts (the Immediate window is shown while you’re debugging but not at design time in all default configurations).

Chapter 5
The selection of windows you can choose to display are all found in the View menu. The most commonly used windows, such as the aforementioned Properties window and the Solution Explorer and Server Explorer, are accessible directly from the View menu, as well as their keyboard shortcuts. However, hidden away in the View Other Windows submenu is an even larger selection of windows to add to your IDE configuration.
Each of these menu items acts as a show command only — to close a particular window, you need to use the Close button on the window itself. If you select the menu item corresponding to a window that is hidden, it will be popped open as if you had hovered the mouse cursor over it.
Every window has a default location in which it is shown. For example, the Bookmarks window will appear docked to the bottom of the IDE, while the Macro Explorer window shares the same space as the Solution Explorer. However, you can position them however you like, as you’ll see in the next section of this chapter.
The following table lists the available tool windows, their associated access shortcut, and what feature of Visual Studio 2005 they handle:
Window |
Menu |
Keyboard Shortcut |
Function |
|
|
|
|
Server Explorer |
View |
Ctrl+Alt+S |
Provides access to Windows Server |
|
|
|
components such as SQL Server |
|
|
|
databases, event logs, and message |
|
|
|
queues |
Solution Explorer |
View |
Ctrl+Alt+L |
Displayed by default, the Solution |
|
|
|
Explorer enables you to view and |
|
|
|
modify your solution structure. For |
|
|
|
more information, refer to Chapter 4. |
Properties Window |
View |
F4 |
Rather than set properties in code, |
|
|
|
you can change many aspects of a |
|
|
|
control, form, or component |
|
|
|
through this window. Chapter 6 |
|
|
|
discusses how the Properties win- |
|
|
|
dow can be used. |
Toolbox |
View |
Ctrl+Alt+X |
Provides direct access to the com- |
|
|
|
ponents currently available for use |
|
|
|
in your form design. Chapter 6 also |
|
|
|
discusses the Toolbox. |
Class View |
View Other |
Ctrl+Shift+C |
Enables you to view your |
|
Windows |
|
application in a hierarchy of classes, |
|
|
|
rather than the normal file structure |
|
|
|
view |
Error List |
View |
Ctrl+W, Ctrl+E |
All errors can be viewed in this list, |
|
|
|
with each entry providing a short- |
|
|
|
cut link to the problematic code. |
|
|
|
|
50

|
|
|
|
Customizing the IDE |
|
|
|
|
|
|
Window |
Menu |
Keyboard Shortcut |
Function |
|
|
|
|
|
|
Bookmark |
View Other |
Ctrl+W, K |
All bookmarks in your code can be |
|
|
Windows |
|
viewed in this summary list. This |
|
|
|
|
window enables you to name each |
|
|
|
|
bookmark so you can more easily |
|
|
|
|
find it. |
|
Code Definition |
View Other |
Ctrl+\, Ctrl+D |
Used for both C# and C++ |
|
|
Windows |
|
application projects, this window is |
|
|
|
|
useful for viewing the file associated |
|
|
|
|
with a selected symbol or definition. |
|
Command |
View Other |
Ctrl+Alt+A |
You can execute commands and |
|
|
Windows |
|
command aliases directly from |
|
|
|
|
within the Command window. |
|
Document Outline |
View Other |
Ctrl+Alt+T |
Document Outline is a special |
|
|
Windows |
|
window that shows you graphically |
|
|
|
|
how the current document or file is |
|
|
|
|
structured. Chapter 13 deals with |
|
|
|
|
the Document Outline window in |
|
|
|
|
detail. |
|
Object Test Bench |
View Other |
None |
This is the main window for the |
|
|
Windows |
|
object test bench — a tool for testing |
|
|
|
|
the various characteristics of your |
|
|
|
|
classes. |
|
Output |
View Other |
Ctrl+Alt+O |
This is the main window for run |
|
|
Windows |
|
time and debug generated output. |
|
|
Debug |
|
See Chapter 48 for information |
|
|
Windows |
|
about how the Output window can |
|
|
|
|
be used. |
|
Breakpoints |
Debug |
Ctrl+Alt+B |
Presents a list of breakpoints |
|
|
Windows |
|
currently inserted into the active |
|
|
|
|
project. Chapter 49 explains how to |
|
|
|
|
use breakpoints when debugging |
|
|
|
|
your application code. |
|
Resource View |
View Other |
Ctrl+Shift+E |
Provides an alternative way of |
|
|
Windows |
|
viewing the resource files associated |
|
|
|
|
with your solution. |
|
Task List |
View Other |
Ctrl+Alt+K |
This window contains a list of both |
|
|
Windows |
|
automatically generated and manu- |
|
|
|
|
ally created tasks that you can use to |
|
|
|
|
track your development progress. |
|
|
|
|
|
|
|
|
|
Table continued on following page |
51

Chapter 5
Window |
Menu |
Keyboard Shortcut |
Function |
|
|
|
|
Macro Explorer |
View Other |
Alt+F8 |
Macros, a way of automating series |
|
Windows |
|
of functions you use often, are dealt |
|
|
|
with in Chapter 26. The Macro |
|
|
|
Explorer enables you to select, run, |
|
|
|
and edit the macros available to |
|
|
|
you in the current solution. |
Call Browser |
View Other |
None |
Only accessible from within C++ |
|
Windows |
|
projects, this window enables you |
|
|
|
to search for function calls. |
Immediate |
Debug |
Ctrl+G |
The Immediate window can be used |
|
Windows |
|
to debug and execute commands |
|
|
|
directly, enabling you to modify |
|
|
|
contents of variables at runtime, as |
|
|
|
well as examine objects and the |
|
|
|
effects of various commands even |
|
|
|
during design time. |
|
|
|
|
Some of the shortcuts listed use what’s known as a shortcut chord. This is a sequence of keyboard combinations, rather than just a single combination. For example, the Error List is shown as Ctrl+W, Ctrl+E. This means you should first press Ctrl+W. Visual Studio 2005 will detect that this is the start of a chord and wait for the second keyboard combination before performing the action. In this case, Ctrl+E will then tell it to open the Error List.
Moving Tool Windows
Moving tool windows has always been a challenge in Visual Studio and its precursors. As the window was dragged around you could never tell where it was going to end up — would it appear on top of another window, floating over the IDE, docked to the side of the IDE or another window, or some other configuration? Even Visual Studio 2003 had problems — in fact, it was even worse in some respects because windows could be tabbed but you were still never sure of how it would turn out when a window was moved.
As a result, many developers left the IDE set up with the default layout and didn’t experiment to find a more suitable design for their work practices. Fortunately, Microsoft’s development team worked hard at introducing a new system for organizing the many windows in the IDE, resulting in an extremely intuitive system for positioning windows accurately.
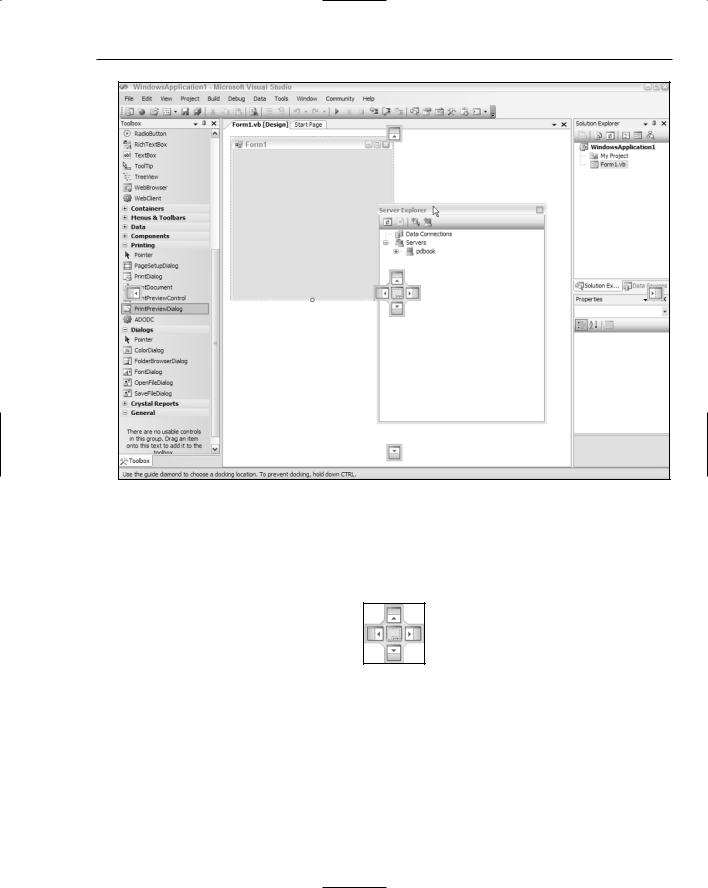
Figure 5-1 shows the Server Explorer window being dragged across the user interface of Visual Studio. As it is being moved, small icons appear in different parts of the screen. If the window is moved on top of one of these icons, Visual Studio will move the window to the appropriate place. Otherwise, the window will be set to float.
52
Customizing the IDE
Figure 5-1
The easiest way to understand how this positioning paradigm works is to zoom in on the main graphical indicators. Figure 5-2 shows a close-up of the central set of icons. As you drag the mouse cursor over each of these buttons, Visual Studio will shade a section of the IDE to show you where the window will be placed if you choose it.
Figure 5-2
The idea is that once you’re happy with the positional preview of the window, you simply let go of the mouse button and Visual Studio moves the window to the indicated location. In Figure 5-2 there are five such positional indicators — the one in the center means that the window will share space with the window that is underneath the buttons, in a tabbed format similar to the Start Page and Form1 Design view shared space in Figure 5-1.
53
Chapter 5
The four buttons surrounding this tabbed indicator will dock the window to the corresponding side of the window underneath the buttons. In the example shown in Figure 5-1, choosing the bottom button in this central configuration would dock the Server Explorer to the bottom of the main workspace, but between the Toolbox and Properties windows.
The separate buttons on the four sides of the IDE indicate that the window being positioned will actually be docked to the very edge of the IDE, rather than the current area underneath the mouse cursor. In the example discussed, dropping the Server Explorer on the button near the bottom edge of the IDE would result in the window being docked not only below the main workspace area, but also below the Toolbox and Properties windows.
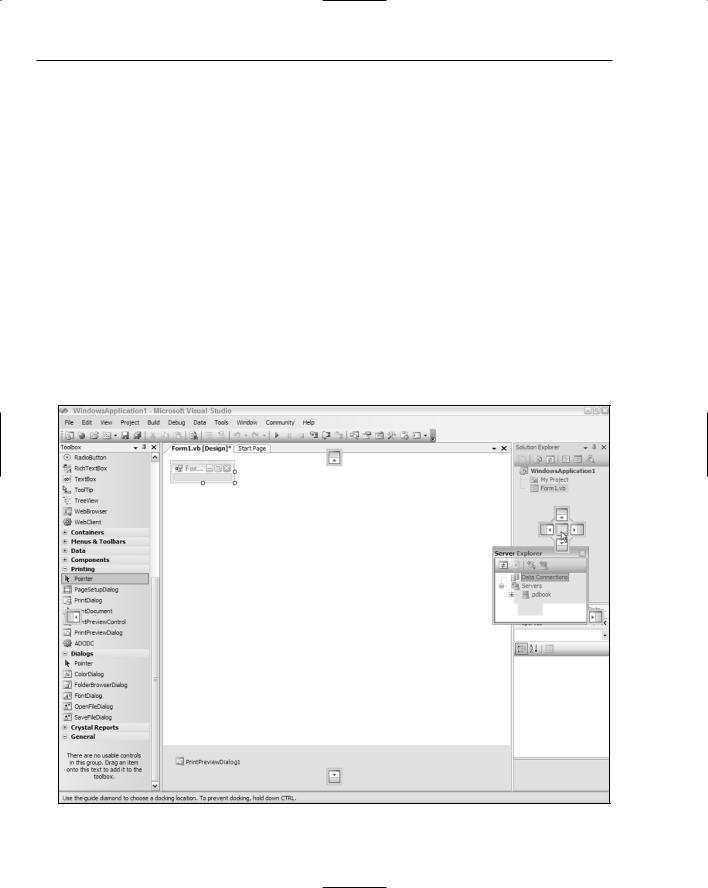
As you drag the window around the IDE’s interface, these indicator buttons will change according to the context in which the window will be placed. Figure 5-3 shows the Server Explorer being positioned over the Solution Explorer. Now, the central icons actually represent the Solution Explorer, not the main workspace area, enabling you to dock the Server Explorer window to any of the four sides of the Solution Explorer or to share the space in a tabbed fashion (which is actually the default behavior for the Server Explorer). The four IDE-edge icons remain, as they are independent of which window the mouse pointer is over.
To float the window above the main IDE environment, simply let the mouse button go when the cursor is not positioned over any of the indicators.
Figure 5-3
54
Customizing the IDE
Once the windows appear in the layout you want, you can then adjust their height or width by clicking and dragging the pertinent edge of the window, and set each window’s auto-hide property with the pin button. Note that unpinning one tool window in a tabbed set will automatically hide the others.
Impor ting and Expor ting IDE Settings
Once you have the IDE in exactly the configuration you want, with the various tool windows placed and sized appropriately and any menu and toolbar customizations done, you may want to back up the settings for future use. This is done by exporting the IDE settings to a file, which can then be used to restore the settings or even transfer the settings to a series of Visual Studio 2005 installations so that they all share the same IDE setup.
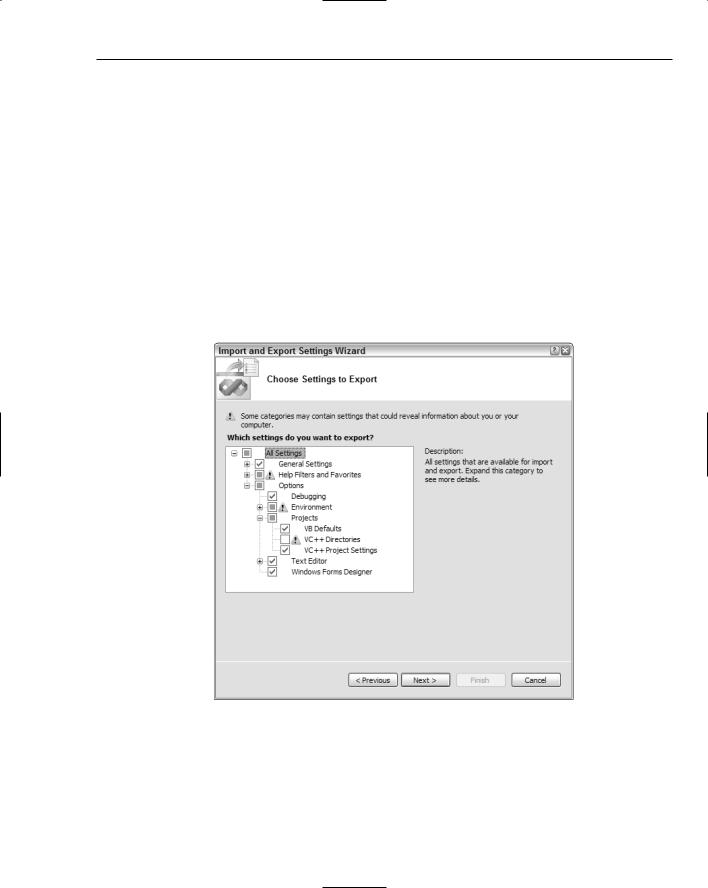
To export the current configuration, select Tools Import and Export Settings to start the Import and Export Settings Wizard, shown in Figure 5-4. The first step in the wizard is to select the Export option and which settings are to be backed up during the export procedure.
Figure 5-4
As displayed in Figure 5-4, a variety of grouped options can be exported. The screenshot shows the Options section expanded, revealing that the Debugging and Projects settings will be backed up along with the Text Editor and Windows Forms Designer configurations. As the small exclamation icons indicate, some settings are not included in the export by default, because they contain information that may infringe on your privacy. You will need to select these sections manually if you wish them to be included in the backup.
55