

Emerging Tools for Single-Cell Analysis
.pdf16 |
Cell-Sorting Technology |
F i g . 1.8A. Representation of the fluidic sorting system that has been implemented in the Partec flow cytometry instruments. The core sample stream and the majority of the sheath normally flow to waste. When a cell targeted for sorting is detected, the piezoelectric device is activated, diverting the core sample stream to sorted fraction collection.
Various numerical and modeling approaches have been used to better predict cell-sorting performance, especially at high speeds (Durack and Durack, 1998; Hoffman and Kouck, 1998; Keij et al., 1991; Rosenblatt et al., 1997). Issues regarding the prediction of these performance parameters for high speed sorting are provided in Chapter 2, and Chapter 3 deals with them in relation to sorting very rare cells.
Fluid-Switching Cell Sorters |
17 |
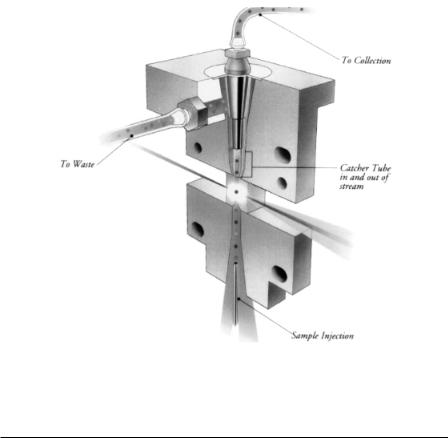
F i g . 1.8B. Fluidic sorting system used in the FACSort manufactured by Becton Dickinson Immunocytometry Systems. The catcher tube is extended by a piezoelectric device to collect cells identified for sorting. The tube can cycle up to 500 times per second. Courtesy of BDIS.
FLUID-SWITCHING CELL SORTERS
Fluid-switching cell sorters have been commercially available in one form or another for nearly two decades (Duhnen et al., 1983; Goehde and Shumann, 1987). The performance of a fluid-switching cell sorter can be described in the same manner as the droplet cell sorter by substituting the cycle time of the piezoelectric sorting system for the droplet generator period (generally 10–100 times longer). While sorting and analysis rates are much lower than what is possible with droplet cell sorters, fluidswitching cell sorters perform quite reliably and provide a measure of biohazard containment not possible for droplet cell sorters (unless they are enclosed in a biohazard safety cabinet). Commercial bench-top instruments are available that offer a “pushbutton” approach to cell sorting. Figure 1.8A shows a diagram for the fluidic cell sorter designed by Goehde and Schumann (1987) and implemented in the Partec fluid-switching sorting system. When a desired cell approaches the bifurcation, a valve driven by a piezoelectric device blocks the waste path, temporarily diverting the flow to the sorted cell collection path. Figure 1.8B shows the system implemented by Becton Dickinson Immunocytometry Systems in the FACSort product. In this case a cell-catcher tube is pushed down into the flowing stream by a piezoelectric device to capture cells targeted for sorting. Stream velocities are much lower in these systems,

18 |
Cell-Sorting Technology |
on the order of 2–5 m/s. This coupled with the duty cycle for the sorting device limits cell-sorting rate to less than 1000 cells/s. While not suitable for high-speed sorting applications, these fluid-switching cell sorters are very useful and economical devices for sorting a limited number of cells at a moderate rate.
AN EMERGING TOOL
The invention of the cell sorter is nearly three decades past, yet aspects of this technology are still emerging as important tools for the research laboratory. Today’s research community continues to increase its collective expectations for cell-sorting technology, placing heavy demands on the existing instrument systems. There are pressing clinical processing needs that require high-speed, sterile sorting systems for sorting sperm cells and hematopoietic stem cells, as described in Chapter 4. There are demands for higher and higher throughput to meet the challenges of isolating rare cells, as discussed in Chapter 3. There are needs for lower detection limits and broader multicolor capabilities. The technical issues and opportunities relevant to addressing many of these needs are discussed in the following four chapters. One of the newest and most rapidly advancing areas is the cytometry-related MEMS technologies, described in Chapter 5. As more research moves into the microlaboratory environment, there will be a strong demand for cell processing microcytometers to operate there. The “flow cytometer on a chip,” predicted by many in the cytometry community, is now an important emerging tool almost certain to arrive in our laboratories in the coming decade.
REFERENCES
Bonner WA, Hulett HR, Sweet RG, Herzenberg LA (1972): Fluorescence activated cell sorting. Rev Sci Instrum 43:404–409.
Crosland-Taylor PJ (1953): A device for counting small particles suspended in a fluid through a tube. Nature 171:37–38.
Cupp JE, Leary JA, Cernichiari E, Wood JC, Doherty RA (1984): Rare-event analysis methods for detection of fetal red blood cells in maternal blood. Cytometry 5:138–144.
Dean PN, Merrill T, Pinkel D, Van Dilla M, Gray JW (1985): The LLNL high speed cell sorter: Design features, operational characteristics, and biological utility. Cytometry 6:290–301.
Duhnen J, Stegemann J, Wiezorek C, Mertens H (1983): A new fluid switching flow sorter. Histochemistry 77:117–121.
Durack G, Durack D (1998): Software simulation of cell sorting to predict instrument performance for high speed cell sorting. Cytometry Suppl 9:115.
Fulwyler MJ (1965): Electronic separation of biological cells by volume. Science 150:910–911.
Goehde H, Schumann J (1987): Fluidic cell sorter. European Pat. EP 0177.718.
Harkins KR, Galbraith DW (1987): Factors governing the flow cytometric analysis and sorting of large biological particles. Cytometry 8:60–70.
Herweijer H, Stokdijk WV (1988): High speed photodamage cell selection using bromodeoxyuridine/ Hoechst 33342 photosensitized cell killing. Cytometry 9:143–149.
References |
19 |
Herzenberg LA, Sweet RG, Herzenberg LA (1976): Fluorescence activated cell sorting. Sci Am 234(3):108–117.
Hoffman RA, Kouck DW (1998): High speed sorting efficiency and recovery: Theory and experiment. Cytometry Suppl 9:142.
Kachel V, Fellner-Feldegg H, Menke E (1990): Hydrodynamic properties. In Melamed MR, Lindmo T, Mendelsohn ML (eds). Flow Cytometry and Sorting, 2nd ed. New York: Wiley-Liss, pp 27–44.
Kachel V, Kordwig E, Glossner E (1977): Uniform lateral orientation of flat particles in flow through systems caused by flow forces. J Histochem Cytochem 25:774–780.
Keij KL, van Rotterdam A, Groenewegen AC, Stokdijk W, Visser JW (1991): Coincidence in high-speed flow cytometry: Models and measurements. Cytometry 12:398–404.
Lindmo T, Peters DC, Sweet RG (1990): Flow sorters for biological cells. In Melamed MR, Lindmo T, Mendelsohn ML (eds). Flow Cytometry and Sorting, 2nd ed. New York: Wiley-Liss, pp 145–170.
Martin JC, Roslaniec MC, Bell-Prince CS, Longmire JL, Jett JH, Cram SL (1998): A photodamage chromosome selector. Cytometry Suppl 9:CT104.
Masuda S, Washizu M, Nanba T (1989): Novel method of cell fusion in field constriction area in fluid integrated circuit. IEEE Trans Ind Applic 25:732–737.
Melamed MR, Lindmo T, Mendelsohn ML (1990): Flow Cytometry and Sorting, 2nd ed. New York: WileyLiss.
Merrill JT (1981): Evaluation of selected aerosol-control measures on flow sorters. Cytometry 1:342–345.
Lord Rayleigh (1879): On the capillary phenomena of jets. Proc R Soc Lond 29:71–97.
Rosenblatt JI, Hokanson JA, McLaughlin SR, Leary JF (1997): Theoretical basis for sampling statistics useful for detecting and isolating rare cells using flow cytometry and cell sorting. Cytometry 27:233–238.
Schmid I, Nicholson JA, Giorgi JV, Janossy G, Kunkl A, Lopez PA, Perfetto S, Seamer LC, Dean PN (1997): Biosafety guidelines for sorting unfixed cells. Cytometry 28:99–117.
Shapiro HM (1995): Practical Flow Cytometry, 3rd ed. New York: Wiley-Liss.
Sweet RR (1965): High frequency recording with electrostatically deflected ink jets. Rev Sci Instrum 36:131–136.
van den Engh G, Stokdijk W (1989): Parallel processing data acquisition system for multi-laser flow cytometry and cell sorting. Cytometry 10:282–293.
Vandilla MA, Dean PN, Laerum OD, Melamed MR (1985): Flow Cytometry Instrumentation and Data Analysis. New York: Academic Press.
Washizu M, Nanba T, Masuda S (1990): Handling biological cells using a fluid integrated circuit. IEEE Trans Ind Applic 26:352–358.
Watson J (1989): Flow cytometry chamber with 4 pi light collection suitable for epifluorescence microscopes. Cytometry 10:681–688.
Emerging Tools for Single-Cell Analysis: Advances in Optical Measurement Technologies
Edited by Gary Durack, J. Paul Robinson Copyright © 2000 Wiley-Liss, Inc.
ISBNs: 0-471-31575-3 (Hardback); 0-471-22484-7 (Electronic)
2
High-Speed Cell Sorting
Ger van den Engh
University of Washington, Seattle, Washington
In a cell sorter, cells are injected into a stream of liquid that intersects one or more laser beams. The light signals from the cells identify the different cell types. A vibration causes the stream to separate into discrete drops. An electrical charge is applied to those drops that contain cells of interest, so that these drops can be deflected in an electrical field. The aim is to classify and separate cells accurately, without errors, and as fast as possible.
Speed and precision often pose conflicting requirements. At a low speed, when cells arrive infrequently, it is relatively straightforward to analyze the fluorescence pulses and to charge the few drops that contain cells of interest. The cells dwell in the light spot sufficiently long that their intensities can be quantified accurately without interference from other fluorescent particles. Most drops are empty or contain a single cell and can be selected without ambiguity. However, slow speeds limit the sorter’s utility; many experiments require more cells than can be delivered in a single session. For maximum efficiency, we would like to inject as many cells as possible into the instrument, thereby creating conditions under which there is a significant chance of finding more than one cell in the illumination spot or in a deflected droplet. The following sections will show that the highest sorting speeds are reached when every drop, on average, contains a particle. Consequently, high-speed sorting involves more than simply increasing the speed of the instrument’s components. High-speed sorting refers to conditions under which all components of a cell sorter are operated
21

22 |
High-Speed Cell Sorting |
near their performance limits, at highest possible efficiency, without loss of yield or precision. High-throughput conditions present novel problems not encountered at slower rates. Unless adequate measures are taken, these complications can lead to impurities and recovery losses that will rapidly negate the advantages of the higher processing speeds of the sorter components.
The perfect cell sorter, one that satisfies all experiments, does not exist. Instruments can be built only to be good enough for specified conditions. We will consider an instrument satisfactory if it meets the following criteria. The measurement errors are small compared to the natural variation in our biological samples. Our ability to differentiate between different cell types is then limited by the quality of cell labeling, not by measurement error. The processing speed is determined by the speed at which we can move cells in and out of the illumination spot, not by the speed of our analysis circuits. Furthermore, the startup and shutdown of the instrument should not significantly add to the length of the experiment. The instrument should be easy to operate and provide clear information about the status of the experiment and the quality of its alignment. Experimental results should be well documented, readily stored, and easily retrieved and compared.
The specific problems that are associated with high processing rates lead to performance specifications for high-throughput, high-duty-cycle sorting. We will see that careful engineering can achieve acceptable compromises between precision and speed. Using current technology, sorters that are capable of reliably analyzing and sorting cells at rates of tens of thousands of cells per second are feasible. My group has designed and built several generations of high-speed sorters. These instruments have been used to sort 40,000 bone marrow cells per second with high purity (Sasaki et al., 1995). These instruments have proven their practical value in sorting chromosomes for the human gene library project of the Department of Energy (DOE) (Van Dilla et al., 1990). Some of this technology has been adopted by commercial manufacturers and is now commercially available. Cytomation’s MoFlo is based on the original DOE design. Systemix uses a modified version for the sorting of clinical bone marrow grafts (Sasaki et al., 1995). Cytopeia is preparing a versatile machine for general laboratory use that incorporates new features developed at the University of Washington. The following presents some of the considerations that went into the design of these machines.
DEFINITIONS
Before considering the technology behind high-speed sorting, some terms must be defined. In a sorting experiment, cells are introduced into the machine and processed. The sorted cell fraction is collected. An event is any object, be it a cell or a particle, that is registered by the instrument’s detectors and processed by its electronic circuitry. The processing rate denotes the number of events processed per unit time. The processing rate determines the overall speed. The more events processed per second, the more cells can be collected in a given time interval. Depending on our purpose, we may recognize two processing rates: (1) the peak rate, or the rate obtained once

Poisson Statistics |
23 |
the instrument is running, and (2) the effective rate, or the rate over the whole experiment, including instrument setup time and interruptions for nozzle clogs and realignment. There is often a large difference between these two rates. The engineer who designed the instrument is likely to specify the peak processing rate. The practical biologist is most concerned about the overall effective rate.
The yield of an experiment is the amount of material that the investigator takes back to the laboratory. The recovery compares the number of cells of a particular type that are collected to the number of these cells that went into the experiment. We may optimize for yield or recovery but can never optimize for both.
Instruments take a certain time to perform an operation. Tasks offered before the machine is finished are ignored or, worse, may corrupt the ongoing process. The time it takes to perform a task and to prepare the machine for the next operation is the cycle time. The dead time is the portion of the cycle time during which the machine cannot accept a new task because it is still busy with the previous one. For instance, if it takes a circuit 5 µs to analyze a 3–µs-wide pulse, the cycle time is 5 µs with a dead time of 2 µs. Events arriving within one cycle time of each other are said to be coincident. An instrument that is accepting new tasks as soon as a current task is done is said to work at full duty cycle. A 50% duty cycle means that an instrument is idle half of the time.
THE WELL-TEMPERED SORTER
Well-built sorters combine a high peak rate with reliability and versatility. In such a machine, the maximum processing speed depends on the properties of the biological sample, that is, cell size, cell fragility, and cell density. The instrument is self-stabi- lizing and easy to align. Setup time and downtime are relatively short, so that the effective sort rate does not differ much from the theoretical peak performance. The design of the instrument minimizes the chance of failure. Early warning signals indicate when the settings drift too close to the edges of their safe operating zones. Instrument malfunction is detected immediately and normal operation is interrupted automatically. Problems are easy to diagnose and are corrected rapidly. These are the characteristics of a robust design. In cell sorter development, robustness has received little attention. Only recently has the industry started to optimize performance from the perspective of reliability. Huge improvements in sorter design are still possible and are essential if this technology is to be used in clinical applications.
POISSON STATISTICS
Maximum analysis and sort rates are ultimately determined by the frequency of coincident events, either at the point of measurement or in the drops. Therefore, Poisson statistics stand central to the discussion of instrument efficiency. In the case of uncorrelated, stochastic events, Poisson calculates the probability of observing a specific number of events during an interval for which the average event probability is
24 |
High-Speed Cell Sorting |
known (Taylor, 1997). If the average number of events in the interval is ν, the probability of observing a particular number of µ events is
µν P (µ) = e–µ
ν ν!
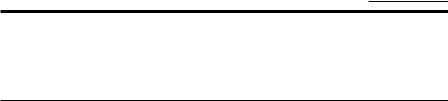
In our case, the interval of interest most often is a drop, and we need an estimate for the fraction of drops with ν cells, when the drops contain µ particles on average. Figures 2.1a and 2.1b show the probability distributions for intervals (drops) with zero and one events for different mean event rates. Figure 2.1c represents the total number of events that are contained in the intervals with two or more events. It should be noted that at low mean event rates (ν < 0.1) the relationships are simply linear. The largest fraction of intervals with one event (0.37) is observed for µ = 1. In other words, the largest fraction of single events is observed at a high duty cycle, when, on average, all observation intervals contain an event. It is also worth noting that under such conditions multiple events are observed in a substantial fraction of the intervals.
The utility of these graphs is illustrated by considering the distribution of particles (cells) among the drops that are formed by a cell sorter. A convenient unit of time is the period τ of the drop-generation oscillator, which is the inverse of the oscillator’s frequency, f = 1/τ. The expected mean number of cells per drop is µ = nτ = n/f, where n denotes the number of cells per second. In order to obtain pure cells, we deflect only the drops that contain one cell. If a coincident particle is present, the drop will not be sorted. As long as fewer than 1 in 10 drops contain a particle, coincident events are relatively infrequent (less than 10% of drops), and coincident-event rejection will not significantly affect the overall recovery or speed. As the average drop loading approaches one cell per drop, the picture becomes more complex. Figure 2.1a shows that the fraction of empty drops (P0) at an average occupancy of 1 is approximately 37%. The highest fraction of drops with one cell (Fig. 2.1b) is reached at an average of one cell per drop, where 37% contain one particle. The remaining fraction of drops, 1–P0–P1 (26%), must contain two or more particles. Figure 2.1c plots the fraction of cells that is lost if the drops containing two or more cells are not sorted, which is equal to the total number of events minus the number of single events as a fraction of the total event number, or
ν – P1 |
P1 |
= 1 – ν
At an average drop loading of one cell per drop, 63% of cells are lost due to coincidence.
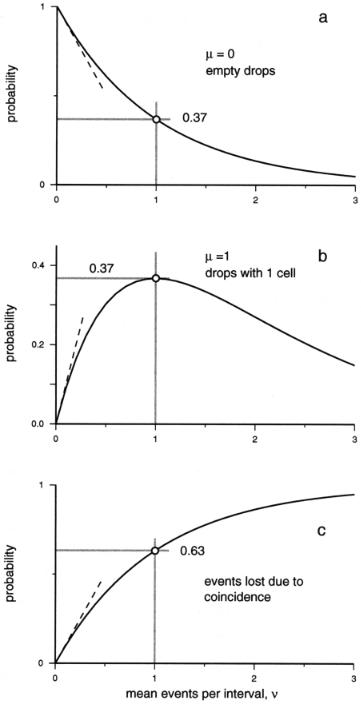
It is useful to consider sorting purity without coincident-event rejection. This arrangement may be advantageous when inspecting rare cells that are too valuable to dispose of in the unsorted fraction. Figure 2.2 plots the purity of the sorted sample if all drops with a wanted cell are deflected, regardless of whether the drops contain a coincident cell or not. Even at a high throughput rate, the purity is remarkably high. Up to an occupancy rate of 1.6 cells per drop, more than half of the cells in the sorted sample are of the desired type. When dealing with low-incidence cells, preenrichment by high-throughput sorting without coincidence rejection, followed by a second pass at a low sorting rate, may reduce cell loss and increase overall speed.
Poisson Statistics |
25 |
F i g . 2.1. Poisson statistics. The curves represent the probabilities of finding zero, one, or multiple events when the average number of events (ν) is known (see text).
26 |
High-Speed Cell Sorting |
F i g . 2.2. Purity of a cell fraction when all drops that contain wanted cells, including those with multiple cells, are selected.
The Poisson formulas accurately predict overall throughput rates and sort efficiencies only if the events are randomly distributed. The expected distribution of the time intervals between uncorrelated events with a mean event rate of µ events per second is given by
Ptime = µe–t/µ
By measuring the event interval distribution, we may determine whether the fluidic system delivers the cells truly randomly or whether the cells arrive in clumped packages (Visser and van den Engh, 1982). The expected interval distribution for random, uncorrelated events is shown in Figure 2.3. If measured intervals between events do not display a relationship as shown in Figure 2.3, Poisson statistics may not apply. In this case, the event spacing is not optimal, and the cell loss due to coincidence rejection will be larger than expected. A redesign of the sample introduction system may improve the event spacing.
MAXIMUM ANALYSIS RATE
Analysis precedes sorting; we cannot sort faster than we can analyze. The cells are measured when they traverse an illuminated spot. Figure 2.4 illustrates that a cell is