

- •Welcome to Seagate Crystal Reports
- •HANDS-ON (Report Design Environment)
- •HANDS-ON (Sections and Areas)
- •HANDS-ON (Report Creation and Design)
- •HANDS-ON (Finishing Your Report)
- •HANDS-ON (Exporting a Report)
- •HANDS-ON (Compiled Reports)
- •HANDS-ON (Viewing reports with a web browser)
- •Introduction
- •HANDS-ON (Reporting on OLAP data)
- •HANDS-ON (Multiple Section Reports)
- •HANDS-ON (Absolute Formatting)
- •HANDS-ON (Conditional Formatting)
- •HANDS-ON (Record and Group Selection)
- •HANDS-ON (Sorting, Grouping, and Totaling)
- •HANDS-ON (Formulas)
- •HANDS-ON (Running Totals)
- •HANDS-ON (Parameter Field Objects)
- •HANDS-ON (Charting)
- •HANDS-ON (Mapping)
- •HANDS-ON (OLE Objects)
- •HANDS-ON (Subreports)
- •HANDS-ON (Document Import Tool)
- •HANDS-ON (Cross-Tab Objects)
- •HANDS-ON (Queries)
- •HANDS-ON (Dictionaries)
- •HANDS-ON (Working With Databases)
- •North/South American Head Office
- •USA and Latin America
- •Asia/Pacific Offices
- •Europe/Middle East/Africa Offices
- •France – Southern European Head Office
- •Middle East Regional Office (ME & Northern Africa)
- •Glossary
●You can create a pick list for the user to choose the parameter value rather than enter it manually.
●In compiled reports, parameter fields can be used to prompt for record selection criteria for which you would not normally be prompted. In this way, the program allows you the opportunity to specify, in report selection formulas, values that contain only fields and operators. However, if you place a parameter field in your selection formula, the program will prompt you for its value - even if that value is not a field.
HANDS-ON (Parameter Field Objects)
This section includes Hands-On tutorials for performing a number of different tasks involving parameter fields. How to create a parameter field, Page 354, How to use a parameter field in a formula, Page 362, and How to respond to parameter field prompts, Page 362, are sequential; they provide an overview of typical processes involving parameter fields. The remaining tutorials can be read individually, as needed.
How to create a parameter field
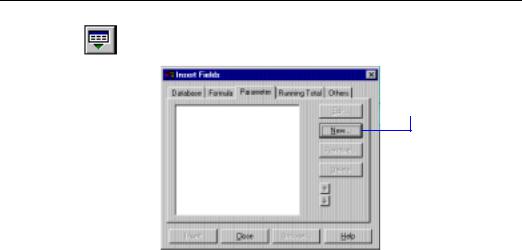
1Click the INSERT FIELDS button on the standard toolbar. The Insert Fields dialog box appears. Click the Parameter Tab to activate it.
2 Click New.
The Create Parameter Field dialog box appears.
354 |
Seagate Crystal Reports User’s Guide |

3Enter a name for the parameter field in the Name text box, for example Region, Country, Employee, etc. (up to 35 alphanumeric characters).
4Enter the desired prompting text in the Prompting Text text box (up to 255 alphanumeric characters). The prompting text is the text that appears when the program prompts you for a parameter value.
5Select the data type of the parameter field from the Value Type dropdown list.
NOTE: If you select Boolean, the dialog box changes. You can then choose the default value (True/False) from the Default Value drop-down list, and (optionally) use the Options section of the dialog box to place the parameter field in a group. Click OK to proceed. If, on the other hand, you select String, the Length Limit check box and the Edit Mask text box appear. If you select a Currency, Date, DateTime, Number, or Time data type, the Range Limited Field check box appears.
6Toggle the Allow multiple values check box on or off to designate whether the parameter field can accept multiple values.
7Click either the Discrete value(s) option or the Range value(s) option to specify whether the parameter field will accept a range of values.
●If you click Discrete value(s), the parameter field will accept single values (rather than ranges of values).
Parameter Fields |
355 |

●If you click Range value(s), then when you are prompted for parameter values, you can enter a start value and an end value, and the report will then display all records within that range. For example, if you enter the values "5" and "10", the range is 5-10, and the report will display all records with values between 5 and 10. This also works for string parameter fields. With a start value of "A" and an end value of "E", the report will display all records within an alphabetical range of A-E.
NOTE: If Allow multiple values is toggled on, and the Discrete value(s) option is selected, the parameter field will accept multiple single values. In this case, you can enter more than one value, but these values will be evaluated individually and will not be interpreted as a range. So you could enter "CA" and "WA" for a {?Region} parameter field, and the report would display all the records for the states of California and Washington. If
Allow multiple values is toggled on, and the Range value(s) option is selected, the parameter field will accept multiple ranges.
8If applicable, toggle the Length Limit check box on or off to designate whether the length of the parameter values must fall within a certain range. If you toggle Length Limit on, the Min Length and Max Length text boxes become active; use these text boxes to specify the mandatory range. These options are only available if you are creating a string parameter field.
9If applicable, toggle the Range Limited Field check box on or off to designate whether the parameter field is a range limited field. This check box is only available if you are creating a parameter field that does not have string values. If you toggle Range Limited Field on:
NOTE: Range Limited only appears in the professional edition.
●for a Currency or Number parameter field, the Min Value and Max Value text boxes appear;
●for a DateTime or Time parameter field, the Beginning and Ending text boxes appear;
●for a Date parameter field, the First Date and Last Date text boxes appear.
10To specify range limitations, use one of the following pairs of text boxes:
●Min Value/Max Value (currency/numeric): Enter the minimum and maximum values allowed.
●Min Length/Max Length (string): Enter the minimum and maximum number of alphanumeric characters allowed.
356 |
Seagate Crystal Reports User’s Guide |
●Beginning/Ending (DateTime/Time): Enter a time range in Time (hour, minute, second) format, or a DateTime range in DateTime (day, month, year/ hour, minute, second) format.
●First Date/Last Date (Date): Enter the earliest and latest dates allowed.
NOTE: For Date, Time, and DateTime fields, the dialog box provides a
DateTime Picker to help you enter these ranges quickly. The DateTime Picker consists of, where applicable, a text box with arrows for selecting a time, and a calendar for selecting a date (the calendar appears when you click the arrow button to the right of the date entry text box).
●The Browse Table drop-down list can be used to specify a default table.
●The Browse Field drop-down list can be used to specify a default field.
NOTE: If you specify range limitations after selecting a default table and default field, the Values to be added list will be modified so that only those values that are within the range appear on the list.
11For a string parameter field, you can choose to enter an Edit Mask in the Edit Mask text box, rather than specifying a range. The Edit Mask can be any of a set of masking characters used to restrict the values you can enter as parameter values (the edit mask also limits the values you can enter as default prompting values). You can enter any of the following masking characters, or any combination of them:
●“A” (allows an alphanumeric character and requires the entry of a character in the parameter value)
●“a” (allows an alphanumeric character and does not require the entry of a character in the parameter value)
●“0” (allows a digit [0 to 9] and requires the entry of a character in the parameter value)
●“9” (allows a digit or a space, and does not require the entry of a character in the parameter value)
●“#” (allows a digit, space, or plus/minus sign, and does not require the entry of a character in the parameter value)
●“L” (allows a letter [A to Z], and requires the entry of a character in the parameter value)
●“?” (allows a letter, and does not require the entry of a character in the parameter value)
●“&” (allows any character or space, and requires the entry of a character in the parameter value)
Parameter Fields |
357 |
●“C” (allows any character or space, and does not require the entry of a character in the parameter value)
●“. , : ; - /” (separator characters)
¾Inserting separator characters into an edit mask is something like hard coding the formatting for the parameter field. When the field is placed on the report, the separator character will appear in the field object frame, like this: LLLL/0000. This example depicts an edit mask that requires four letters followed by four numbers.
●“<“ (causes subsequent characters to be converted to lowercase)
●“>” (causes subsequent characters to be converted to uppercase)
●“\” (causes the subsequent character to be displayed as a literal. For example, the Edit Mask “\A” would display a parameter value of “A.” If the Edit Mask is “00\A00,” then a valid parameter value would consist of two digits, the letter “A,” and then two additional digits).
●“Password”
¾If you set the Edit Mask to “Password,” you can create conditional formulas specifying that certain sections of the report become visible only when certain user passwords are entered.
NOTE: Some of the Edit Mask characters require that you enter a character in their place (when entering a parameter value), while others allow you to leave a space, if needed. For example, if the Edit Mask is 000099, you can enter a parameter value with four digits, five digits, or six digits, since the ‘9’ Edit Mask character does not require the entry of a character. However, since ‘0’ does require such an entry, you could not enter a parameter value with less than four digits.
NOTE: When you enter an Edit Mask, the range text boxes become inactive.
12Enter the default prompting values by adding or selecting values from the "Select or enter value to add" list and using the Add (>) and Add All (>>) buttons to add these values to the Default Values list. You can use the Remove (<) and Remove All (<<) buttons to remove prompting values from the list. The program will populate a dropdown list on the Enter Parameter Values dialog box with the default prompting values you specify.
NOTE: If you selected Range Limited Field, the values you can enter in the prompting box are limited to that range.
13When you have more than one item in the Default values list box, the Allow Editing of default values check box appears. This check box is
358 |
Seagate Crystal Reports User’s Guide |
toggled on by default to specify that you can edit or enter new values when prompted for parameter values. Toggle this check box on or off as needed.
NOTE: This check box is inactive until you enter at least two default prompting values.
14Click OK. The parameter field is saved, and the parameter field name appears in the list on the Parameters Tab of the Insert Fields dialog box. Use the priority arrow buttons on the tab to determine the order in which the parameter fields appear when prompted for parameter values.
How to set record selection using parameter fields
You can easily use parameter fields for record selection. In this tutorial, you will create a parameter field that selects regions to be included in the report.
1To get started, create a report using the Customer table in xtreme.mdb. Place the following fields from left to right in the Details section:
{customer.CUSTOMER NAME} {customer.LAST YEAR’S SALES}
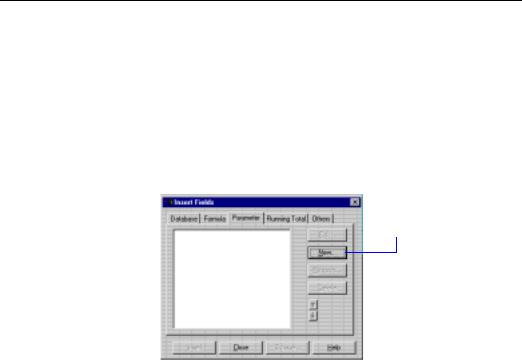
2With the Insert Fields dialog box still active, click the Parameter Tab.
3 Click New.
The Create Parameter Field dialog box appears.
Parameter Fields |
359 |

4Enter the following information into the corresponding edit boxes:
●Type “Region” in the Parameter Name text box.
●Type “Enter the region you would like to see sales for” in the
Prompting Text text box.
●Select String from the Value Type drop-down list.
●Select Customer from the Browse Table drop-down list.
●Select Region from the Browse Field drop-down list.
360 |
Seagate Crystal Reports User’s Guide |

●Either select “CA” as the sole default prompting value, or select a number of regions as the default prompting values by repeatedly clicking the Add (>) arrow button or by clicking the Add All (>>) button. If you select a number of regions, the user will be able to choose a value from a pick list of the values you supply. For details on selecting default prompting values, see How to create a parameter field, Page 354.
5You may also specify an edit mask restricting the type and number of characters that can enter as parameter values. For information about edit masking, see Step 11 and the table following that step in How to create a parameter field, Page 354.
6Click OK. You are returned to the Insert Fields dialog box. The parameter field you have just created now appears in the list box.
7Click the SELECT EXPERT button on the standard toolbar. The Choose Field dialog box appears.
8Select Region and click OK. The Select Expert appears.
NOTE: If a field is selected in the Design Tab, the Select Expert appears in place of the Choose Field dialog box. Click an empty section of the Design Tab to deselect all fields and repeat Step #5.
9Leave the first drop-down list set to is. Choose equal to from the second drop-down list. A third drop-down list appears.
10Click the arrow on the drop-down list to display the list of regions. The prompting variable that you created, {?Region}, now appears at the top of the list.
11Select the prompting variable from the list and click OK.
Now, when you refresh your data, the program will prompt you for the parameter values and will base record selection on the values you provide. See How to create a record or group selection formula, Page 240.
NOTE: If you base record selection on a parameter field that accepts range values (a parameter field for which the Range Value(s) option is selected in the Create Parameter Field dialog box), you could create a selection formula like {Orders.Orders Date} in {?pDateRange}, where {?pDateRange} is a parameter field that allows range values. Then you can enter a range value when prompted, and the report will display all records in which {Orders.Orders Date} falls within that range.
Parameter Fields |
361 |

How to use a parameter field in a formula
1Click the Insert Fields button on the standard toolbar the insert field dialog box appears.
2In the Insert Fields dialog box, click the Formula Tab to activate it.
3Click the NEW button. Type a name for the formula in the Formula Name dialog box.
4Click OK when finished. The Formula Editor appears.
5Create a formula using the parameter field as you would any constant value. For example, rather than creating a formula that hard-codes the region name:
{customer.REGION} = “CA”
Use a parameter field instead of “CA”:
{customer.REGION} = {?[Name of Parameter Field]}
6Click the SAVE AND CLOSE button. The program returns you to the Insert Fields dialog box. The name of the formula you have just created is highlighted in the Formula list box.
7Click the INSERT button and place the formula where you want it to appear in the report.
8Click CLOSE to exit the Insert Fields dialog box.
9To see how this field works, click either the PRINT PREVIEW button or the REFRESH button on the standard toolbar.
A dialog box appears, prompting you for values. See How to respond to parameter field prompts, Page 362.
NOTE: The program automatically puts a question mark before the field name to identify it as a parameter field. See Introduction to Formulas, Page 291.
How to respond to parameter field prompts
Previewing a report for the first time
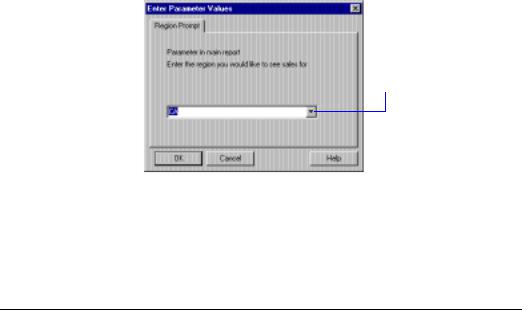
When you preview a report for the first time, the Enter Parameter Values for Main Report dialog box appears, prompting you for a value.
●If you specified a default value when you created the parameter field, the program will use that value unless you specify a new one.
362 |
Seagate Crystal Reports User’s Guide |

Refreshing report data
●If you did not specify a default value, then the program will not refresh the data until you supply a new value.
When you refresh data from the Preview Tab, the Refresh Report Data dialog box appears.
●Click Use current parameter values to use the current parameter value.
●Click Prompt for new parameter values to enter a new parameter value. If you click this option and click OK, the Enter Parameter Values dialog box appears.
¾Enter String values exactly as they will appear in the field. If the parameter field allows multiple values, you can enter additional parameter values using the ADD button.
¾Enter Boolean values using the following format: TRUE or FALSE.
¾Enter Number values exactly as they will appear in the field.
¾Enter Currency values exactly as they will appear in the field.
¾Enter Date values using the following format: Date (Year/ Month/Day). For example, Date (1997/5/21). You can also enter Date values in the format used for the Windows short date settings (which are specified on the Date Tab of the Regional Settings dialog box, in the Control Panel). To use the Date Picker to enter Date values, activate the Date Picker by toggling the Pick from defaults check box off. The Date Picker appears in place of the list when you click the drop-down list arrow.
¾Enter Time values using the following format: Time (Hour: Minutes: Seconds AM/PM). For example, Time (04:32:12 AM). You can also enter Time values in the Windows time style (which is specified on the Time Tab of the Regional Settings dialog box, in the Control Panel). To use the Time Picker to enter Time values, activate the Time Picker by toggling the
Parameter Fields |
363 |
Pick from defaults check box off. The Time Picker appears to the right of the drop-down list.
¾Enter DateTime values using the following format: Date (Year/ Month/Day), Time (Hour: Minutes: Seconds AM/PM). For example, Date (1997, 5, 21), Time (04:32:12 AM). You can also enter DateTime values in the format used for the Windows time style and short date settings (which are specified on the Time Tab and the Date Tab of the Regional Settings dialog box, in the Control Panel). To use the DateTime Picker to enter DateTime values, activate the DateTime Picker by toggling the Pick from defaults check box off. The time picker appears to the right of the drop-down list. The date picker appears in place of the list when you click the drop-down list arrow.
NOTE: The Date/Time/DateTime Picker is only available if you have the correct version of comctl32.dll (there is a separate install program for this on Seagate Crystal Reports installation disk).
To use a value other than the default, select a new value from this drop-down list or, if permitted, enter a new value in the text box.
 To use the default value, simply click OK.
NOTE: If the parameter field is range limited, then you can only enter values within a certain range.
The program now runs the report using the new value(s) you specified.
How to conditionally format using parameter fields
Parameter fields can be used to create conditional formatting formulas. You can customize these formulas whenever you refresh the report data. A conditional formatting formula could be used for color-flagging data that meets certain conditions. For example:
364 |
Seagate Crystal Reports User’s Guide |

●sales representatives who sell more than 10% over quota,
●customers who have not ordered in the last quarter, and
●inventory items that have not had any movement in the last month.
If the conditions under which you flag these items never change, you do not need to use parameter fields. You can just use formulas (for text flags) or conditional formatting (for border flags). However, to change the conditions from report to report, you need to use parameter fields in formulas and conditional formatting formulas.
1Create the parameter field in the data type you need for the formula.
2Create the formula and use the parameter field in place of the fixed value you would normally use.
3For example, to be prompted for all the customers whose last year’s sales were over a certain value and to print their names in red, then select the Last Year’s Sales field and click the OBJECT PROPERTIES button on the supplementary toolbar. The Format Editor appears.
4Click the Conditional formula button next to the Color property on the Font Tab, and format the field using a conditional formatting formula like this:
If {customer.LAST YEAR’S SALES} > {?ParameterFieldName} Then
Red
Else
Black
Now, when you refresh the data, the program will prompt you for the value that triggers the color flag (known as the threshold value). It then runs the report and flags all the customers that had sales last year above the threshold figure. You can change the figure each time you run the report and the program will flag a different set of Customer Names.
Related Topics
How to create If-Then-Else formulas, Page 316
Conditional attribute properties, Page 213
Conditional formatting, Page 212
How to format objects conditionally, Page 204
Parameter Fields |
365 |

How to create a report title using parameter fields
Seagate Crystal Reports allows you to use parameter fields to create a
Report Title that can be changed each time the report is refreshed.
1From the Insert Fields dialog box, click the Parameter Tab to activate it.
2Click the NEW button. The Create Parameter Field dialog box appears.
3Type a name for the parameter field in the Name edit box. Type in any prompting text you wish in the Prompting Text edit box. Select String in the Value Type drop-down box.
4To specify a default title, type the desired text into the Select or enter value to add text box and click the ADD (>) button to add the title to the Default Values list box.
NOTE: Repeat Step 4, as needed, to enter more than one default title. In this case, the program will prompt you with a list of default titles when you run the report.
5Click OK when finished. You are returned to the Insert Fields dialog box. The parameter field you created appears in the list.
6Select the parameter field and click the INSERT button.
7Place the parameter field in the Page Header section of the report to have the title appear on every page, or in the Report Header section if you want the title to appear on only the first page of the report.
Now, when you refresh the data, the program will prompt you for a report title. If you wish, you can change the title each time you run the report.
How to set sort order using parameter fields
To set the sort order using parameter fields, you need to first create a formula that includes a parameter field and then sort based on that formula. For example, assume that you have a customer list report based on the Customer table. For each customer, you show the Customer Name, City, Region, Country, and Phone Number. You want to be able to sort the report by Country, by Region, or by City, depending on your needs at the time.
1Create a parameter field and name it SortField. See How to create a parameter field, Page 354.
2In the Prompting Text edit box, enter a prompt similar to this:
366 |
Seagate Crystal Reports User’s Guide |
Type R to sort by Region or C to sort by City; otherwise, data will be sorted by Country.
3Select String from the Value Type drop-down list.
4You may want to limit the number of characters the user can type to one. To do this, toggle the Length Limit check box on, and type the numeral 1 into the Max Length text box. Now the parameter field will only accept single-character values. The field will accept "C" as a value, but not "City."
5Create a formula similar to this and call it Sort:
If {?SortField} = “C” Then {customer.CITY}
Else
If {?SortField} = “R” Then {customer.REGION}
Else
{customer.COUNTRY}
«This formula prompts for a value for the parameter field {?SortField}. If you enter “C”, the formula will sort by the City field. If you enter “R” it will sort by the Region field. If you enter anything else, or do not enter anything at all, the formula will sort by the Country field. See How to create multi-condition If-Then-Else formulas, Page 317.»
6Place the formula in the Report Header section of the report and toggle its Suppress option on in the Section Expert so that it does not print. Search for Section Expert in Seagate Crystal Reports online Help.
7Click the SORT RECORDS button on the standard toolbar. Choose your formula, @Sort, as your sort field. See How to do a single field sort, Page 253.
Now when you run the report, the program will prompt you for a sort field, the formula will return a value based on your selection, and the sort facility will use that value as your sort field.
Parameter Fields |
367 |
368 |
Seagate Crystal Reports User’s Guide |

17 Charting
What you will find in this chapter...
Charting Overview, Page 370
Where to place a chart, Page 373
Data you can chart on, Page 374
Before you create a chart, Page 374
HANDS-ON (Charting), Page 375
Charting |
369 |
Charting Overview
Seagate Crystal Reports enables you to include sophisticated, colorful charts in your reports. You can use charts any time you want to improve the usefulness of a report. For example, you can use charts to show 1996 fiscal results or the sales within the fiscal quarters.
Choosing a chart type
Chart layouts
Seagate Crystal Reports provides 12 chart types to make data visually accessible in reports. These include common chart types like the Bar and Pie charts, as well as 3-D Surface, XY Scatter, Radar, Bubble, and Stock charts. There is also a custom chart option and multiple templates for each chart type.
The Chart Expert provides four powerful layouts. Each layout is especially useful for charting on certain sets of data. Charts can be created with any of the following layouts:
1.Group
The Group layout is a very simplified layout in which you show a summary on change of a geographic field (such as Region). In order to create a chart using the Group layout, you must have at least one group and at least one summary field in the report.
370 |
Seagate Crystal Reports User’s Guide |
|
2. |
Detail |
|
|
The Detail layout is more complex than the Group layout. Use the |
|
|
Detail layout when using multiple chart values, rather than only one, |
|
|
or when you do not have any groups or summaries in a report. You |
|
|
can use multiple dimensions in detail charts, a function that allows |
|
|
you to create a 3D group. Other specifics functions with the Detail |
|
|
layout include: |
|
|
● charts based on a cross-tab can perform a summary function on |
|
|
one cell, and |
|
|
● values can be grouped in ascending, descending or specified |
|
|
order. |
|
3. |
Cross-Tab |
|
|
Use the Cross-Tab layout to chart a cross-tab object. The cross-tab |
|
|
information can be used as the basis for this chart. A Cross-Tab chart |
|
|
does not require groups or summary fields. |
|
4. |
OLAP |
|
|
Use the OLAP layout to chart on an OLAP grid. The OLAP data can |
|
|
be used as the basis for this chart. An OLAP chart does not require |
|
|
groups or summary fields. |
|
NOTE: The following rules apply when changing the layout of an existing |
|
|
chart: |
|
|
1. A chart (or a map) based on a group layout can be changed to detail |
|
|
|
layout, and vice versa. |
|
2. A chart (or a map) based on a cross-tab object can be changed to |
|
|
|
detail or group layout only (i.e., not to an OLAP cube), the same is |
|
|
NOT true in the reverse order. |
|
3. A chart (or a map) based on an OLAP cube can be changed to detail |
|
|
|
or group layout only; the same is NOT true in the reverse order. |
Chart types |
Different sets of data are particularly suited to a certain chart type. The |
|
|
following is an overview of the main chart types and their most common |
|
|
uses. |
|
● Bar chart
A Bar chart (also known as a Column chart) is an excellent tool for displaying or comparing several sets of data. Two very useful bar charts include the:
¾ Side-by-Side bar chart
A Side-by-Side bar chart displays data as a series of vertical bars. This type of chart is best suited for showing data for several sets over a period of time (for example, last year’s sales figures for CA, AZ, OR, and WA).
Charting |
371 |
¾Stacked bar chart
A Stacked bar chart displays data as a series of vertical bars. This type of chart is best suited for representing three series of data, each series represented by a color stacked in a single bar (for example, sales for 1994, 1995, and 1996).
●Line
A Line chart displays data as a series of points connected by a line. This type of chart is best suited for showing data for a large number of groups (for example, total sales over the past several years).
●Area
An Area chart displays data as areas filled with color or patterns. This type of chart is best suited for showing data for a limited number of groups (for example, percentage of total sales for CA, AZ, OR, and WA).
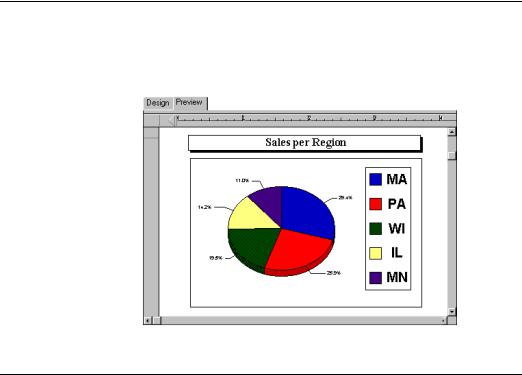
●Pie
A Pie chart displays data as a pie, split and filled with color or patterns. Pie charts are typically used for one group of data (for example, the percentage of sales for the entire inventory); however, you now have the option to choose multiple pie charts for multiple groups of data.
●Doughnut
A Doughnut chart is similar to a pie chart, displaying data as sections of a circle or doughnut. If, for example, you charted sales by region on a particular report, you would see the total number of sales (the figure) in the center of the doughnut and the regions as colored sections of the doughnut. As with the Pie chart, you have the option to choose multiple doughnut charts for multiple groups of data.
●3-D Riser
A 3-D Riser chart displays data in a series of 3-dimensional objects, lined up side-by-side, in a 3-dimensional plane. The 3-D Riser chart does an excellent job of showing the extremes in your report data. For example, the difference in sales between countries is visually dynamic when presented in this chart.
●3-D Surface
3-D Surface charts present a topographic view of multiple sets of data. If, for example, you need a chart to show the number of sales by customer by country, in a visually dynamic and relational format, you might consider using the 3-D Surface chart.
372 |
Seagate Crystal Reports User’s Guide |

●XY Scatter
An XY Scatter chart is essentially a collective of plotted points that represent specific data in a pool of information. The XY Scatter chart allows the user to consider a larger scope of data for the purpose of determining trends. For example, if you input customer information, including sales, products, countries, months, and years, you would have a collective of plotted points that represents the pool of customer information. Viewing all of this data on an XY Scatter chart would allow you to speculate as to why certain products were selling better than others or why certain regions where purchasing more than others.
●Radar
A Radar chart positions group data, such as countries or customers, at the perimeter of the radar. The Radar chart then places numeric values, increasing in value, from the center of the radar to the perimeter. In this way, the user can determine, at a glance, how specific group data relates to the whole of the group data.
●Bubble
A Bubble chart displays data as a series of bubbles, where the size of the bubble is proportional to the amount of the data. A Bubble chart would be very effective with the number of products sold in a certain region; the larger the bubble, the greater the number of products sold in that region.
●Stock
A Stock chart presents high and low values for data. With this ability, the Stock chart is an excellent tool for monitoring financial or sales activities.
NOTE: The Chart Expert also includes 3-D templates for Bar, Area, and
Pie charts.
Where to place a chart
The placement of a chart determines which data is displayed and where it is printed. For example, if you place a chart in the Report Header section, the chart includes data for the entire report. If you place it in a Group Header or Group Footer section, it displays group specific data.
NOTE: If your report contains subreports, you can place charts in those subreports as well. See Subreports, Page 415.
Charting |
373 |

Drill-down with charts
Not only is a chart a powerful way of presenting data, it is also a powerful analysis tool. When you move your mouse pointer over a segment of the chart in the Preview Tab the cursor becomes a Drill-down cursor. You can double-click to view the details supporting that section of the chart.
Analyzer Tab
Seagate Crystal Reports provides a third tab (besides the Design and Preview Tabs) specifically for advanced charting and mapping. This is the Analyzer Tab. Use this tab to organize your charts for more efficient analysis. The Analyzer Tab allows you to set the properties of an individual instance of a chart independently of the rest of the report. You can change the chart title and the titles for the X-, Y-, and Z-axes. You can also stagger labels, reverse a series or a group, and change colors. For more information, see Analyzer Tab, Page 65.
Data you can chart on
You can chart on the following:
●summary and subtotal fields (see How to chart on a summary or subtotal field (group charts), Page 375),
●detail fields (see How to chart on a details field, Page 376),
●formula fields (see How to chart on a formula field, Page 377),
●cross-tab summaries (see How to chart on cross-tab summaries, Page 379), and
●OLAP data (see How to chart on an OLAP cube, Page 379).
Before you create a chart
You will typically chart at the group level on summary and subtotal information; exceptions include the Detail, Cross-Tab, and OLAP grid charts. Before you can create a chart at the group level, you must have at least one group and at least one summary or subtotal in your report.
For example, if you have a sales report grouped by Region with a subtotal of Last Year’s Sales for each Region, you can quickly create a chart that will display sales by Region.
374 |
Seagate Crystal Reports User’s Guide |