


NOTE: You also have the option to click the Conditional Formula button to enter a formula in the Format Formula Editor. In the Format Formula Editor you can specifying that field clipping will be disabled only when certain conditions are met.
4 Click OK.
To view the results, refresh the report. If you disabled field clipping, any numeric/currency field values that are larger than the fields containing them will be represented by number signs (######).
HANDS-ON (Sections and Areas)
How to add, delete, move, and merge sections
The Design Tab opens originally with a standard set of report sections, each in a standard size (see Design Tab Areas, Page 57). You can not delete any of these original sections but you can add to them. Once you have added sections, you can delete them, move them in relation to other similar sections, or merge related sections together.
While there are different ways to do this, the easiest way is to use the
SECTION EXPERT button.
1Click the SECTION EXPERT button on the Standard toolbar. The Section Expert appears with a list of all the sections in the report. When there are more than one of any kind of section, the sections are lettered A, B, C, and so on.
Getting to Know Seagate Crystal Reports |
79 |
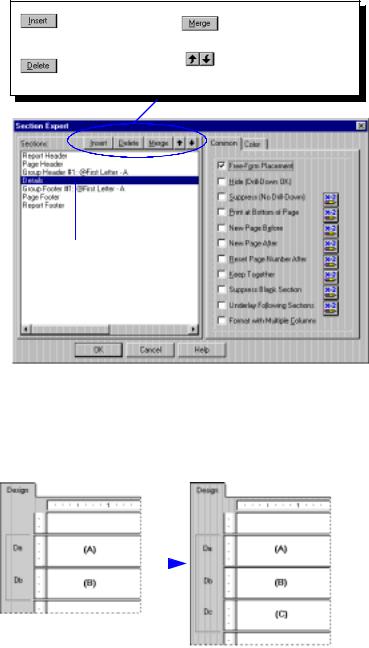
Inserting a section
Click Insert to insert a new section.
Click Delete to delete an existing section.
Click Merge to merge two sections.
Click the arrow buttons to move a section up or down in an area.
2 Highlight the section you want to work with from this list.
Click the Insert button. The program adds a new section immediately below the highlighted section.
NOTE: Sections can also be inserted by right-clicking the shaded area to the left of any section in the Design or Preview Tabs and choosing INSERT SECTION BELOW command from the shortcut menu.
80 |
|
|
Seagate Crystal Reports User’s Guide |
Deleting a |
Click the Delete button. The program removes the highlighted section |
|
section |
from the report. |
|
Moving a section |
1 |
Highlight the section you want to move. |
|
2 |
Click the Up or Down arrow to move the section. |
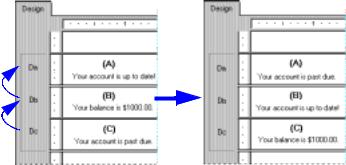
Merging two related sections
3 With Section (C) highlighted, |
The data originally in Section (C) is |
click the up arrow twice. |
moved to Section (A). The data in |
|
the other sections is moved down. |
NOTE: You can only move a section up or down within an area.
NOTE: The letters that identify the sections describe their relative (as opposed to original) position. Thus, if you move a “C” section up, it becomes a “B” section. It loses its original “C” designation.
There may be times when you have placed objects in two sections (where they print sequentially) and you want to put them all in a single section (where they print simultaneously). You can merge the two sections and then rearrange the objects as needed in the new section.
1Move the sections so the two sections you want to merge follow each other in the list.
2Highlight the top section.
Getting to Know Seagate Crystal Reports |
81 |

.
3 With Section (B) highlighted, click the Merge button. Section (C) is merged with Section (B) into one.
4 Rearrange the objects as needed.
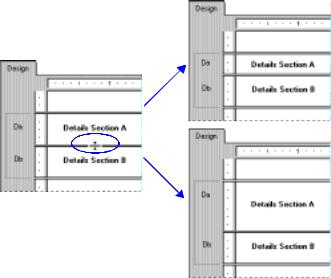
How to split and resize sections
A section can be split into two or more sections and/or resized easily in the Design Tab.
Splitting a |
1 |
Move the pointer over the left boundary of the section you want to |
|||
section |
|
split. |
|||
|
2 |
When the pointer becomes a Section Splitting cursor, click the |
|||
|
|
boundary. See Cursors, Page 54. |
|||
|
3 |
When a horizontal line appears, drag it up or down to split the |
|||
|
|
section the way you want it. |
|||
|
|
|
|
|
|
4 When the Section Splitting cursor appears, drag the horizontal line to the desired position.
The section will split at the line.
82 |
Seagate Crystal Reports User’s Guide |
Resizing a section
Move the pointer over the bottom boundary of the section you want to resize and, when the pointer becomes a Resizing cursor, drag the boundary to make the section bigger or smaller as you wish.
If you have one or more objects in a section and you want to resize the section to remove unnecessary white space, right-click in the shaded area to the left of the section in the Design and Preview Tabs and choose FIT SECTION from the shortcut menu. The program automatically resizes the section, moving the bottom boundary of the section to the baseline of the bottom object in the section.
Drag the Resizing cursor up to make the section above smaller.
Drag the Resizing cursor down to make the section above bigger.
A section will automatically expand vertically in two instances:
1.when you place an object and the object is bigger (vertically) than the section you put it in, or
2.when you expand an object (vertically) so it becomes bigger than the section it resides in.
NOTE: You can not resize a section smaller than an object in the section.
Getting to Know Seagate Crystal Reports |
83 |
84 |
Seagate Crystal Reports User’s Guide |

5 |
Introduction to Reporting |
What you will find in this chapter...
Basic report design, Page 86
How to design a paper prototype, Page 93 Concepts in reporting, Page 93
Beyond basic reports, Page 100
HANDS-ON (Report Creation and Design), Page 101 HANDS-ON (Finishing Your Report), Page 117
Introduction to Reporting |
85 |

Basic report design
Deciding on the content of the report
The purpose of this chapter is to suggest a structured approach to preparing reports with Seagate Crystal Reports. This approach includes the following elements:
●deciding on the content of a report,
●developing a prototype on paper,
●using Seagate Crystal Reports to set up a prototype,
●specifying the records/groups to be included in the report,
●manipulating the data with formulas and functions,
●grouping, summarizing, and sorting the data,
●editing and formatting the data,
●adding graphic enhancements and OLE objects, and
●printing the finished report.
This section has been designed to provide a conceptual understanding of the reporting process.
Before you do anything else, you should outline the information you want the report to provide. Use the following list of questions as a guide in making that outline:
●What is the overall purpose of the report?
●Who is going to read the report?
●What is the report title going to be?
●What information do you need besides the title to identify the report?
¾Where is that information to come from?
¾If the information exists in a database table, what type of fields is the data stored in: number, text, etc.?
●What identifying information do you want to appear at the bottom of each page? At the top of each page?
¾Where will this information come from?
¾If the information exists in a database table, what type of fields is the data stored in: number, text, etc.?
86 |
Seagate Crystal Reports User’s Guide |
●What specific data should appear in the body of the report?
¾Where will this data come from?
¾Does this data exist in data fields, or does it need to be calculated from data field values?
¾What type of fields is the data stored in: number, text, etc.?
¾Do you want the data sorted?
¾How?
¾Do you want the data broken into groups?
¾What kind of groups?
¾Do you want the data summarized?
¾Subtotaled? Averaged? Counted? or some other kind of summary value?
¾What do you want to total?
¾Do you want to show summaries for all the groups or just the top or bottom groups?
¾Do you want the group summaries sorted in any special order?
¾Do you want to add text labels to the summaries?
●What information, if any, do you want flagged on the report?
¾How do you want it flagged?
¾By color?
¾By a text flag?
●Do you want any other information highlighted in some way so that it really stands out?
¾How do you want it highlighted?
¾Colored text?
¾Special font or font size?
¾Borders or background color?
¾Do you want to label the highlighted information as well?
●Do you want the report to be based on all records in the database or only on specific records?
¾Which records?
Introduction to Reporting |
87 |
Purpose |
What is the overall purpose of the report? |
|
Reports are management tools. Their purpose is to help individuals |
|
quickly grasp the essential elements and relationships found in raw data, |
|
to help them make effective decisions. For a report to be effective, it has |
|
to present the correct data in a logical way. If it presents the wrong data, |
|
or if it presents the right data in a haphazard manner, the report may slow |
|
the decision making process or may even encourage incorrect decisions. |
|
A good starting place in the development of a report is to write out the |
|
purpose of the report in a sentence or two. The purpose statement helps |
|
you focus on your primary needs, and it gives the report both a starting |
|
point and a goal. Here are some examples of purpose statements: |
|
● The purpose of this report is to show monthly and year-to-date |
|
sales by sales representative, compare this year's numbers to last |
|
year’s, and flag representatives whose sales figures do not meet |
|
company standards. |
|
● The purpose of this report is to show sales activity for each item in |
|
inventory, and to suggest reorder quantities based on that activity. |
|
● The purpose of this report is to calculate bowling averages and |
|
handicaps for each member of the bowling league. |
|
Clarifying the purpose of the report before you start is a critical step in the |
|
overall process. A report without a clear purpose is like a meeting |
|
without a clear agenda; it rambles and accomplishes little. |
Readers |
Who is going to read the report? |
|
A single report is often used by many individuals. A detailed, company- |
|
wide sales report, for example, may be used by sales representatives, the |
|
regional sales manager, the national sales manager, and the Chief |
|
Operating Officer (COO). |
|
Each of these individuals will be interested in different aspects of the |
|
report. |
|
● A sales representative will use the report to evaluate individual |
|
sales performance and compare this performance to that of other |
|
representatives in the region. |
|
● The regional sales manager will use the report to evaluate regional |
|
representatives and compare the region's performance to that of |
|
other regions. |
|
● The national sales manager will use the report to evaluate the |
|
performance of regional managers and compare overall sales to |
|
the current sales forecasts. |
88 |
Seagate Crystal Reports User’s Guide |
Title
Do you know the data you want to use in the report?
Header information
Header information sources
●The COO will use the report to evaluate the performance of the Vice President of Marketing and the sales department as a whole, and to project such things as manufacturing needs, warehouse locations, etc.
Since each user of the report has different interests, it is important to plan the report so it includes the information each of the users is looking for.
What is the report title going to be?
Write out a working title for the report. You may decide to change it later, but at least you will have a title to use when creating the prototype report.
Do you know the type of database you are reporting from? Will you be reporting off a data file, SQL/ODBC, or a dictionary?
If you do not know, ask an internal source for the database type and location of the data and to set you up with access to that database if necessary. See Data Sources, Page 579.
Are you familiar enough with the data to find the necessary information? When looking for a Customer Contact name, can the field be found in a database table?
If not, your MIS professional, database administrator, or co-workers will have to help you become familiar with the data.
What information do you need besides the title to identify the report?
You may wish to include the current date, information on who prepared the report, a block of text to describe the purpose of the report, the range of data covered, or something similar. If you are going to include such information, write it down so you can use it in preparing your prototype.
Where will the header information come from?
The information can come from a variety of sources, depending on the kind of information you plan to use.
●The current date can be inserted using the PRINT DATE FIELD command on the Insert|Special Field Menu.
●Information on who prepared the report might be drawn from individual data fields in the database table(s) used. If it is to be drawn from a database table, what table? Or, what combination of tables?
●A block of text can be created as a text object and placed anywhere on the report.
As you begin to think of where the information is to come from, you begin formally structuring the report.
Introduction to Reporting |
89 |
Data types in the header
Footer information
Footer data sources
Data types in the footer
Report body data
Body data sources
Existing or calculated?
If the information exists in a database, what types of fields contain the data: number, text, etc.?
Seagate Crystal Reports uses different rules for working with different types of data. You will find it helpful later if you note the data type of each piece of data you plan to draw from a database.
What identifying information do you want to appear at the bottom of each page (page number, page n of N, report name, author's name, the word “Confidential”)?
Where will the footer information come from?
As with Report Header data, the information for a Report Footer can come from a variety of sources, depending on the kind of information you plan to use.
If the footer information exists in a database table, what type of fields is the data stored in: number, text, etc.?
What specific data should appear in the body of the report?
When you think of a report, it is probably the body of the report that first comes to mind. The body should contain all the data needed to fulfill the statement of purpose you wrote for the report. It should also contain all of the data needed by the various users that you have identified.
Where will the report body data come from?
This step requires you to look at the available database table(s). Seagate Crystal Reports allows you to combine data from different databases when you create reports, so you have a great deal of flexibility in your work.
●Much of the data in a typical report is taken directly from data fields. Which data fields will be used, and where are they located?
●Other data will be calculated based on data fields. Which data fields will be used in the calculations?
●Still other data will be placed directly into the report using text objects (headings, notes, labels, etc.).
Does the data exist in data fields or does it need to be calculated from data field values?
Some report information can be drawn directly from data fields (sales information, for example); other information will have to be calculated based on data field values (for example, sales commission, based on the
90 |
Seagate Crystal Reports User’s Guide |
Data types in the body
Record or group selection
Groups
Group values
Group value positions
Grand totals, subtotals, averages, etc.
Flags
relationship of sales to quota). In your planning, it can be helpful to segregate or flag data that needs to be calculated from that which can be used directly. See Introduction to Formulas, Page 291.
What types of fields contain the data: number, text, etc.?
While it is important to understand data types for all the data you will be using, it is of critical importance that you know the data type for data fields that will be used in calculations. Functions and operators work with specific kinds of data, so it's important to know the data type to know which functions and operators you can use in your calculations. Search for Functions Index and Operators Index, or for the function or operator by name in Seagate Crystal Reports online Help.
Do you want the report to be based on all records or groups in the database or only on specific records or groups?
Seagate Crystal Reports gives you the opportunity to base a report on all records in a given database, or on a limited set of records from the database. Seagate Crystal Reports can be used to select records based on simple date ranges or comparisons, or to create complex formulas to identify the records to be included. Take a few minutes to determine the records needed for the report and list the criteria to be used for selecting those records. See Record and Group Selection, Page 227.
Do you want the data organized into groups? How? By customer? By date? Or by other criteria? Seagate Crystal Reports provides several options for grouping data in a report. See How to group data, Page 258.
Do you want to show a subtotal at the end of each group? A count? An average? Seagate Crystal Reports allows you to specify several kinds of group values. See How to summarize grouped data, Page 262, and How to subtotal grouped data, Page 264.
Where should the group values appear? With the group data? With the group data, but on a page separate from other groups? Only at the bottom of the page?
Seagate Crystal Reports provides all of these options.
Do you want to total, average, count, or determine the maximum or minimum value included in all the values in any column on the report?
Seagate Crystal Reports allows you to do this and also allows the grand total (or the grand total average, grand total count, etc.) to be placed at the bottom of the selected column.
What information, if any, should be flagged on the report?
Introduction to Reporting |
91 |
Flag options
Highlights
Sorting
Developing a prototype on paper
You may want to call attention to some data by flagging it on the report. For example, non-moving inventory items are often flagged on inventory reports so they can be given special attention. You might want to flag each item that has shown no activity during the last month, during the last three months, or during some other defined period. So, to flag information, identify it and any conditions that will trigger the flagging.
How do you want it flagged?
You may want to flag items with an asterisk or some other symbol, or you may want a word to appear as a flag. In any case, you should write out flagging instructions so they are handy.
What information do you want highlighted in some way that makes it really stand out?
Seagate Crystal Reports gives you the opportunity to underline report elements, and change the font type, size, or color used for specific report items. It allows you to put borders around items and to draw lines and boxes (to break the report into sections), set off headings, etc. All of these formatting tools can be used to highlight key data on a report. If you have data that you want highlighted, you should write down highlighting instructions so they are handy too. See Formatting, Page 209.
Do you want the data sorted based on record or group values?
Seagate Crystal Reports gives you both alternatives. See Sorting, Grouping, and Totaling, Page 245.
Graphic designers generally begin working on a magazine cover, brochure, or display advertisement with a rough pencil sketch. They often use boxes, circles, or other symbols to represent the graphic elements they intend to include in the final product, and they often use lines or scribbles to represent text. Doing the rough design on paper helps them create a look for each page. It helps them find a balanced way of positioning the various elements before they begin working with sophisticated graphics tools. You will find a similar exercise helpful in designing reports. See How to design a paper prototype, Page 93.
While a paper prototype is useful regardless of your level of expertise with Seagate Crystal Reports, it is particularly valuable when you are first learning the program. With the paper prototype in hand, you can put your full effort into learning and using the commands, rather than into trying to design and learn at the same time.
92 |
Seagate Crystal Reports User’s Guide |

How to design a paper prototype
1Get paper of the size you will be using for the finished report.
2Position the title and other descriptive header information, using boxes or lines to represent report elements.
3Position the footer information.
4Review the page layout for balance.
5Look at the information you intend to include in the body of the report.
¾Count the number of fields being used and estimate the appropriate spacing between fields.
¾Use rectangles to pencil in the fields within the estimated spacing.
¾Change the spacing if you need to.
¾Decide on a logical sequence for presenting the data in the body of the report.
¾Label the fields to indicate that sequence.
6Use small boxes to indicate group values and totals.
7Place random flags in the column where you want flags to appear.
8Darken any elements you want highlighted to make them stand out from the rest of the prototype.
9Review the finished product for layout and balance, and make changes as needed.
Concepts in reporting
The purpose of this section is to give you a conceptual understanding of the tasks necessary to create a fairly standard report. Each topic is discussed in relation to the Tutorial; please refer to Tutorial - Customer List, Page 147, throughout for an illustration of these concepts.
The concepts are presented in the order you might use to create such a report and directions to sources of additional information will be provided.
Introduction to Reporting |
93 |
Report creation options
Each time you create a new report, you have four options:
1.use a Report Expert,
2.use another report as a template,
3.import a pre-existing report from another application, or
4.create a Custom Report from scratch.
You will probably use all the options at some time.
REPORT EXPERTS
The Report Experts help create reports as quickly as possible and many new users and developers alike prefer to create the majority of their reports using them. All you have to do is choose the Expert that most closely matches your report type. The Expert walks you through the process of creating reports step-by-step.
You can quickly create the report and see how it looks against the actual data. And best of all, if you then decide to make changes, you can get back to the Report Expert to further modify the report. Search for Experts Index in Seagate Crystal Reports online Help.
ANOTHER REPORT
To build a new report based on one that already exists, another report can be used as a template. The program makes a duplicate of the original report, which can be modified to create a new report. Use this option whenever you think templates can save time. Templates are useful to:
●create a new report with a different grouping or different record selection than that of an existing report,
●create a series of reports, each a little different than the last,
●reconstruct a report based on an earlier time period using the same report structure used today, or
●create an entirely new report based on a set of databases that are linked in another report. You can create a report and delete the fields without disturbing the underlying links. Then, without relinking, you can build all your new reports based on this report.
IMPORTED REPORT
With Seagate Crystal Reports, you now have the option of importing an ASCII text report and converting the text report into a Seagate Crystal Report. For example, you could import and convert a report created and saved as a text (.txt) file. You could then use Seagate Crystal Reports’ improved data manipulation and report generation capabilities to enhance the converted report. The importing process requires that the
94 |
Seagate Crystal Reports User’s Guide |
Selecting the report data
original report be saved as an ASCII text file. For more information, see
Document Import Tool, Page 433.
CUSTOM REPORT
The Custom option is used to create a report from scratch. This is useful when you want the full flexibility and control of building a report from the ground up, or when a report type is different from the many report types available in the Experts.
The Custom option was chosen for the Tutorial - Customer List, Page 147, because the process of creating a report from scratch most fully illustrates the basics of reporting.
The next step in creating a report is to select the data to use in the report. This is a two step process. The first step is to determine what type of data you want to work with and the second step is to actually select the data. See How to select data and begin creating a report, Page 101.
Seagate Crystal Reports provides four different data types:
1.data file,
2.SQL/ODBC,
3.dictionaries, and
4.queries.
DATA FILE
Choose the Data File option to report on any of the standard (not clientserver) PC databases. These are typically databases whose data and all software used to access that data are on a single machine. Seagate Crystal Reports can access many of the most common PC database formats directly; the program has built-in capabilities to directly open database files and tables designed in dBASE, FoxPro, Clipper, Btrieve, Paradox, and Microsoft Access, among others. Once the program is installed on your system, you can immediately begin creating reports based on these databases simply by selecting the appropriate file. See Data Sources, Page 579.
The Data File option was chosen for the Tutorial - Customer List, Page 147, because the sample data, xtreme.mdb, is a Microsoft Access database.
SQL/ODBC
Choose the SQL/ODBC option to use SQL or ODBC data sources.
●Structured Query Language (SQL) databases are perhaps the most popular and most powerful database formats. They usually work over a client/server network architecture and use:
Introduction to Reporting |
95 |
¾an SQL server to create, store, and manipulate database files, tables, fields, and records, and
¾an SQL client interface, allowing workstation users to retrieve data.
See Using SQL and SQL databases, Page 535.
●Open Database Connectivity (ODBC) is a standard developed by Microsoft through which many different types of data can be accessed by a single application. An application need only communicate with one set of files, ODBC, to instantly be able to work with any source of data that can be accessed by ODBC. For more information, see ODBC data sources, Page 601.
Seagate Crystal Reports provides direct drivers for many of the most popular SQL systems, and ODBC capabilities as well.
DICTIONARIES
In many large organizations, data is stored in a variety of places. It may be in different databases, on different servers, and so forth. IS departments often use naming schemes for tables and fields that are logical and predictable, but the names assigned may seem cryptic to nontechnical staff. Enabling staff to create reports themselves in such an environment can create extensive training and support problems and possibly compromise data integrity. Dictionaries provide a solution to these problems. They allow you to provide your staff with ready access to the data in a form that they can understand, but they also allow you to maintain complete control and security over your data resources.
A dictionary is a structured, simplified, and secure view of organizational data that you can create for some or all of the users in your organization.
A dictionary is an optional metalayer that you can place between the user and the data. Using the capabilities of the metalayer you can:
●design a single, dynamic view of all the data that is necessary to create organizational reports and queries,
●include multiple data sources, tables, and links,
●organize the data and rename tables and fields to make it easier for users to understand the content and purpose of the data,
●limit access to specific columns of data (for example, letting only executives see the salary column of the employee data files),
●place restriction formulas on specific rows of data (for example, allowing managers to view employee information only for those employees with a salary under $40,000), and
96 |
Seagate Crystal Reports User’s Guide |
●create complex data manipulation formulas that users can access without the need to understand formula concepts.
Dictionaries reduce support cost and time, increase user productivity, and enable you to add an additional layer of security between the user and the data.
NOTE: When a dictionary is used to create a report the only data used in the report is data accessed through the dictionary. You can not use a dictionary and some other data source in the same report. Because the dictionary is often used to impose data security, it would breach that security to allow unrestricted data access in a dictionary report.
NOTE: A subreport based on a different data source can be included in a primary report based on a dictionary.
NOTE: Dictionaries are an optional metalayer. Seagate Crystal Reports can be used without ever using dictionaries. See Dictionaries, Page 487.
QUERIES
A query is a request for specific information from a database. If you are requesting that information from an SQL database (or from a database that you access via ODBC), the query must be written using the Structured Query Language (SQL). The SQL language is not difficult to learn, but mastering the fine points of creating and retrieving data using SQL can take quite a while. Since the SQL Designer eliminates the need to understand SQL, it can get you building effective queries right away.
The SQL Designer has been designed to meet the needs of individuals with little or no query background as well as the needs of experienced SQL professionals.
●If you are new to querying, you will enjoy the way the SQL Designer helps create queries, even if you have no knowledge of SQL whatsoever. By answering a few questions on a set of sequential tabs, you give the program all the information to generate a query that fits your needs.
●If you are an SQL professional, you will appreciate the facility that enables you to fine-tune the queries that the SQL Designer generates. If you are more comfortable writing your own SQL queries, you will find it easy to enter your queries directly or even paste them in from another source.
The SQL Designer can be a powerful tool for many of your information gathering needs.
NOTE: The SQL Designer can only access data stored in an ODBC data source.
Introduction to Reporting |
97 |
Linking
Placing data on the report
If the report contains data from two or more database tables, they need to be linked at this point when creating reports. Database tables are linked so records from one database match related records from another. For example, if you activate a Suppliers table and a Product table, the databases are linked so that each product (from the Product table) can be matched up with the supplier (from the Supplier table) that made the product.
The majority of reports will probably require data from two or more tables, so linking will be necessary. The process of linking is made easy with the Visual Linking Expert. See How to add and link multiple tables, Page 104, and search for Visual Linking Topics Index in Seagate Crystal Reports online Help.
NOTE: It isn’t necessary to link tables in reports created from a query because any links required by the data have already been processed.
Placing data on a report is a very important task. You need to know what type of data should be placed on the report and where on the report it should be placed.
DATABASE FIELDS
Much of the data placed on a report are database fields, displaying data as it is stored in the database. For example, in Tutorial - Customer List, Page 147, the Customer Name, City and Country fields are placed on the report. Normally, database fields will be placed in the Detail section, but under certain circumstances, they will be placed in other sections of the report. See How to insert database fields, Page 105.
TEXT OBJECTS
Text objects are used in reports for a multitude of purposes. They are a powerful way of inserting titles; labeling summaries and other data on your report; and of easily combining database fields. For example, in the Tutorial - Customer List, Page 147, text objects are used to easily display the two contact name database fields as one object, to insert a column heading for the concatenated contact name, and to insert a title in your report. For more information, see How to insert text objects, Page 108.
SPECIAL FIELDS
To display information such as Page Numbers, Print Date, and Report Comments use the commands on the Insert|Special Field Menu. See How to insert special fields, Page 106, and search for Special Field commands in
Seagate Crystal Reports online Help.
98 |
Seagate Crystal Reports User’s Guide |
FORMULA FIELDS
To display data that is a calculated value, you need to create a formula field and place that formula field on the report. For example, if the database only stores the order dates and ship dates for orders but you need to display the number of days it takes to ship the order, you must create a formula field that will calculate the number of days between ordering and shipping. This is just one example of the use of formula fields. See Introduction to Formulas, Page 291, for an introduction to formulas.
RUNNING TOTAL FIELDS
To display a total that evaluates each record and provides a running sum of all the values in a field (or all the values in a certain set of values), a running total field needs to be created and placed in the report. If the first three values in a field were 2, 4, and 6, a running total would print 2, and then 6 (the sum of 2 + 4), and then 12 (the sum of 2 + 4 + 6). See Running Totals, Page 341, for an introduction to running totals.
SQL EXPRESSION FIELDS
Formatting data
Record selection
SQL expressions are like formulas, but they are written in Structured Query Language (SQL), not in the Seagate Crystal Reports formula language. An SQL expression can be used to query the database for specific sets of data. You can sort, group, and select based on SQL expression fields. See The Crystal SQL Designer, Page 465, for an introduction to SQL expressions.
At this point in creating a report, you may want to do some basic formatting. Perhaps you would like to change the font size and style of a text object used as a title. Or, if you have a number field, such as a sales figure, you might want to place a dollar sign before the number or change the number of decimal places displayed.
For example, in the Tutorial - Customer List, Page 147, you format the title, add a text object to identify the Contact Name information, and insert the company logo. See Formatting, Page 209.
Record selection, the task of paring down the data to include only the data required for your report, is a crucial step in report creation. You will rarely want a listing of all the information in a database. Most often you will be interested in only the sales in a given time period or for a certain product, etc. For example, a sales report may be designed to only include sales from one product line for the last calendar month.
The sample data used for the Tutorial - Customer List, Page 147, has information from both United States and international customers. Record selection is used to create a report listing only customers in the United States. See Record and Group Selection, Page 227.
Introduction to Reporting |
99 |

Grouping, sorting, and summarizing data
Once a basic report is created, you will want to organize the data by grouping related information, sorting individual records, summarizing, subtotaling, and grand totaling.
GROUPING RECORDS
To organize the data, you may want to group related data together. For example, in the Tutorial - Customer List, Page 147, after grouping the Customer List by region, you will divide the list into regional groups. That way, a sales manager for the California region could quickly locate the California group and focus exclusively on the customers within that region. See How to group data, Page 258.
SORTING RECORDS
Seagate Crystal Reports allows you to specify the order in which you want the records on your report displayed. For example, after grouping in the Tutorial - Customer List, Page 147, you sort the records within each region in alphabetic order by Customer Name. Many of your reports will use some type of sorting. Depending on the report, you will sort the records in a list or sort in conjunction with grouping. See How to do a single field sort, Page 253, and How to sort records within groups, Page 260.
SUMMARIES, SUBTOTALS, AND GRAND TOTALS
Many reports use some sort of totaling. For example, in a North American sales report grouped by state, you might want to calculate the total dollar amount sold in each state. You do this by creating a subtotal on the sales field. Summaries are also used at the group level, allowing you to calculate averages, counts, and other group (aggregate) values. For example, in a sales report you may want to calculate an average of sales per state (average summary on the sales field) and calculate the number of products sold in the state (distinct count of the product name field).
Beyond basic reports
Once you are comfortable with the basics of reporting, you will be ready to investigate the more powerful reporting features of Seagate Crystal Reports, including:
●charts (see Charting, Page 369),
●OLE objects (see OLE, Page 403),
●form letters (see How to create a form letter using a text object, Page 200),
●subreports (see Subreports, Page 415),
100 |
Seagate Crystal Reports User’s Guide |