

- •Welcome to Seagate Crystal Reports
- •HANDS-ON (Report Design Environment)
- •HANDS-ON (Sections and Areas)
- •HANDS-ON (Report Creation and Design)
- •HANDS-ON (Finishing Your Report)
- •HANDS-ON (Exporting a Report)
- •HANDS-ON (Compiled Reports)
- •HANDS-ON (Viewing reports with a web browser)
- •Introduction
- •HANDS-ON (Reporting on OLAP data)
- •HANDS-ON (Multiple Section Reports)
- •HANDS-ON (Absolute Formatting)
- •HANDS-ON (Conditional Formatting)
- •HANDS-ON (Record and Group Selection)
- •HANDS-ON (Sorting, Grouping, and Totaling)
- •HANDS-ON (Formulas)
- •HANDS-ON (Running Totals)
- •HANDS-ON (Parameter Field Objects)
- •HANDS-ON (Charting)
- •HANDS-ON (Mapping)
- •HANDS-ON (OLE Objects)
- •HANDS-ON (Subreports)
- •HANDS-ON (Document Import Tool)
- •HANDS-ON (Cross-Tab Objects)
- •HANDS-ON (Queries)
- •HANDS-ON (Dictionaries)
- •HANDS-ON (Working With Databases)
- •North/South American Head Office
- •USA and Latin America
- •Asia/Pacific Offices
- •Europe/Middle East/Africa Offices
- •France – Southern European Head Office
- •Middle East Regional Office (ME & Northern Africa)
- •Glossary

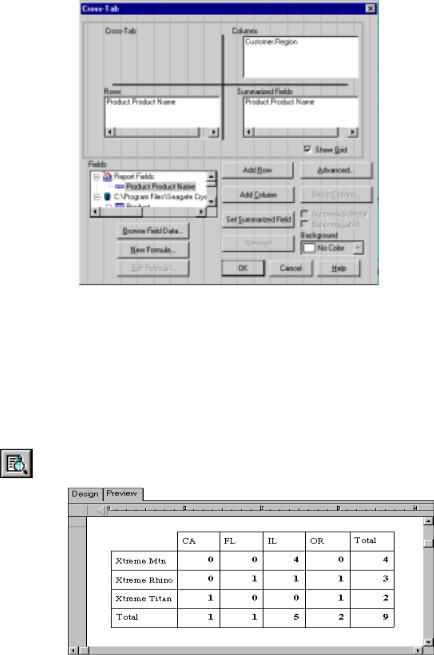
●At the intersection of the Totals column (totals for the products) and the Totals row (totals for the countries) is a grand total. In the example above, the value at the intersection of the Total Column and Total Row is 12, the total number of all products sold in all countries.
HANDS-ON (Cross-Tab Objects)
How to create a cross-tab object
In this tutorial you will create a simple Product by Region count cross-tab using xtreme.mdb (located in the \CRW16 directory (16-bit), \Program Files\Seagate Software\Crystal Reports directory (32-bit), or the directory in which the program resides).
The Xtreme database contains several tables. For this example use the following tables:
●Customer,
●Orders,
●Orders Detail, and
●Product.
NOTE: Using the Ctrl-click combination allows you to pick a noncontinuous range of fields. You can use the Shift-click combination to pick several fields from the list that are continuous.
NOTE: Make certain that the Customer table is linked to the Product table via the Orders and Orders Detail tables for this example. Search for Visual Linking Topics Index in Seagate Crystal Reports online Help for assistance.
The Customer and Product tables contain records for a variety of products and sales regions. To keep the report a manageable size, you will create a cross-tab that shows only a subset of those products and regions. You will restrict the report to Xtreme Mtn, Xtreme Rhino, and Xtreme Titan locks sold in California, Florida, Illinois, and Oregon. To do this, you will limit the number of regions and products by using record selection tools.
NOTE: For this example place the following fields in the Details section:
●Customer Name and Region (From the Customer table)
●Product Name (From the Product table)
450 |
Seagate Crystal Reports User’s Guide |
Selecting regions
Selecting products
Adding rows
Adding columns
Adding summarized fields
The Select Expert makes it easy to specify the records you want included in a report. Simply highlight the field you want to base your selection on and then select the desired records. See Record and Group Selection, Page 227.
1Highlight the Region field of the Customer Table, and use the Select Expert to select the following records:
●CA
●FL
●IL
●OR
2Highlight the Region field of the Customer Table and, use the Select Expert to select the following records:
●Xtreme Mtn Lock,
●Xtreme Rhino Lock, and
●Xtreme Titan Lock.
Now you are ready to create a cross-tab.
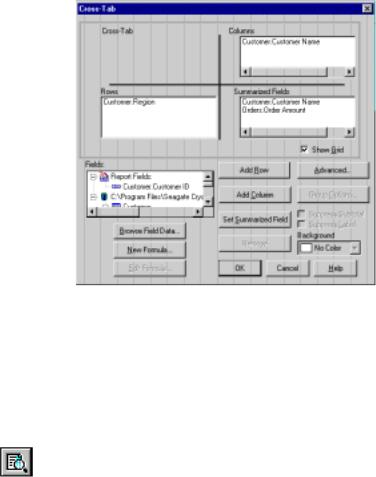
3Click the INSERT CROSS-TAB button on the supplementary toolbar. The Cross-Tab dialog box appears. Use this dialog box to add the rows, columns, and summary fields that will make up the cross-tab.
4From the Fields list box, select the {product.PRODUCT NAME} field listed under the Report Fields heading and click Add Row. The highlighted field are added to the Rows list box.
5From the Fields list box, select the {customer.REGION} field found listed under the Report Fields heading and click Add Column. The highlighted field is added to the Columns list box.
6From the Fields list box, select the {product.PRODUCT NAME} field listed under the Report Fields heading, and click Set Summarized Field. The field is added to the Summarized Fields list.
NOTE: You can also drag fields from the Database Fields section of the
Fields list box to the Rows, Columns, and Summarized Fields list boxes using the drag-and-drop feature.
The dialog box should look similar to the following:
Cross-Tab Objects |
451 |
7Click OK. A placement frame appears. Place the cross-tab in the Report Header section of the report.
NOTE: Placing the cross-tab in different sections of a report produces different results. For example, cross-tabs placed in the Report Header will contain data for the entire report and will print only once at the beginning of the report, while cross-tabs placed in a Group Header will contain data for that group only, and will print every time the group changes. See Design Tab Areas, Page 57, and Area printing characteristics, Page 59.
8Click the PRINT PREVIEW button on the standard toolbar to preview the cross-tab. It should look similar to the following:
452 |
Seagate Crystal Reports User’s Guide |

NOTE: Rows and columns of a cross-tab can be independently formatted with background colors, shading, borders, and fonts to emphasize important data and create professional-looking reports. See How to format a cross-tab, Page 460.
How to create a cross-tab with multiple rows/columns
You may want to create reports that contain multiple levels of information. For example, if you have a report that contains the sales data for a single product sold to all customers in the USA, you can break it down further into a region by region analysis. Seagate Crystal Reports enables you to create cross-tabs with multiple rows and/or columns to accommodate multiple levels of information such as these.
In this tutorial you will create a cross-tab with multiple rows (number of Products sold by Country and Region) using xtreme.mdb (located in the \CRW16 directory (16-bit), \Program Files\Seagate Software\Crystal Reports directory (32-bit), or the directory in which the program resides).
The Xtreme database contains several tables. For this example you will use the following tables:
●Customer,
●Orders,
●Orders Detail, and
●Products.
NOTE: Make certain that the Customer table is linked to the Product table via the Orders and Orders Detail tables for this example. For more information on linking tables, search for Visual Linking Topics Index in
Seagate Crystal Reports online Help.
The Customer, Orders, Orders Detail, and Products tables contain records for a variety of products, countries, and sales regions. To keep the report a manageable size, create a cross-tab that shows a subset of the products, regions, and countries included in the sample data. Restrict the report to the: Extreme Adult, Triumph Pro, and Triumph Vertigo helmets sold in the USA in California and Oregon only. To do this, limit the number of products, regions, and countries using record selection tools.
NOTE: For this example place the following fields in the Detail section:
●Customer Name, Region, and Country (From the Customer table)
●Quantity (From the Orders Detail table)
●Product Name (From the Product table)
Cross-Tab Objects |
453 |
Selecting countries
Selecting regions
Selecting products
Adding multiple rows
Adding the column
The Select Expert makes it easy to specify the records you want included in your report. Simply highlight the field you want to base your selection on and then select the desired records. For more information on record selection, see Record and Group Selection, Page 227.
1Highlight the Country field of the Customer Table and use the Select Expert to select the record for USA.
2Highlight the Region field of the Customer Table and use the Select Expert to select the following records:
●CA, and
●OR.
3Highlight the Product Name field of the Product Table and use the Select Expert to select the following records:
●Xtreme Adult Helmet,
●Triumph Pro Helmet, and
●Triumph Vertigo Helmet.
Now you are ready to create a cross-tab.
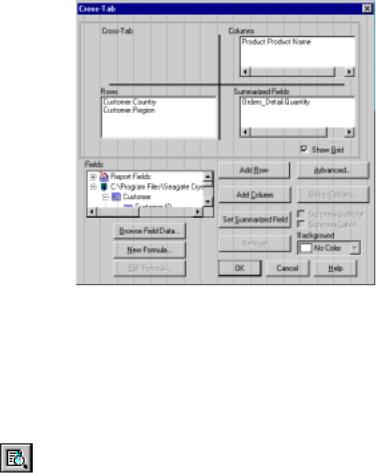
4Click the INSERT CROSS-TAB button on the supplementary toolbar. The Cross-Tab dialog box appears. Use this dialog box to add the rows, columns, and summary fields that will make up the cross-tab.
5In the Fields list box, highlight the {customer.COUNTRY} and click the ADD ROW button. The highlighted field is added to the Rows list box.
6Repeat Step 5, to add the {customer.REGION} to the Rows list box as well.
NOTE: The order in which rows, columns, and summary fields are added affects their placement in the cross-tab. The first row or column added will remain outermost in the cross-tab. Consecutive rows will be added inside (to the right of the first column and below the first row). Consecutive summary fields will be added below the first summary field. For more information on multiple summary fields, see How to create a cross-tab with multiple summary fields, Page 456.
7In the Fields list box again, highlight {product.PRODUCT NAME} and click the ADD COLUMN button. The highlighted field is added to the Columns list box.
454 |
Seagate Crystal Reports User’s Guide |
Adding the summarized field
NOTE: To create a cross-tab with multiple columns, simply add the desired columns to the Columns list box by repeating Step 7.
8In the Fields list box again, highlight {orders detail.QUANTITY} and click the SET SUMMARIZED FIELD button. The highlighted field is added to the Summarized Fields list box.
The dialog box should look similar to the following:
9Click OK. A placement frame appears. Place the cross-tab in the Report Header section of the report.
NOTE: Placing the cross-tab in different sections of a report produces different results. For example, cross-tabs placed in the Report Header will contain data for the entire report and will print only once, at the beginning of the report, while cross-tabs placed in a Group Header will contain data for that group only, and will print every time the group changes. For more information see Design Tab Areas, Page 57, and Area printing characteristics, Page 59.
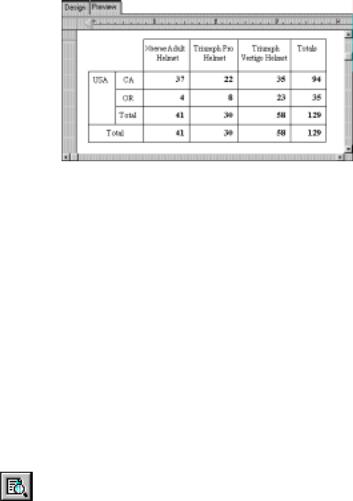
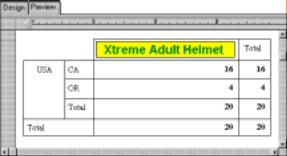
10Click the PRINT PREVIEW button on the standard toolbar to preview the cross-tab. It should look similar to the following:
Cross-Tab Objects |
455 |

NOTE: Rows and columns of a cross-tab can be independently formatted with background colors, shading, borders, and fonts to emphasize important data and create professional-looking reports. See How to format a cross-tab, Page 460.
How to create a cross-tab with multiple summary fields
You will often find it useful to include multiple summaries in a report. For example, you may have a report that shows the total number of orders for each of your California and Oregon customers. You might then want to see the average dollar amount of each customer's order as a means of comparing their purchasing habits. To accommodate situations such as these, Seagate Crystal Reports allows you to create cross-tabs with multiple summary fields.
In this tutorial you will create a cross-tab with multiple summary fields (total and average orders for each Customer, by Region) using xtreme.mdb (located in the \CRW16 directory (16-bit), \Program Files\Seagate Software\Crystal Reports directory (32-bit), or the directory in which the program resides).
The Xtreme database contains several tables. For this example you will use the following tables:
●Customer, and
●Orders.
NOTE: The Customer table must be linked to the Orders table for this tutorial. For more information on linking tables, search for Visual Linking Topics Index in Seagate Crystal Reports online Help.
456 |
Seagate Crystal Reports User’s Guide |
Selecting regions
Selecting customers
Adding rows
Adding columns
Adding multiple summary fields
The Customer and Orders tables contain records for a variety of customers, regions, and orders. To keep the report a manageable size, you will create a cross-tab that shows a subset of the customers and regions included in the sample data. You will restrict the report to Sporting Wheels Inc. and Whistler Rentals in California and Oregon only. To do this, you will use record selection tools to limit the number of customers and regions.
NOTE: For this example place the following fields in the Detail section:
●Customer Name and Region (From the Customer table)
●Order Amount (From the Orders table)
The Select Expert makes it easy to specify the records you want included in a report. Simply highlight the field you want to base the selection on and then select the desired records. For more information on record selection, see Record and Group Selection, Page 227.
1Select the Region field of the Customer Table and use the Select Expert to select the record for CA.
2Highlight the Customer Name field of the Customer Table and, using the Select Expert, select the following records:
●Sporting Wheels Inc., and
●Whistler Rentals.
Now you are ready to create the cross-tab.
3Click the INSERT CROSS-TAB button on the supplementary toolbar. The Cross-Tab dialog box appears. Use this dialog box to add the rows, columns, and summary fields that will make up the cross-tab.
4From the Fields list box, highlight {customer.REGION} and click the ADD ROW button. The highlighted field is added to the Rows list box.
5From the Fields list box again, highlight the {customer.CUSTOMER NAME} field and click the ADD COLUMN button. The highlighted field is added to the Columns list box.
6From the Fields list box again, highlight {customer.CUSTOMER NAME} and click the SET SUMMARIZED FIELD button. The highlighted field is added to the Summarized Fields list box.
7Repeat Step 6 and add the {orders.ORDER AMOUNT} to the
Summarized Fields list box as well.
NOTE: The order in which rows, columns, and summary fields are added affects their placement in the cross-tab. The first row or column added
Cross-Tab Objects |
457 |
will remain outermost in the cross-tab. Consecutive rows will be added inside (to the right of the first row and below the first column). Consecutive summary fields will be added below the first summary field.
The dialog box should look similar to the following:
8Click OK. A placement frame appears. Place the cross-tab in the Report Header section of the report.
NOTE: Placing the cross-tab in different sections of a report produces different results. For example, cross-tabs placed in the Report Header will contain data for the entire report and will print only once at the beginning of the report while cross-tabs placed in a Group Header will contain data for that group only and will print every time the group changes. For more information, see Design Tab Areas, Page 57, and Area printing characteristics, Page 59.
9Click the PRINT PREVIEW button on the standard toolbar to preview the cross-tab. It should look similar to the following:
458 |
Seagate Crystal Reports User’s Guide |
Changing the summary operation (aggregate function)
The first summary operation on the cross-tab is the count of orders for each of the three customers. The second summary operation is the sum of all the orders made by each company. For this example, you want to calculate the average order amount for each customer. To do this you will need to change the summary operation for the {sum of orders.ORDER AMOUNT} field.
NOTE: If the first summary operation is not a count, follow the directions below to change the summary operation to count.
10In the Design tab, right-click the summary field that you want to change {sum of orders.ORDER AMOUNT}, and choose CHANGE SUMMARY OPERATION from the shortcut menu. The Change Summary Operation dialog box appears.
11Select the desired function from the Summary Operation drop-down list and then click OK. For this example, select average. The summary operation will be changed as specified.
For more information on summary functions, search for Summary Functions Index in Seagate Crystal Reports online Help.
12Click the PRINT PREVIEW button on the standard toolbar again to preview the cross-tab. It should now look similar to the following:
Cross-Tab Objects |
459 |
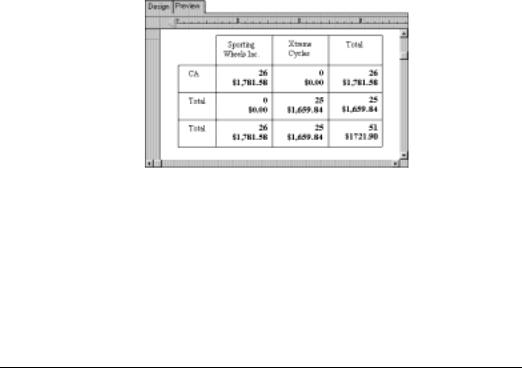
The first summary operation in the cross-tab is the count of orders for each of the three customers and now the second summary operation is the average order amount for each customer.
By creating cross-tabs with multiple summary fields such as these, you can pinpoint customer information and easily identify purchasing trends.
NOTE: Rows and columns of cross-tabs can be independently formatted with background colors, shading, borders, and fonts to emphasize important data and create professional-looking reports. See How to format a cross-tab, Page 460.
How to format a cross-tab
Seagate Crystal Reports has powerful formatting capabilities that can be applied to cross-tabs. You can:
●change the width and height of cross-tab cells,
●format the background color of an entire row/column at once,
●format the background of Grand Totals,
●format fields individually,
●format several fields at once,
●suppress empty rows, columns, or totals, and
●print cross-tabs that span multiple pages, with the option of repeating the row headings.
By applying such formatting as background color, borders, and fonts, you can emphasize important data and create professional-looking and easy-to-understand cross-tabs. You can also use the Highlighting feature to add conditional formats to numbers and currencies. For more information, see How to Use the Highlighting Expert, Page 224.
460 |
Seagate Crystal Reports User’s Guide |
Changing width and height of cross-tab cells
Formatting background color of entire rows/columns
Formatting background of Grand Totals
1In the Design Tab, click a Row or Column heading, or a cell of summarized data, to activate the sizing handles.
2Click and drag one of the sizing handles to expand the width or height of the cross-tab cell.
3Click the Preview Tab to view the changes.
NOTE: Changing one row or column heading affects all of the rows or columns. Changing one cell of summarized data effects all of the cells of summarized data.
1Right-click the blank top-left area of the cross-tab and choose FORMAT CROSS-TAB from the shortcut menu. The Cross-Tab dialog box appears.
2Highlight the row (from the Rows list box) or column (from the Columns list box) for which you want a background color, and select a color from the Background Color drop-down list.
3Click OK to return to the cross-tab. The row/column will be formatted as specified.
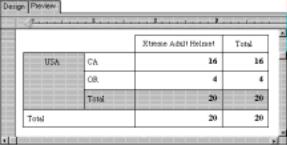
A cross-tab with a single row highlighted looks similar to the following:
NOTE: To apply background colors for grand total rows and columns, select the desired colors from the Background drop-down lists on the Advanced Cross-Tab Options dialog box. Search for Advanced Cross-Tab Options dialog box in Seagate Crystal Reports online Help.
NOTE: You can also apply separate background colors to Row and Column totals.
1Right-click the blank top-left area of the cross-tab and choose FORMAT CROSS-TAB from the shortcut menu. The Cross-Tab dialog box appears.
Cross-Tab Objects |
461 |
|
2 |
Highlight the Grand Total row (from the Rows list box) or Grand |
|
|
Total column (from the Columns list box) for which you want a |
|
|
background color, and select a color from the Background Color drop- |
|
|
down list. |
|
3 |
Click OK to return to the cross-tab. The Grand Total row/column |
|
|
will be formatted as specified. |
Formatting fields |
1 |
Right-click the field you want formatted and choose FORMAT FIELD |
individually |
|
from the shortcut menu. The Format Editor appears. |
|
2 |
In the Format Editor, make font, background, borders, numbering, |
|
|
currency symbols, and printing characteristics choices. |
|
3 |
Click OK to return to the cross-tab. The field will be formatted as |
|
|
specified. |
A cross-tab with a single field formatted looks similar to the following:
Formatting |
1 |
Use the Shift-click method to select the desired fields. |
several fields at |
2 |
Right-click any of one and choose FORMAT OBJECTS from the shortcut |
one time |
|
menu. The Format Editor appears. |
|
3 |
In the Format Editor, make font, background, borders, numbering, |
|
|
currency symbols, and printing characteristics choices. |
|
4 |
Click OK to return to the cross-tab. The fields will be formatted as |
|
|
specified. |
A cross-tab with several fields formatted looks similar to the following:
462 |
Seagate Crystal Reports User’s Guide |

How to suppress empty rows, columns, subtotals, and grand totals
Seagate Crystal Reports makes it easy to remove rows and columns from a cross-tab report when those rows and columns contain:
●no records,
●subtotals, or
●grand totals.
Row and column labels
The Cross-Tab dialog box can be used to remove the label on a cross-tab report for specified fields.
NOTE: You can only suppress the label of fields for which you are also suppressing the subtotal.
1In the Rows or Columns list box of the Cross-Tab dialog box, highlight the field whose label you want to suppress.
2Toggle the Suppress Subtotal check box on.
3Toggle the Suppress Label check box on. Now, when you print the report, no label will appear for the selected field.
Empty rows and columns
The Advanced Cross-Tab Options dialog box can be used to remove empty rows and/or columns from a cross-tab.
1In the Cross-Tab dialog box, click the ADVANCED button. The Advanced Cross-Tab Options dialog box appears.
2Toggle the Suppress Empty Rows and/or the Suppress Empty Columns check box(es) on, as needed. Now, when you print the report, no empty rows and/or columns will appear.
Cross-Tab Objects |
463 |
How to print cross-tabs that span multiple pages
Subtotals
The Cross-Tab dialog box can be used to suppress a subtotal for a particular field.
1In the Rows or Columns list box of the Cross-Tab dialog box, highlight the field whose subtotal you want to suppress.
2Toggle the Suppress Subtotal on. Now when you print the report, no subtotal field will appear.
Grand totals
The Advanced Cross-Tab Option dialog box can be used to remove the entire grand total row or column from a cross-tab.
1In the Cross-Tab dialog box, click the ADVANCED button. The Advanced Cross-Tab Options dialog box appears.
2Toggle the Suppress (Rows Grand Totals) and/or Suppress (Column Grand Totals) check box on, as needed. Now, when you print the report, no row and/or column grand totals will appear.
When you create a cross-tab that is wider or longer than the specified page size, the program will automatically span the printing across enough pages to accommodate the size of the cross-tab. In the Preview Tab, a line will appear at each page break. For ease in reading, column headings will be repeated on subsequent pages. Row headings may also be repeated.
1In the Cross-Tab dialog box, click the ADVANCED button. The Advanced Cross-Tab Options dialog box appears.
2Toggle the Repeat Row Labels on Page Break option on in the Advanced Cross-Tab Options dialog box.
464 |
Seagate Crystal Reports User’s Guide |

23 |
The Crystal SQL Designer |
What you will find in this chapter...
The Crystal SQL Designer, Page 466 Why use a query?, Page 466
Using the SQL Designer, Page 467
HANDS-ON (Queries), Page 468
The Crystal SQL Designer |
465 |

The Crystal SQL Designer
Why use a query?
The Crystal SQL Designer is a type of query; a request for specific information from a database. If you are requesting that information from an SQL database (or from a database accessed via ODBC), your query must be written using the Structured Query Language (SQL). The SQL language is not difficult to learn, but mastering the fine points of creating and retrieving data with SQL can take quite a while. Since the SQL Designer eliminates the need to understand SQL, it can get you building effective queries right away.
The SQL Designer has been designed to meet the needs of individuals with little or no query background as well as the needs of experienced SQL professionals.
●If you are new to querying, you will enjoy the way the SQL Designer helps you create queries. By answering a few questions on a set of sequential tabs, you’ll give the program all the information needed to generate a query that fits your needs. The program will do all the work for you.
●If you are an SQL professional, you will appreciate the facility that enables you to fine-tune the queries that the SQL Designer generates. If you are more comfortable writing your own SQL queries, you will find it easy to enter the queries directly or even paste them in from another source.
The Crystal SQL Designer can be a powerful tool for many of your information gathering needs.
NOTE: The SQL Designer can only access data stored in an ODBC data source. Any SQL or any other type of database mentioned in this chapter must be accessed through an ODBC data source.
Query files provide a means of off-loading much of the data generating tasks normally performed by Seagate Crystal Reports on to an SQL or other database server. The set of data returned represents a subset of the actual data in the database - only the data you specifically need.
If you are an experienced SQL programmer, the Crystal SQL Designer allows you to reuse your existing queries, quickly and easily. All of your existing queries become convenient query files that you can use to design reports with Seagate Crystal Reports.
In addition, a Query file provides full ANSI SQL compatibility. Although Seagate Crystal Reports supports powerful SQL pass-through reporting, it does not support the full SQL language or allow you to edit every part
466 |
Seagate Crystal Reports User’s Guide |
Using the SQL
Designer
of an SQL statement. When using the SQL Designer to create data sets on which to base your reports, you get all of the power of SQL, including complex joins, sorts, and aggregate functions.
NOTE: Many of the topics in this chapter refer to specific SQL clauses. If you are experienced with SQL, use this information to better understand how the Query Expert generates an SQL statement. If you are new to SQL, you can ignore this information and continue to use the Query Expert.
The SQL Designer has two primary uses:
1.Designing and developing data sets for building reports in Seagate Crystal Reports, and
2.Retrieving and analyzing current information on an “as needed” basis to facilitate informed decision making.
SEAGATE CRYSTAL REPORTS AND QUERY DATA SETS
Seagate Crystal Reports allows you to design a report based on a query data set rather than tables and fields. Since the query contains a predefined set of data, the tables and fields necessary for the report are already included.
The set of data produced by the SQL query works just like a database table when you design your report. The name of the query, along with fields it accesses, appear in the Insert Field dialog box. Aggregate functions and SQL expressions act like fields, providing data values corresponding to each record in the SQL query.
DATA ANALYSIS AND DECISION MAKING
You may not always need to produce finished reports based on your data; sometimes you just need numbers in a hurry (to prepare for a meeting, to help make projections, etc.). The SQL Designer makes it easy to get the information you need.
Sometimes you may need to retrieve the same data on a recurring basis (weekly, every month end, etc.). By setting up and saving a single query, you can retrieve updated data quickly, whenever you need it, with minimal effort.
NOTE: The SQL Designer can not retrieve any number value longer than 20 characters or calculate a formula with a value longer than 20 characters. Values longer than 20 characters will be truncated.
The Crystal SQL Designer |
467 |