

- •Welcome to Seagate Crystal Reports
- •HANDS-ON (Report Design Environment)
- •HANDS-ON (Sections and Areas)
- •HANDS-ON (Report Creation and Design)
- •HANDS-ON (Finishing Your Report)
- •HANDS-ON (Exporting a Report)
- •HANDS-ON (Compiled Reports)
- •HANDS-ON (Viewing reports with a web browser)
- •Introduction
- •HANDS-ON (Reporting on OLAP data)
- •HANDS-ON (Multiple Section Reports)
- •HANDS-ON (Absolute Formatting)
- •HANDS-ON (Conditional Formatting)
- •HANDS-ON (Record and Group Selection)
- •HANDS-ON (Sorting, Grouping, and Totaling)
- •HANDS-ON (Formulas)
- •HANDS-ON (Running Totals)
- •HANDS-ON (Parameter Field Objects)
- •HANDS-ON (Charting)
- •HANDS-ON (Mapping)
- •HANDS-ON (OLE Objects)
- •HANDS-ON (Subreports)
- •HANDS-ON (Document Import Tool)
- •HANDS-ON (Cross-Tab Objects)
- •HANDS-ON (Queries)
- •HANDS-ON (Dictionaries)
- •HANDS-ON (Working With Databases)
- •North/South American Head Office
- •USA and Latin America
- •Asia/Pacific Offices
- •Europe/Middle East/Africa Offices
- •France – Southern European Head Office
- •Middle East Regional Office (ME & Northern Africa)
- •Glossary

appearing in the field will not be truncated when the report is converted. For example, if the first record in the field contains the name “Bob,” but a record occurring later contains the name “Cynthia,” then you must highlight at least seven characters or spaces for that field.
NOTE: The Document Import Tool comes with two sample text reports and two conversion interfaces files. For information on .cif files, see Generating the Report, Page 439. The text reports are Import1.txt and
Import2.txt, in the C:\Program Files\Seagate Software\Crystal Reports\reports\Import directory(32-bit), or in the directory in which the program resides. You can refer to these reports for examples of successful conversion.
NOTE: You can delete a highlighting frame by selecting the frame and pressing the Delete key, or by right-clicking the frame and choosing Delete from the shortcut menu.
HANDS-ON (Document Import Tool)
How to use the Document Import Tool
1Click the NEW button on the standard toolbar. The Report Gallery appears.
2 Click
Document
Import Tool.
The Document Import Tool appears.
Document Import Tool |
435 |
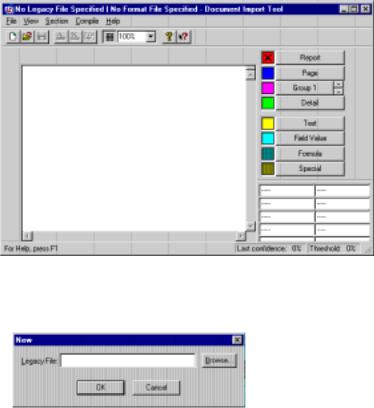
3To convert an ASCII report, choose the NEW command from the File Menu.
The New dialog box appears.
4Enter the name of the ASCII report you are converting in the Legacy File text box, or click Browse to search for an ASCII report in the Open dialog box.
5Click OK when finished. The selected ASCII report appears in the Document Import Tool.
NOTE: If you have already formatted an ASCII report, you can click the OPEN button on the standard toolbar and enter the name of the ASCII report legacy file and the .cif file in the Open dialog box. You must supply both files. Click OK, and the selected ASCII report appears as previously formatted in the Document Import Tool.
CONVERTING AN ASCII TEXT REPORT
For information about the various sections of a Seagate Crystal Reports, see Design Tab Areas, Page 57.
436 |
Seagate Crystal Reports User’s Guide |
1Click the REPORT button to highlight the report header and footer, if applicable. Click the row of data you want designated as the report header. A resizable frame appears; adjust the frame as needed. Then repeat the process to designate a report footer. You can determine that something is a report header or footer if it only appears once, at either the start or the end of the report.
2Click the PAGE button to highlight the first instance of the page header and footer, if applicable. Designate the page header and footer just as you would designate a report header and footer. You can determine that something is a page header or footer if it appears at either the top or the bottom of every page in the report.
3Click the GROUP 1 button to highlight the first instance of the group header and the last instance of the group footer. For the next group level, increment the group number by clicking the up arrow button (to the right of the Group button). The Group 1 button becomes the GROUP 2 button. Define the new group, and then repeat the process for all remaining groups. Be careful not to highlight more than one instance of the same group level.
NOTE: For each group, set the Group by property to one of the fields in the report. This field will work like the Group by field in Seagate Crystal Reports.
NOTE: Both the header and the footer of a group need not be present in a report. If a report only has a group header and not the associated group footer, then it is not necessary to define the group footer in the Document Import Tool. The generated report, in this case, will have the group footer suppressed and the end result will look like the original text report.
4Click the DETAIL button to highlight the first instance of the Detail section.
NOTE: All headers (Report Header, Page Header, Group Headers) should appear before the Detail section. All footers should appear after the Detail section.
5Click the TEXT button to highlight the text instances (which will become text objects) occurring in the previously highlighted sections. Then set the properties for the text objects in the field information text boxes.
NOTE: You must set all the properties for all the text objects in order for the report to generate properly.
6Click the FIELD VALUE button to highlight the database field instances occurring in the previously highlighted sections. Make certain each field highlighting frame is large enough to contain the
Document Import Tool |
437 |
maximum number of characters that can appear in that field. Then set the properties for the field values in the field information text boxes (you may need to resize the window in order to see all the text boxes):
●Set the field data type.
●Set the field name to the name from the text file’s original database.
●Set the default value, if other than NULL (for example, some reports display null date field values as XXX-00-0000).
●If you want the field suppressed when duplicated (a displayed field value is identical to the previous displayed field value), then set the Suppress if Same parameter in the field information to Yes.
NOTE: You must set all the properties for all the fields in order for the report to generate properly.
NOTE: The Document Import Tool sorts the data in ascending order, by default.
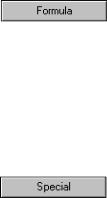
7Click the FORMULA button to highlight the formula instances occurring in the previously highlighted sections.
●If the field is a summary field, set the field name to the name of the database field on which the summary is based.
●Set the summary type (use the Type drop-down list). If the field is a custom formula, set the type to Custom. For information about specifying custom formulas, see How to specify a custom formula, Page 442.
NOTE: You must set all the properties for each formula in order for the report to generate properly.
8Click the SPECIAL button to highlight the special field instances occurring in the previously highlighted sections. Set the field type in the field information text boxes.
NOTE: You must set all the properties for each special field in order for the report to generate properly.
Setting the Confidence Threshold
When the Document Import Tool converts a report, it uses a confidence percentage (C). If fewer than C percent of the fields are located correctly, the conversion will fail. You can change the confidence threshold from the Compile Menu.
1Choose SET CONFIDENCE from the Compile Menu, or click the SET CONFIDENCE button on the standard toolbar. The Confidence dialog box appears.
438 |
Seagate Crystal Reports User’s Guide |
2Set the confidence threshold in the Confidence Threshold text box. The default threshold is 80%.
3Click OK.
The confidence percentage (if changed) is displayed on the status bar. When you generate the report, the system will apply the specified confidence threshold.
Generating the Report
When a converted text report is generated for the fist time, the program generates a conversion interface file (.cif extension), which saves your highlighting and formatting specifications, and an Access.mdb database that contains the data from the text report’s original database.
When you highlight a section or an object in the Document Import Tool and set properties for database fields, these settings are saved in the .cif file. You can use the .cif file to convert ASCII text reports that have a similar format, without having to do any additional highlighting. Also, if you need to generate a certain text report daily, you can convert that report automatically every day, without highlighting anything, because your format specifications are already saved in the .cif file.
The database, meanwhile, stores the original data from the text report. The database does not store formulas, text objects, etc., only database fields. The Document Import Tool then uses this database to create the report.
Furthermore, if the field names you specified for the report are the same as the names specified in the text report’s original database, you can remap the fields in the generated report to the original database. If you remap the fields in this way, you will no longer require the ASCII text report. You will be able to generate your reports directly from within Seagate Crystal Reports, without having to use the Document Import Tool.
Finally, when the report is generated, the program uses repetition in the structure of the report to match any lines that are not highlighted. This is possible because any given section can be followed by certain other sections. For example, a Details section can only be followed by another Details section, a Group Footer 1, or a Page Footer.
This situation has the following ramifications:
●The same .cif file may be used to convert any other instance of the same report.
●Because the report will always contain the same basic structure, you only have to highlight the first instance of headers, and the last instance of footers.
Document Import Tool |
439 |
●The Document Import Tool will not be able to convert text reports that do not match the basic nested structure of Seagate Crystal Reports. For example, the Document Import Tool can not import a cross-tab-like text report because a cross-tab report does not follow the structural pattern of the sections in Seagate Crystal Reports.
●If a section is matched incorrectly in the Document Import Tool, the report will not be generated correctly. For example, suppose you highlight a Details section. Then you look at the next section and assume that it is another Details section (when, in reality, it is a Group Footer). In this case, the Group Footer will not be specified correctly, and the group may not appear on the generated report.
When generating the report the Document Import Tool creates a log file which can be used to view the results of the failed report generation. Check this log file to determine the cause of the first error in the log file. Often, if you fix this problem the other problems will disappear. If you’re still having problems converting a report, check to see whether the sections are highlighted correctly. Make certain you verify that all the text objects have been highlighted as text objects, and not as string fields.
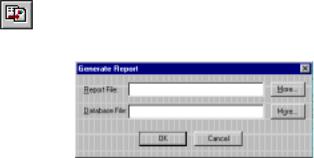
To generate the report:
1Choose GENERATE REPORT from the Compile Menu, or click the GENERATE REPORT LOCALLY button on the standard toolbar.
The Generate Report dialog box appears.
2Enter a report name for the converted report in the Report File text box. To specify a file path and additional options, click More to open the File Option dialog box.
3Enter a database name in the Database File text box (for the database that will be generated when the report is generated). To specify a file path and additional options, click More to open the File Option dialog box.
4Click OK. The program generates the report as specified.
440 |
Seagate Crystal Reports User’s Guide |

How to set report font size
Before compiling, you can specify the report font size as follows:
1Choose OUTPUT FONTSIZE from the Compile Menu, or click the SET REPORT FONTSIZE button on the standard toolbar.
The Output Fontsize dialog box appears.
2 Enter the desired font size in this text box.
3 Click OK.
When the report is generated, the field values will appear in the specified fontsize.
How to define custom colors
For more comfortable ASCII report conversion, the Document Import
Tool allows you to:
●select highlighting colors other than the default colors, and
●define custom highlighting colors.
1Choose the command corresponding to the section of interest from the View|Colors Menu, or right-click a color button and choose COLOR from the shortcut menu.
The Color dialog box appears.
2To select a new color for the specified highlighting frame, click one of the Basic colors.
3To define a custom color for the specified highlighting frame, click Define Custom Colors. The Color dialog box expands to include a color chart. Use this chart to define your custom colors. Then select one of the custom colors you have defined.
4Click OK to return to the Document Import Tool. The new color is applied to the color button and to the appropriate highlighting frames.
NOTE: You can also specify a color or define a color for the module guidelines, by choosing either VERTICAL GUIDELINE or HORIZONTAL
Document Import Tool |
441 |
GUIDELINE from the View|Colors Menu, depending on which guideline you want customized. Then use the Color dialog box to select or define the desired color.
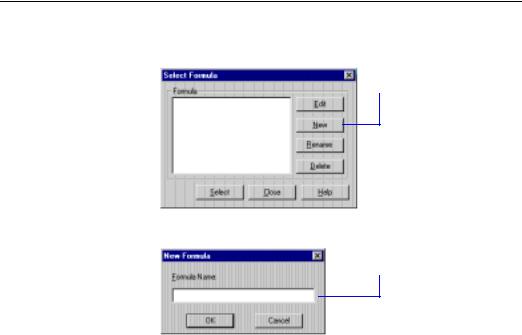
How to specify a custom formula
1Set the summary type for the formula field to Custom. The Select Formula dialog box appears.
2 Click New to create a new formula.
The New Formula dialog box appears.
3 Enter a formula name in this text box.
 4 Click OK.
The Formula Editor dialog box appears.
5Enter the custom formula in the Formula text box.
6Click the SAVE FORMULA AND CLOSE button. The custom formula now appears in the Select Formula dialog box. Click Select to use that formula in the formula field. The formula name now appears in the Type text box in the field information.
NOTE: The Formula Editor does not check a formula before accepting it. Error messages for incorrect formulas will not be generated until the report is generated.
442 |
Seagate Crystal Reports User’s Guide |

22 |
Cross-Tab Objects |
What you will find in this chapter...
Cross-tab overview, Page 444
Cross-tab components, Page 448
HANDS-ON (Cross-Tab Objects), Page 450
Cross-Tab Objects |
443 |

Cross-tab overview
A cross-tab is an object that summarizes and presents data in a compact row and column format. This format makes it easy to compare data and identify trends.
Report examples have been provided with this version of Seagate Crystal Reports to demonstrate the power of cross-tabs. Cross-tabs become an option when you want to consider a specific set of data in relation to a specific category. In other words, use cross-tabs when the word by is included in your report description. For example:
●sales by state,
●products sold by color and size, or
●orders by customer.
While there are certainly many ways to create these kinds of reports, cross-tabs present data in a more compact, easier to understand form than other reporting methods.
NOTE: You can insert as many cross-tab objects in a report as you need. You can even place them in subreports. Thus, you can use cross-tabs to show summarized data in a report that presents the details in another form.
In the following examples, the goal is to analyze the unit sales of five different bicycle locks in four different regions (a unit sales of locks by region report). For greater clarity, only the most essential information in these reports has been included:
●the region from which the order came,
●the name of the lock, and
●the quantity ordered.
The first way of looking at the data is in the most basic of all reports, a columnar report with no grouping or sorting.
444 |
Seagate Crystal Reports User’s Guide |

Report of order data - no sorting/grouping
Report of order data - grouped by region
This report presents nothing but details. Each row represents an individual order. There are many orders from each of the regions for different locks. But because there is no summary information, it is nearly impossible to get any useful information out of a report like this.
The next logical step is to group the data in some way. You can group it by region, or by product line. The following section shows a look at both of these options.
This report uses the data seen in the first report, but here the data is grouped by region. All the orders in each region are grouped together, but each regional group contains orders for different types of locks. Because the groups contain different kinds of data, summarizing the Quantity field will determine the total number of locks sold per Region, but not the total of each type.
Cross-Tab Objects |
445 |
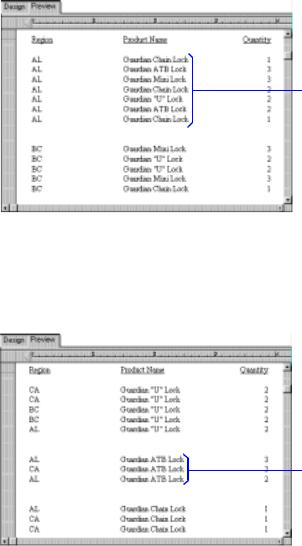
Report of order data - grouped by product
Each region group contains orders for different kinds of locks.
This report groups the data by product. Each group displays all the orders for a specific product. At first it appears that this might be useful, but then it becomes clear that each product group includes orders from several different regions. The information is helpful, and it brings you closer to your goal, but you are still a long way from having the information you need.
Report of order data - grouped by region and product
Each product group contains orders for many regions.
This report is the logical next step. If the By Region report contains multiple products in each region group, and the By Product report contains multiple regions in each product group, then it seems to make sense to combine the two. Doing that, you group first by Region and then by Product.
446 |
Seagate Crystal Reports User’s Guide |
Each group contains orders for one product for one region.
Order data in a cross-tab object
Product names
Total - one product in one region
But the data is all spread out and remains difficult to analyze. This information is useful, and with a little work you can use a report like this to get the comparison information you need. However, a cross-tab offers a better solution.
With cross-tabs, all the information you need is provided in a compact format. The report shows the products sold in each region and what the unit sales were. It is easy to see, for example, that Guardian Mini Locks are not popular at all in California but they are the biggest seller in BC or that Florida is being outsold by Alabama in every lock category.
Regions
|
|
|
|
|
|
|
|
|
|
|
|
|
|
|
|
|
|
|
|
|
|
|
|
|
|
|
|
|
|
|
|
|
|
|
|
|
|
|
|
Total - all products |
|
Total - one product |
|
Total - all products |
|||
|
|||||||
in one region |
|
in all regions |
|
in all regions |
|||
Cross-Tab Objects |
447 |

In this cross-tab:
●Product names make up the row headings.
●Regions make up the column headings.
●The value at each row/column intersection is the sum of all the orders for a particular product for a particular region; for example, the total number of Guardian Mini Locks purchased in British Columbia.
●The total at the end of each row is the total of all of the purchases for one product in all regions; for example, the total number of Guardian ATB Locks purchased in Alabama, British Columbia, California, and Florida combined.
●The total at the bottom of each column is the total number of all kinds of locks ordered in one region; for example, the number of locks of all kinds purchased in California.
●The total in the bottom right corner is the grand total showing the total unit sales of all five locks in all four regions.
The report is compact, and you can compare your customers' purchasing habits in a hurry. Clearly this is a worthwhile report in situations such as this.
Cross-tab components
A cross-tab is an object that summarizes and presents data in a compact row/column format. This format makes it easy to compare data and identify trends. A cross-tab is made up of three elements:
1.rows,
2.columns, and
3.summary fields.
448 |
Seagate Crystal Reports User’s Guide |
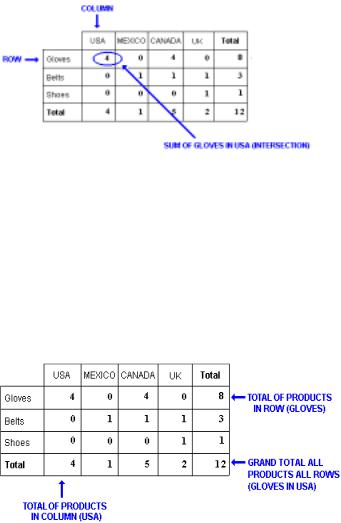
●The rows in a cross-tab run horizontally (from side to side). In the example above, “Gloves” is a row.
●The columns in a cross-tab run vertically (up and down). In the example above, “USA” is a column.
●The summary fields are found at the intersection of rows and columns. The value found at each intersection represents a summary (sum, count, etc.) of those records that meet the row and the column criteria. In the example above, the value at the intersection of “Gloves” and “USA” is four, the number of gloves sold in the USA.
A cross-tab also includes several totals:
●At the end of each row is a total for that row. In the example above, this total represents a single product sold in all countries. At the end of the “Gloves” row is the value 8, the total number of gloves sold in all countries.
●At the bottom of each column is a total for that column. In the example above, this total represents all products sold in a single country. The value at the bottom of the “USA” column is four, the total number of products (gloves, belts and shoes) sold in the USA.
Cross-Tab Objects |
449 |