


Working with Informix MetaCube (MetaCube SQL Method)
In addition to Info OLAP and Hyperion Essbase, Seagate Crystal Reports has been designed to work with MetaCube 4.02 and can take full advantage of MetaCube's 3-tier system.
Creating a report with MetaCube is very similar to creating a report based on any relational database. MetaCube is referred to as ROLAP, which stands for Relational Online Analytical Processing. When creating a report you will see a list of Tables, Sample tables and Predefined Queries with dimensions, attributes and measures. After you log on to the server you can choose the appropriate dimensions, attributes and measures and place them in your report just like you would fields in a relational database report. When working with OLAP data it is often a good idea to create a Cross-Tab style report. In addition it is also a good idea to add a filter to your report to limit the number of records that are returned when you run the report. This filtering can be done using the Record Selection Formula Editor in Crystal Reports.
HANDS-ON (Reporting on OLAP data)
How to create an OLAP report using the Grid Object
NOTE: The following tutorial demonstrates basic techniques for creating a report based on an Info OLAP cube.
The OLAP Expert in the Report Gallery of Seagate Crystal Reports provides a fast and easy method for designing reports based on OLAP data.
In order to design reports based on Info OLAP cubes, you must have a successfully scheduled instance of a cube. If you are not sure whether or not an OLAP cube has been successfully scheduled on your system, contact your Network Administrator. Once a successful instance of an Info OLAP cube exists, you can begin designing reports based on that cube:
1Click the New button on the Standard toolbar. The Report Gallery appears.
Reporting on OLAP data |
183 |

2 Click the OLAP button to create a report using the OLAP Report Expert.
The OLAP Report Expert appears with the Data Tab active. The Data Tab allows you to select an Info OLAP cube to design a report.
.
3 Click
Select.
NOTE: It is possible to use OLAP data with other report types that appear in the Report Gallery. However, only OLAP dimensions and fields are available to other report formats. No OLAP data values or aggregate values can be accessed. Such reports are most often used by Info OLAP Administrators that need to design reports based on the structure of the OLAP cube rather than the data contained within the cube.
The Choose OLAP Type dialog box appears.
184 |
Seagate Crystal Reports User’s Guide |
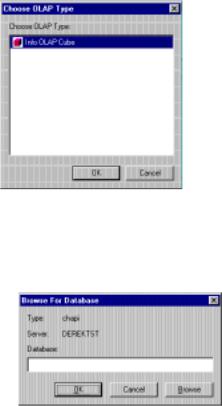
4 Select the Info OLAP Cube.
NOTE: The types of OLAP servers you can connect to may vary. Contact your Network Administrator to find out what types of servers you may connect to.
5 Click OK. The Browse For Database dialog box appears.
6Click the Browse button and use the files and directories dialog box to locate an instance which appears as an *.HDC file in a location designated by your Network Administrator.
7Click OK. You are returned to the OLAP Report Expert.
8Click the Grid Dim Tab to activate it.
Reporting on OLAP data |
185 |
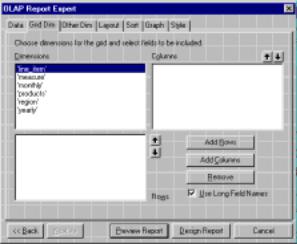
NOTE: The Show Long Names check box is toggled on by default. This means that, for example, the month field will be displayed as January, February, etc., as opposed to M01, M02, etc. You can toggle between long and short names in your report by returning to the OLAP Report Expert and toggling the Show Long Names check box on and off on the Grid Dim Tab. Use the Grid Dim Tab to specify the dimensions that will appear in the rows and columns of your report. This tutorial will show you how to create a report that analyzes products by region.
9Highlight the products dimension in the Dimensions list box and click Add Rows. The generations of the products dimension appear in the Rows list box.
186 |
Seagate Crystal Reports User’s Guide |
10Highlight the region dimension in the Dimensions list box and click Add Columns. The generations of the region dimension now appear in the Columns list box. Optionally you can click on the dimension icon to bring up a field picker, from it you can specify which subset of fields to display on the grid row/column.
At this point, you have successfully performed all of the necessary steps for designing an OLAP report.
11 Click the Other Dim Tab.
Reporting on OLAP data |
187 |
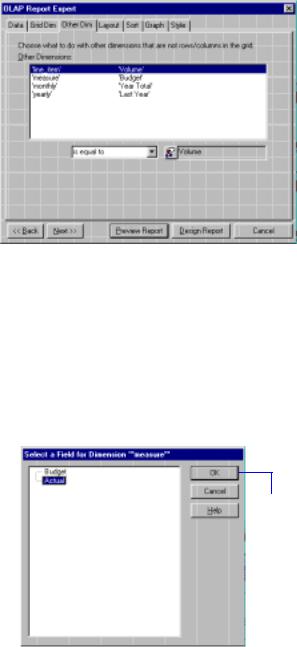
The Other Dimensions list box displays all of the dimensions you did not use in the Grid Dim Tab. The Other Dim Tab lets you specify how dimensions that do not appear in your grid will affect the data for the dimensions that do appear in the grid. For example, the measure dimension currently displays the Budget member. This means all values in your report will represent budgeted data. However, you may want the values in your report to represent actual data.
12To change this so that the report uses Actual sales data, highlight the measure dimension in the Other Dimensions list box, and click the Select Fields button. The Select a Field for Dimension "measure" dialog box appears.
13 Highlight Actual, and click OK.
188 |
Seagate Crystal Reports User’s Guide |
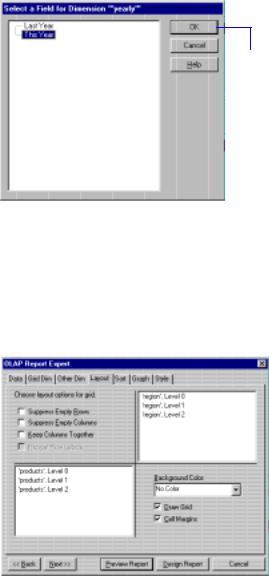
14To change the report so that it uses This Year data, instead of Next Year data, highlight the yearly dimension, and click the Select Fields button. The Select a Field for Dimension "yearly" dialog box appears.
15 Highlight This Year and click OK.
16Finally, to use Sales Revenue data in the report instead of Volume data, highlight the line_item dimension, and click the Select Fields button. The Select a Field for Dimension "line_item" dialog box appears.
17Highlight Revenue and click OK. Your report will display Sales Revenue of products in the line_item dimension in the Other Dim Tab.
18Click the Layout Tab of the OLAP Report Expert.
19 Use the Layout Tab to design the general look of the OLAP Grid
Reporting on OLAP data |
189 |

object. You will use it now to highlight the generation 2 aggregates of the products and region dimensions.
20Highlight products, Level 1 in the Rows list box (the bottom left list box).
21Select Silver from the Background Color drop-down list for level 1 data of the products dimension. A silver rectangle appears around the highlighted item in the list box.
22Highlight region, Level 1 in the Columns list box (the top right list box), and select Silver for the background color.
The Layout Tab should now look like this:
At this point, you have connected to an OLAP database, selected dimensions and fields from the database, and formatted the report. Now, it is time to preview the results of your work.
23Click Preview Report.
This Grid object can be formatted or moved anywhere in the report, and more Grid objects or other subreport objects can be added to the primary report. As you can see, designing OLAP reports is exceptionally easy. After designing a few reports using your own OLAP data, you will quickly master this powerful report design technique.
How to create a MetaCube report
1 Start Seagate Crystal Reports, and click the NEW button on the
190 |
Seagate Crystal Reports User’s Guide |

Standard toolbar.
2Click Standard from the Report Expert Gallery dialog box.
3Scroll down in the list box in the Data Tab and click on MetaCube.
4In the RDBMS Login & Choose DSS System dialog box, click OK to log on to the Demo database for this example.
5Choose Brand Channel Net Profit from the SQL Tables list box.
6Click Add, then click Done.
7Click the Fields Tab to choose dimensions and members.
8In the Fields Tab, select the fields you want from the Database Fields list box and click Add. In this case, select Channel, Brand and Net Profit.
9Click the Sort Tab. Select Brand Channel Net Profit.Channel from the Report Fields list box and click Add. To view the report, click Preview Report.
NOTE: You may have to adjust the column widths of the fields and field headers to see all the data. If you wish to hide the Channel Field column simply select the top element in the field, click the right mouse button and select DELETE from the shortcut menu.
How to apply a filter to a MetaCube report
Imagine you wish to only see the records where net profit was $50,000 or above. The following instructions explain how to apply a filter using the report created from the tutorial on creating a MetaCube report. For more information, see How to create a MetaCube report, Page 190.
1Choose EDIT SELECTION FORMULA|RECORD command from the Report Menu.
2In the Fields list box double click Brand Channel Net Profit.Net Profit. Type in >= 50000. Click ACCEPT.
3Click USE SAVED DATA in the Change in Record Selection Formula Detected dialog box you will notice that records with net profit under 50000 have disappeared.
How to create a MetaCube cross-tab report
1From the Report Gallery dialog box, choose the Cross-tab Expert. From the list box in the Data Tab, scroll down and click MetaCube.
Reporting on OLAP data |
191 |

2In the RDBMS Login & Choose DSS System dialog box click OK to login to the Demo database for this example.
NOTE: If you have already been working with MetaCube reports during this session, step 2 may not be necessary.
3In the choose SQL table dialog box choose Audio Sales YTD by Channel and Click ADD. Do the same for Brand Channel Net Profit. Click DONE. Click the Cross-Tab Tab.
4In the Report Fields list box, drag and drop Channel under Audio Sales YTD by Channel to the Rows list box, Brand under Brand Channel Net Profit to the Columns list box, and Net Profit under Brand Channel Net Profit to the Summarize Fields list box. Click Preview Report and you will see a cross-tab report based on the fields you selected. Save the report.
How to add a field to a MetaCube cross-tab report
This tutorial is based on the report created in the tutorial for creating
MetaCube cross-tab reports.
1Select the entire cross-tab object by clicking in the top, left-hand corner of the object above the top row header, to the left of the far left column header.
2Choose FORMAT CROSS-TAB from the Format menu.
3In the Cross-Tab dialog box select Fiscal Year under Audio Sales YTD by Channel and drag and drop it to the Columns list box.
4Click OK. Notice Fiscal Years is now added to the Cross-Tab report.
5Save the report.
How to pivot fields in a MetaCube Cross-Tab report
This tutorial is based on the report created in the tutorial on how to add a field to a MetaCube cross-tab report. Because of the numerous brands, the report is difficult to work with as far as viewing data or printing. To make it more user friendly, it would be beneficial to switch the fields so that the columns became rows and rows became columns.
1Click on the top column header "Alden" and drag it so that it is positioned over the row header "Department Stores" and drop it.
2Now take the row header and drag it so it is positioned over the
192 |
Seagate Crystal Reports User’s Guide |

column header "Year 1996" and drop it.
3Finally, take the "Year 1996" column header, position it over the Alden row header and drop it.
How to add a formula to a MetaCube report
This tutorial is based on the report created in the tutorial on how to pivot fields in a MetaCube report.
1Select the entire cross-tab object by clicking in the top left hand corner of the object above the top row header and to the left of the leftmost column header. Choose FORMAT CROSS-TAB from the Format menu.
2Click New Formula. In the Formula Name dialog box, type in Net Profit Per Unit. Click OK.
3In the Formula Editor dialog box, double-click Brand Channel Net Profit.Net Profit in the Fields list box, type "/" and double-click Audio Sales YTD by Channel.Units Sold in the Fields list box. Click Accept.
4Now select Brand Channel Net Profit.Net Profit in the Summarized Fields list box and Click Remove. Drag and drop the formula @Net Profit Per Unit to the Summarized Fields list box. Click OK. You will notice the data has changed to reflect the formula.
Reporting on OLAP data |
193 |
194 |
Seagate Crystal Reports User’s Guide |

9 |
Multiple Section Reports |
What you will find in this chapter...
Using multiple sections in reports, Page 196
HANDS-ON (Multiple Section Reports), Page 197
Multiple Section Reports |
195 |
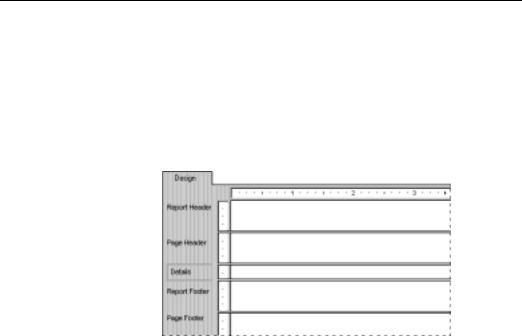
Using multiple sections in reports
Seagate Crystal Reports provides five design areas to use when building your report:
1.Report Header,
2.Report Footer,
3.Details,
4.Page Header, and
5.Page Footer.
Each area contains a single section when you first create a new report. Certain reporting tasks are performed most efficiently by creating multiple sections within an area, such as:
●keeping variable length objects from overwriting each other (see
How to prevent variable length objects from overwriting each other, Page 197),
●putting conditional messages in form letters (see How to print conditional messages in form letters, Page 205),
●eliminating blank lines when fields are empty (see How to eliminate blank lines, Page 207), or
●adding blank lines under specific conditions (see How to add blank lines conditionally, Page 208).
Once you understand the power of multiple sections, you will discover even more ways to produce the effects you want.
Related Topics
How to add, delete, move, and merge sections, Page 79
196 |
Seagate Crystal Reports User’s Guide |