

Beginning SharePoint With Excel - From Novice To Professional (2006)
.pdf76 CHAPTER 4 ■ CREATING SHAREPOINT VIEWS
Figure 4-8. Use And to join two filters to display dates within a range of dates.
If you want to identify blank or nonblank values, select is equal to or is not equal to, and then leave the Value text box empty.
■Tip If you’re uncertain whether to select And or Or to join two filter criteria, ask yourself this simple question: “Do I want to display items than meet both criteria or items that meet either one?” If the answer is “both,” choose And; if the answer is “either,” choose Or.
You can add as many filters to a list as you deem appropriate. Just click Show More Columns at the bottom of the Filter section to add more filter criteria.
Grouping Data
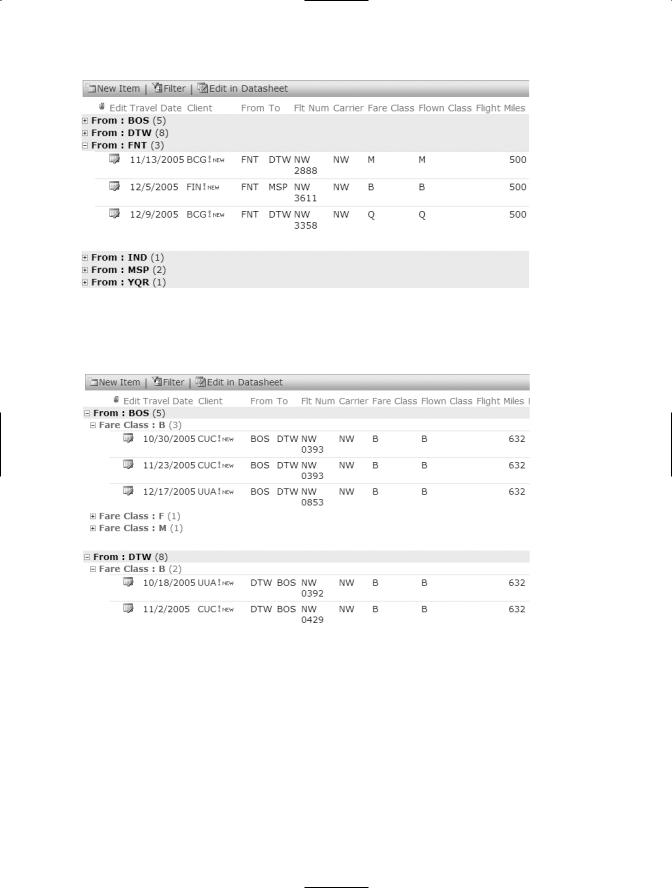
With grouping, you can expand and collapse data within specified categories. Figure 4-9 shows data grouped by origination point (From); all the groups are collapsed except for Flint (FNT), so you can focus on just those trips.
To set grouping, select the first column you want to group by. Grouping automatically sorts by that column, so select whether you want the groups to appear in Ascending or Descending order. Set a second grouping level if you want to create a subgroup. Figure 4-10 shows flights grouped by origination (From) and then by Fare Class.
CHAPTER 4 ■ CREATING SHAREPOINT VIEWS |
77 |
Figure 4-9. With grouped data, you can expand and collapse the groups to focus on the data you want to see.
Figure 4-10. Use two levels of grouping to display groups within groups.
Adding Totals
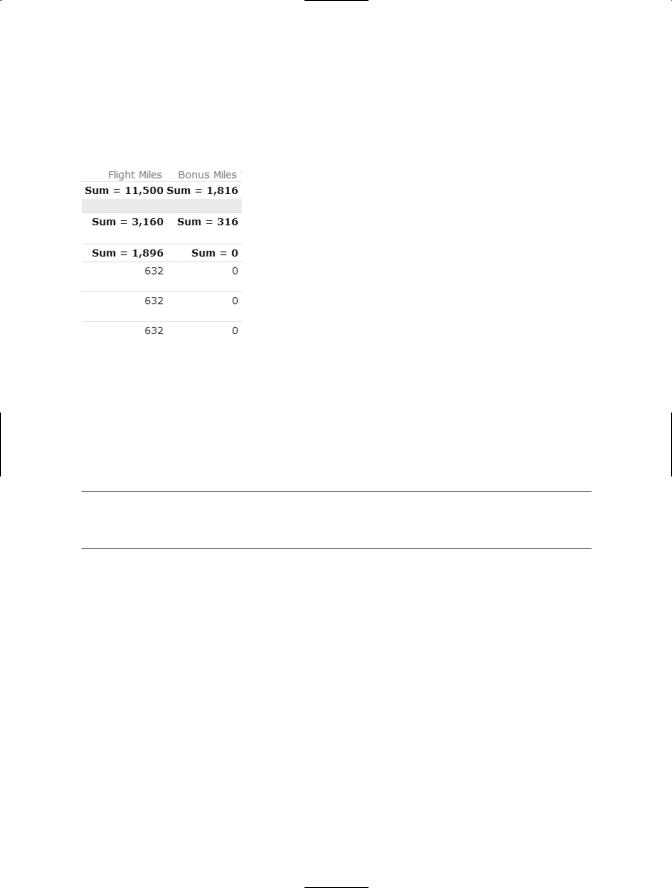
You can add totals to any of the columns in a list. You can use any of seven summation functions: Count, Average, Maximum, Minimum, Sum, Std Deviation, and Variance. Select the function you want to use on the drop-down list adjacent to the column to which you want it applied.
78 CHAPTER 4 ■ CREATING SHAREPOINT VIEWS
If you’re using Group By, SharePoint positions the total at the top of the group. Figure 4-11 shows totals for the entire column (Flight Miles), for the group (From), and for the subgroup (Fare Class).
Figure 4-11. By adding a total to a grouped list, you can generate sums for the entire column, for the group, and for the subgroup.
To remove a total from a column, select None from the Totals drop-down list for that column.
■Tip If you’d rather display the totals at the bottom of the list, you can edit the page in Microsoft FrontPage, and then move the totals where you want them.
Selecting a Style
Styles determine how a list appears on the page. The default style is pretty basic. However, you have your choice of Boxed, no labels; Boxed; Newsletter; Newsletter, no lines;
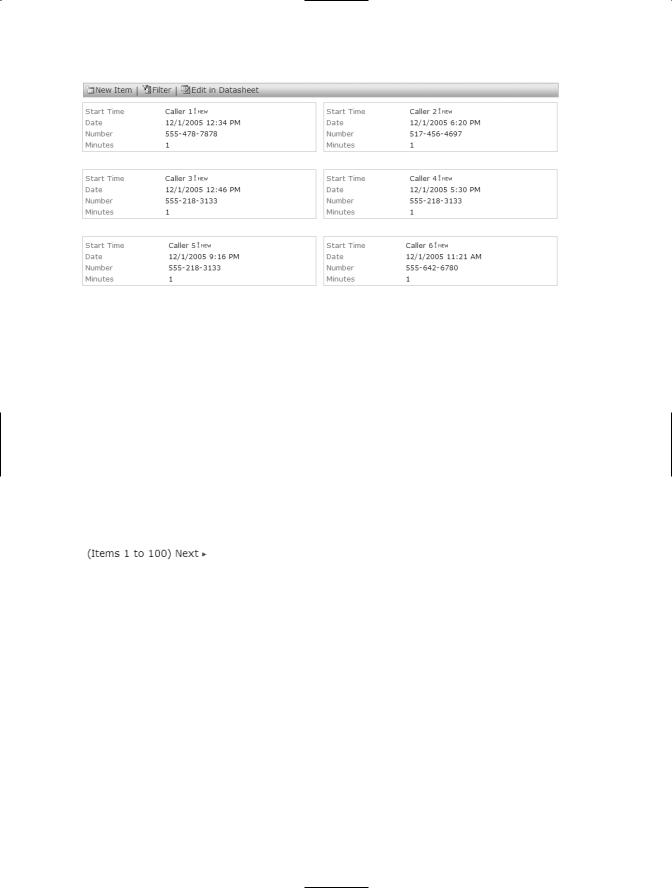
Shaded; and Default. Figure 4-12 shows an example of the Boxed style. This style is particularly useful if you want users to concentrate on one item at a time and then move on to the next. For example, we’ve used it to display a list of training classes so that users could read the descriptions of each class before moving on to the next.
CHAPTER 4 ■ CREATING SHAREPOINT VIEWS |
79 |
Figure 4-12. The Boxed style creates a completely different look for a list.
If you want to change the look of a list, we recommend you try out each of these styles. Some look better with some lists and some with others.
Setting Item Limits
Item limits determine how many items that display on a page. If you have a long list, it might take too long to load, so limiting the items helps to manage this for the users. The default limit is 100 items. When you reach the hundredth item, you see a link to direct you to the next 100, as shown here:
If you want to load more or fewer items at one time, you can set the number of items to display. You can also limit the total number of items returned to a specific number. In this case, users would see the top items in the list and not have access to any additional items.
Modifying an Existing View
After you’ve created several views, you might find the need to modify them. To modify an existing view, follow these steps:
80CHAPTER 4 ■ CREATING SHAREPOINT VIEWS
1.Open the list and then click Modify Settings and Columns in the Actions list.
2.Click the view you want to modify in the Views section of the Customize page.
3.Modify the list using the same tools you used to create it.
4.Click OK to save the modified view.
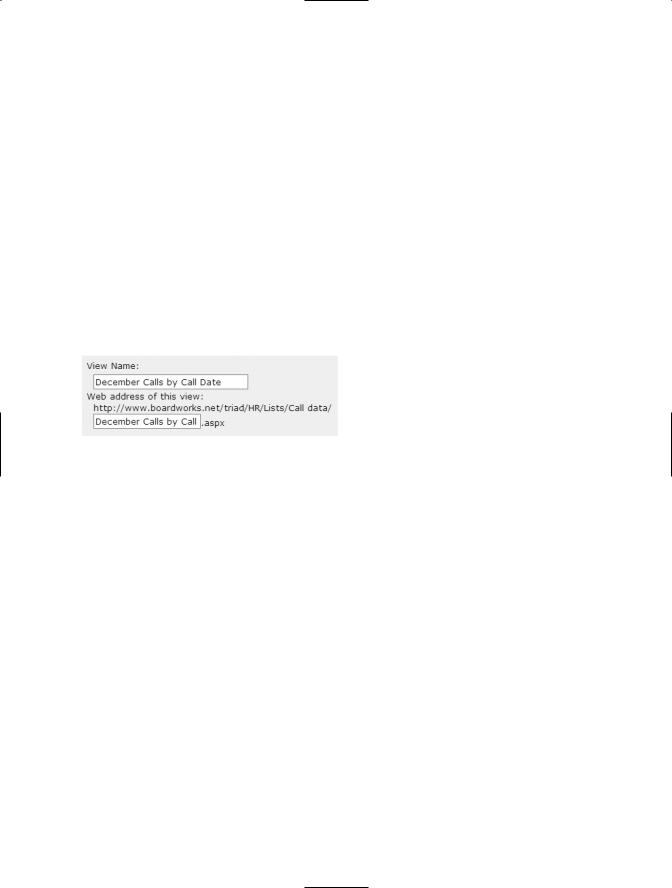
One important reason for modifying an existing view is to change its URL or web address. SharePoint addresses have a limit of 256 characters. It doesn’t take long to reach that limit on most enterprise servers. Although you want to make the view names friendly and descriptive, by editing the web address of the view, you can greatly reduce the number of characters in the address. Figure 4-13 shows the web address of a view we created for this chapter. If you modify the view name to DecCallsByCallDate.aspx, you save nine spaces right off the top. Not a bad result for minimal effort.
Figure 4-13. Rename the web address of the view to remove extra spaces. This saves characters and makes the path easier to read.
Summary
Whether you start with an Excel worksheet or with a SharePoint list template, by customizing lists you can make them work to meet your particular needs. In this chapter, we showed you how to modify an existing list by adding columns and changing the order of columns. We explored the various types of columns that are available in SharePoint, and the strengths of each one. We also examined the world of views, and how views can change your perspective in data. By showing and hiding columns; sorting, filtering, and grouping data; adding totals; selecting a style; and setting item limits, you can create a series of dynamic and useful views that give users entirely new ways to work with data.
In Chapter 5, we’re going to delve into calculations in SharePoint. Although they’re not as flexible and easy to work with as Excel calculations, you’ll find plenty of power to meet many of your calculation needs. And you if can’t do what you need to do, you can always go back and review Chapter 3, which tells you how to export SharePoint lists to Excel.

C H A P T E R 5
■ ■ ■
Creating Custom Calculations
in SharePoint
SharePoint lists are surprisingly versatile. Not only can you add various types of columns (see Chapter 4), you can also create columns that contain simple or complex formulas. You can do standard operations such as addition and subtraction, or make use of SharePoint’s long list of available functions. Many of the Excel functions you’ve grown to know and love are available for use in SharePoint lists. You can create calculated columns— that is, formulas based on columns in a row—or you can display column totals. The best part is that you can export formulas created in a SharePoint list for use in Excel. (Unfortunately, the reverse isn’t true—Excel formulas are converted to values when an Excel worksheet is imported to a SharePoint list.) In this chapter, we’ll show you how to create formulas in a SharePoint list, and we’ll explore many of the most useful functions available to you.
Working with Formulas
Formulas in SharePoint take a little more effort to create than in Excel because you have to create a calculated column, and then create the formula for the column. However, once you do that, the column is locked so users cannot inadvertently overwrite the formula, as they might do in Excel.
Creating Formulas
When you create a formula in a SharePoint list, you can include the following:
81

82C H A P T E R 5 ■ C R E AT I N G C U S TO M C A L C U L AT I O N S I N S H A R E P O I N T
•References: References are column names, and refer to a cell in the current row in the datasheet. If the column name includes spaces, you must enclose the name in square brackets: [Flight Miles], for example. You can use references for columns that are formatted as Single line of text, Number, Currency, Date and Time, Choice,
Yes/No, and Calculated. You cannot reference a cell in a row other than the current row.
•Operators: You can use any of the standard math, comparison, and logical operators, such as +, –, /, *, %, ^, >, <, >=, <=, <>, &, OR, NOR, and XOR.
•Constants: You can include four different type of constants:
•String: Strings must be enclosed in quotes and can be up to 255 characters. An example of a string constant might be (=[Origination] or ="DTW").
•Numeric: Numeric constants can be positive or negative and can include decimals; for example, =[Flight Miles]*.10.
•Date constants: Dates can be presented with or without delimiters; for example, 1/23/06 or 012306.
•Boolean constants: You can use Boolean constants in logical expressions such as IF statements. For more about IF statements, see IF in the section “Applying Logical Functions” later in this chapter.
•Functions: Functions are predefined formulas. SUM is a simple function. It performs a predefined operation based on identified arguments or specified values, such as column references. See “Incorporating Functions into Formulas” later in this chapter.
■Caution You can create up to eight calculated columns in a SharePoint list. If you try to exceed that number, SharePoint returns an error:
Column Limit Exceeded: There are too many columns of the specified data type. Please delete some other columns first. Note that some column types like numbers and currency use the same data type.
Although it isn’t clear from the message, this refers to calculated columns. You can exceed this limit for noncalculated columns.

C H A P T E R 5 ■ C R E AT I N G C U S TO M C A L C U L AT I O N S I N S H A R E P O I N T |
83 |
When you create a formula in SharePoint that contains several operators, you need to be aware of the order in which SharePoint evaluates the formula. Knowing the order of operations can protect you from costly errors. For example, the result of the following formula, =2+3*6, is 20 (3*6=18+2=20) and not 30 (2+3=5*6=30). SharePoint evaluates the multiplication first and then adds 2 to the product, rather than adding first and then multiplying.
If a formula has two operators at the same level—addition and subtraction, for example—SharePoint evaluates the formula from left to right. So, for example, in the formula =4*5/4, SharePoint first multiplies 4 times 5 (20), and then divides by 4 for a result of 5. Table 5-1 shows the order of operations for SharePoint formulas.
Table 5-1. Order of Operations for SharePoint Formulas
Operator |
Description |
– |
Negation (as in –1) |
% |
Percent |
^ |
Exponentiation |
* and / |
Multiplication and division |
+ and – |
Addition and subtraction |
& |
Connects two strings of text (concatenation) |
=, <, >, <=, >=, <> |
Comparison |
|
|
If you need to change the order of operations, use parentheses to enclose the part of the formula you want to calculate first. For example, if you wanted to calculate 2+3 and then multiply the result by 6, you could do that by enclosing the 2+3 in parentheses; for example, (2+3)*6.
Creating Calculated Columns Using Column References
To add a calculated column, follow the steps described in Chapter 4 for adding a new column to a list (see “Creating a Column” in Chapter 4). Enter a name for the column and choose Calculated from the list of available column types. Then follow these steps to modify the Optional Settings for the column:
1.Enter a description of the column.
2.Double-click the first column you want to use in the formula.
3.Enter an operator.
4.Double-click a second column to follow the operator.

84C H A P T E R 5 ■ C R E AT I N G C U S TO M C A L C U L AT I O N S I N S H A R E P O I N T
5.Continue until you’ve completed the formula.
6.Select a data type that will be returned from the formula: Single line of text, Number, Currency, Date and Time, or Yes/No.
7.If you select Number, Currency, or Date and Time, select additional options for that data type:
•Number: Number of decimal places and Show as percentage
•Currency: Number of decimal places and Currency Format
•Date and Time: Date Only or Date & Time
8.Clear the Add to default view checkbox if you don’t want the column added to the default view.
By applying these steps, you can create simple and complex formulas using any of the allowed operators: references, constants, and functions. SharePoint creates the column and inserts the resulting calculations. So, for example, if you enter the formula [Flight Miles]+[Bonus Miles] in the column called Total Miles, SharePoint inserts the column and displays the results in the new column. By using column references, such as column names, you avoid the issue that a cell in a SharePoint list doesn’t have a cell address, unlike in Excel.
■Note You don’t have to enter the equal sign (=) to begin a formula in SharePoint. SharePoint adds it automatically when you save the column. You also don’t have to enclose column names in brackets unless the column name includes spaces, but you might find it useful in clarifying formulas as you create them. If the column name doesn’t include spaces, SharePoint removes the brackets after you save the column.
Creating Common Formulas
By combining operators with references and constants, you can create countless formulas in SharePoint lists. Table 5-2 demonstrates common formulas using standard operators.
Calculating Column Totals
Formulas in SharePoint lists are limited to formulas related to columns in a single row. For example, you cannot create a formula to calculate the variance from the average where you compare a cell in a column to the average of the column. However, you can include column and group totals using the COUNT, AVERAGE, MAXIMUM, MINIMUM,

C H A P T E R 5 ■ C R E AT I N G C U S TO M C A L C U L AT I O N S I N S H A R E P O I N T |
85 |
SUM, STD DEVIATION, and VARIANCE functions. Adding column and group totals is functionality that’s built into SharePoint lists—it doesn’t require you to create a formula. To add column totals, refer to “Adding Totals” in the section “Creating a New View” in Chapter 4.
Table 5-2. Common SharePoint Formulas
Description |
Formula |
Example |
Result |
Add the values in |
=Column1+Column2+Column3 |
=[FlightMiles]+[BonusMiles]+ |
Calculates total miles |
three columns |
|
[PromoMiles] |
|
Subtract the values |
=Column1-Column2 |
=[Price]-[Discount] |
Calculates price minus |
in two columns |
|
|
discount |
Multiply the values |
=Column1*Columns2 |
=[Price]*[DiscountPercent] |
Calculates the amount |
in columns |
|
|
of the discount |
|
|
|
(DiscountPercent column |
|
|
|
must be formatted as |
|
|
|
a percentage) |
Divide the values |
=Column1/Column2 |
=[TotalCost]/[Quantity] |
Calculates cost per item |
in two columns |
|
|
|
Multiply the values in |
=Column1-Column2*Column3 |
=Price-[Price]* |
Calculates the discounted |
two columns and |
|
[DiscountPercent] |
price |
subtract the product |
|
|
|
from the first column |
|
|
|
Multiply the value |
=Column1*10/100 |
=[Cost]*10/100 |
Calculates 10 percent of the |
in a column by a |
|
|
cost |
constant |
|
|
|
Add the value in two |
=(Column1+Column2)*Column3 |
=[FlightMiles+BonusMiles]*2 |
Doubles total miles |
columns and multiply |
|
|
|
by a third |
|
|
|
Subtract one date |
=Column1-Column2 |
=[StartDate]-[EndDate] |
Calculates how many days |
from another |
|
|
between the start and end |
|
|
|
dates |
Compare the values |
=Column1>Column2 |
=[ProposedCost]>[ActualCost] |
Returns Yes if the proposed |
in two columns |
|
|
cost is greater than the |
|
|
|
actual cost |
|
|
|
|
Incorporating Functions into Formulas
Just like in Excel, functions make it possible to evaluate text and data in ways that return useful results. Functions are predefined formulas that use a specific structure to perform calculations. With functions, you can perform simple and complex operations with little effort. For example, you can use the AVERAGE function to determine the average of a group of values, rather than using the two-step process of summing the values and dividing by the number of values. You can apply other functions, such as CONCATENATE, to text values to combine the values into one. For example, you can combine the [FirstName]