

Beginning SharePoint With Excel - From Novice To Professional (2006)
.pdf176 CHAPTER 9 ■ USING SHAREPOINT’S OFFICE WEB PARTS
Setting Worksheet and Workbook Options
On the Sheet tab of the Commands and Options dialog box, you can turn off the display of row and column headers and gridlines in a spreadsheet. You can also change the display of the worksheet from left to right, to right to left if you’re working in a right-to-left oriented language.
On the Workbook tab of the Commands and Options dialog box, shown in Figure 9-5, you can change the following options that affect the entire workbook.
Figure 9-5. Change workbook options on the Workbook tab.
•Calculation: Just as in Excel, workbooks are set to calculate automatically. However, if you have a large, formula-heavy workbook, you might find that automatic calculation is slowing down data entry. If that’s the case, you can switch to manual calculation. To switch to manual, click Manual. When you’re ready to calculate, click the Calculate button and all formulas in the workbook are calculated.

CHAPTER 9 ■ USING SHAREPOINT’S OFFICE WEB PARTS |
177 |
■Caution Setting a workbook to calculate manually can be a dangerous practice, especially in a workbook where revisions are made to data that has already been calculated. Users might not realize that formula results haven’t been updated, and thereby might use inaccurate results. If you’re going to set
a workbook to calculate manually, it’s best to do it in workbooks where new data is being entered.
•Show/Hide: Select the appropriate checkbox to show or hide the vertical scrollbar, the horizontal scrollbar, sheet tabs, and the toolbar.
•Worksheets: To rename a worksheet, select the sheet from the Worksheets list, then select the sheet name in the “Sheet name” text box and overwrite it with a new name. You can insert worksheets into an Office Spreadsheet Web Part by clicking the Insert button. The sheet is inserted above the sheet you’ve selected in the Worksheets list.
To delete a sheet, select it from the Worksheets list and click the Delete button. Click Yes to verify that you want to delete the sheet.
To change the order of worksheets in a workbook, select the sheet you want to move and click the up and down arrow buttons to reposition the sheet.
To hide a worksheet in a workbook, select the sheet and click the Hide button. This is especially useful if you have a sheet in a workbook that contains data you’re using for lookup lists, or to support formulas that you don’t want users to change. The sheet still appears in the list of worksheets, but it’s designated as hidden. Select the sheet again and click the Unhide button to unhide it.
Printing a Worksheet
It’s not easy to say you’re out of luck if you want to print a worksheet, but that’s the truth. You can print the web page that contains the worksheet, but you cannot print the contents of the web part. If you need to do that, export the workbook to Excel (click the Export to Excel button on the toolbar) and print it from there. If a worksheet is too big (too many columns or rows) to fit in Excel, you’ll first have to divide it up into multiple worksheets before you export it.

178 CHAPTER 9 ■ USING SHAREPOINT’S OFFICE WEB PARTS
Working with the Office PivotTable Web Parts
As mentioned at the beginning of the chapter, the Office web parts come in several varieties: Office Spreadsheet, Office Datasheet, Office PivotTable, Office PivotChart, and Office PivotView. You’ve already seen how the Office Spreadsheet Web Part operates. Now we’ll take a look at the other four Office web parts. The Office Datasheet, PivotTable and PivotChart Web Parts are fundamentally all the same thing. They each offer a different view of the data but are, in essence, interchangeable with one another. The Office PivotView Web Part combines them all by letting you switch between the other three data views.
If you’re experienced with Excel PivotTables, you’ll be happy to know that all the functionality that you find in Excel PivotTables and PivotCharts is available in the PivotTable and PivotChart Web Parts, although finding the functionality might be challenging. If you’re new to PivotTables, we recommend you learn to use them in Excel before attempting to work with them here in SharePoint. It’s important for you to have at least a basic understanding of them to understand their role in SharePoint.
PivotTables make it possible to take large amounts of data and display it, analyze it, and report on it. Rather than presenting a report with 2,000 (or 20,000) individual records, you can use PivotTables to summarize the data, group it together, aggregate it, filter it, count it, and subtotal it so you can identify trends, spot inconsistencies, and analyze the data.
The four SharePoint PivotTable–related web parts are described in more detail later in this chapter, but before we introduce how to connect to data sources, here’s a brief overview:
•Office Datasheet Web Part: This web part displays data in a tabular format. In other words, it presents it in a detailed view, just like in an Office Spreadsheet Web Part. Use this web part if you want to be able to sort and filter columns of data or enter new data. You can also use it to display specific columns of data from another data source.
•Office PivotTable Web Part: This is the primary web part to use when you want to group, aggregate, and subtotal data by rows or by columns.
•Office PivotChart Web Part: This web part takes tabular data and presents it in
a graphical format. It can be dynamically linked to the data source so it updates as the data is updated.
•Office PivotView Web Part: When you want to be able to switch between Datasheet view, PivotTable view, and PivotChart view, this is the web part to use. A simple drop-down menu gives you the best of all worlds.

CHAPTER 9 ■ USING SHAREPOINT’S OFFICE WEB PARTS |
179 |
Connecting Web Parts to Data
Regardless of the type of Office web part you’re using, you can connect the web part to existing data sources. In fact, to use any of the Office web parts except for the Office Spreadsheet Web Part, you have to connect them to a data source before you can use them. Additionally, you can connect every sheet in an Office Spreadsheet Web Part to
a different data source, while each of the other web parts can typically maintain only one data connection at a time.
You can connect Office web parts to external data sources or to another web part. However, if you connect one web part as the data source for another web part, you cannot use that web part as a data source to connect to another web part. For example, if you have an Office Spreadsheet Web Part filled with transaction data, you can connect that data to an Office PivotTable Web Part to create a pivot table, but you cannot then also connect it to an Office PivotChart Web Part to create a chart. If you need more than one view of the data, use the Office PivotView Web Part so you can switch between Datasheet, PivotTable, and PivotChart views of the same data.
Connecting to External Data Sources
Although SharePoint presents you with a number of options for connecting to data sources, some are clearly better than others. First of all, although this might seem obvious, you have to make sure that the data resides in a shared server location. If it doesn’t, everything will look great to you but no one else will be able to see it.
Second, some of the data connection options are old-style 32-bit ODBC (Open DataBase Connectivity) connections. These rely on mapped network drives that aren’t reliable. The mapping has to be identical for every user to access the data successfully. If you can avoid using ODBC connections, it’s best to do so.
You’ll have the most success connecting to SharePoint lists, to Microsoft SQL Server databases, and to Microsoft Business Solutions data (for Great Plains data). You can also connect the data that resides in an Access or other database as long as it’s saved in
a shared network location, including on the SharePoint site itself.
To connect to an external data source—that is, any data source that isn’t on the current web part page—click the Connect to an External Data Source link. This opens the Connect Data Source dialog box.
If you have an existing data source connection, specifically an Office Data Connection (ODC) file or a Data Retrieval Service Connection (OXDC) file, you can navigate to the data source and then select it.
If you haven’t created an existing data source connection file, you must create one by clicking the New Source button to launch the Data Connection Wizard.

180 CHAPTER 9 ■ USING SHAREPOINT’S OFFICE WEB PARTS
Creating a Data Connection to a SharePoint List
To create a new data source connection to a SharePoint list, follow these steps:
1.In the first step of the Data Connection Wizard, select Data retrieval services. Click Next.
2.Select Windows SharePoint Services lists. Click Next.
3.Enter the address for the WSS or SPS site. The easiest way to do this is to open the site in a separate browser window, navigate to the site, copy the site address in the address bar (Ctrl+C), then paste it into this text box (Ctrl+V). Delete the specific reference to the home page in the address (for example, default.aspx). Click
Next.
4.In the next step of the wizard, Select a Data Object, select the list you want to connect to. Click Next.
5.In the Select Fields step, select the fields you want to include in the connection from the list of available columns. You can select multiple noncontiguous columns by holding the Ctrl key. Click Add to add the columns or Add All if you want all the columns. Use the Remove and Remove All buttons to alter your selection. Click the Move Up and Move Down buttons to set the order of the columns as you want them to appear. Click Next.
6.To specify a sort criteria, select the columns you want to sort by. For each column in the Sort Order box, indicate if you want the sort order to be Ascending or Descending. You can change the sort order of the data in the web part. Click Next.
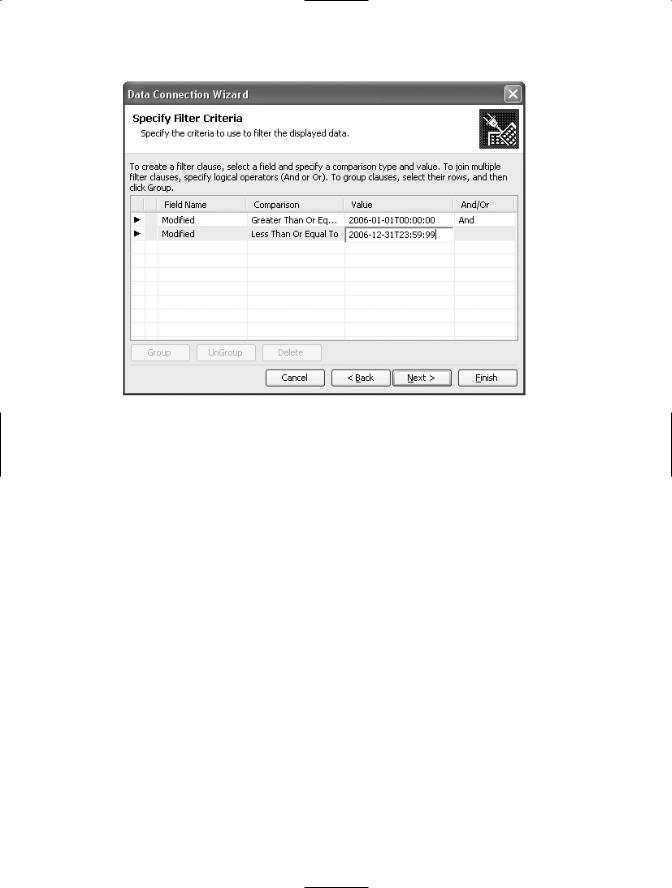
7.If you’d like to retrieve only some of the records, enter filter criteria on the Specify Filter Criteria page, shown in Figure 9-6.
CHAPTER 9 ■ USING SHAREPOINT’S OFFICE WEB PARTS |
181 |
Figure 9-6. Enter filter criteria on the Specify Filter Criteria page.
a.Select the field name from the Field Name drop-down list.
b.Select the comparison term. The available comparison terms vary depending on the type of field you’ve selected. With Yes/No fields, for example, the options are Equal To, Not Equal To, Is Null, and Is Not Null.
c.Select or enter a value to compare the contents of the field to. Again, the choices here might be limited based on the comparison. With Yes/No fields, the options are True or False.
d.To enter additional filter criteria, select And or Or and enter a second filter statement. Click Next.
8.Indicate if you’d like to limit the number of rows the data connection retrieves. You might want to do this with large databases where a sample of data is sufficient to do the analysis you need. If you choose Yes, you must enter a number of rows you want to retrieve. Click Next.

182CHAPTER 9 ■ USING SHAREPOINT’S OFFICE WEB PARTS
9.Enter a name, if you want to change the one provided, and a description of the new data connection. This helps others know what’s in this data connection, and is especially useful if you’ve filtered the data or limited the number of rows.
10.Click Finish to create the data connection. This opens the Select Data Source dialog box, similar to the one you used to launch the Data Connection Wizard.
11.Click Open to open the newly created data connection.
When you connect to an existing SharePoint list from an Office Spreadsheet Web Part, the data is displayed with Excel list functionality activated. For more information about using Excel list functionality, refer to Appendix A.
Creating a Data Connection to a Database
To create a connection to an Access database, you start out the same way you do for
a connection to a SharePoint list: click the Connect to an External Data Source link. This opens the Connect Data Source dialog box. Then click the New Source button to launch the Data Connection Wizard. From the first step of the Data Connection Wizard, follow these steps:
1.Select Other/Advanced from the list of available data sources. Click Next.
2.In the Data Link Properties dialog box, on the Provider tab, select the data you want to connect to. For an Access database, follow these steps:
a.Choose Microsoft Jet 4.0 OLE DB Provider. Click Next.
b.Select or enter the database name, or click the ellipsis (...) button to open the Select Access Database dialog box. In this case, navigate to the database (in a shared network location) and click Open.
c.Enter appropriate login information to access the database.
d.Click Test Connection to make sure the connection succeeds.
e.Click OK.
3.Back in the Data Connection Wizard, select the table or query that contains the data you want to connect to.

CHAPTER 9 ■ USING SHAREPOINT’S OFFICE WEB PARTS |
183 |
4.Enter a name, if you want to change the one provided, and a description of the new data connection. This helps others know what’s in this data connection, and is especially useful if you’ve filtered the data or limited the number of rows.
5.Click Finish to create the data connection. This opens the Select Data Source dialog box, similar to the one you used to launch the Data Connection Wizard.
6.Click Open to open the newly created data connection.
If the data you want to connect to resides in a SQL Server, SQL Server OLAP Services, or Oracle database, you follow the same basic steps after selecting the appropriate database from the list of available data sources. However, rather than step 2, you just enter the server name where the database is located and enter the logon credentials. When you click Next, you’re ready for step 3.
If the data source you’re trying to connect to lives on another domain, you must enable an Internet Explorer security option that allows IE to access data sources across domains. Go to Tools Internet Options. On the Security tab, click Custom Level. Scroll down the available settings in the Miscellaneous group, and change Access Data Sources across Domains to Enable or Prompt.
If you decide to disconnect from a database connection, right-click the datasheet and from the shortcut menu, choose External Data Delete Query.
Connecting to Another Web Part
If you already have data in an Office web part, you can connect another web part to it rather than connecting to an external data source. For example, if you have transaction data in an Office Spreadsheet Web Part, you can use an Office PivotTable Web Part to analyze that data. To connect to another web part, follow these steps:
1.Click the down arrow on the title bar of the web part and choose Modify Shared Web Part.
2.Click the down arrow again and click Connections. You have six choices for the type of connection you want to make:
•Get Data From: Use this to connect to another web part that contains tabular data.

184CHAPTER 9 ■ USING SHAREPOINT’S OFFICE WEB PARTS
•Filter Data With: Use this when you have data in another web part that contains a column of data you want to use to filter the data in the PivotView Web Part.
•Send Data To: With this you can send all the data in a PivotView Web Part to another web part that displays tabular data.
•Send Row To: With this you can send a selected row of data from a PivotView Web Part to another web part for use as a filter or parameter value.
•Chart Data From: Connect the PivotView Web Part in PivotChart view to
a Spreadsheet Web Part, a PivotView Web Part in PivotTable view, a PivotView Web Part in Datasheet view, or another PivotView Web Part in PivotChart view. The advantage of this connection is that any change in the source data is reflected in the PivotChart.
•Chart Data To: Connect the PivotView Web Part in PivotTable view, Datasheet view, or PivotChart view to another PivotView Web Part in PivotChart view. This connection is synchronized with the source data.
After you’ve selected the type of connection and the screen refreshes, the connection is established.
To disconnect from another web part, reselect the type of connection from the menu. You’re prompted to verify that you want to remove the connection.
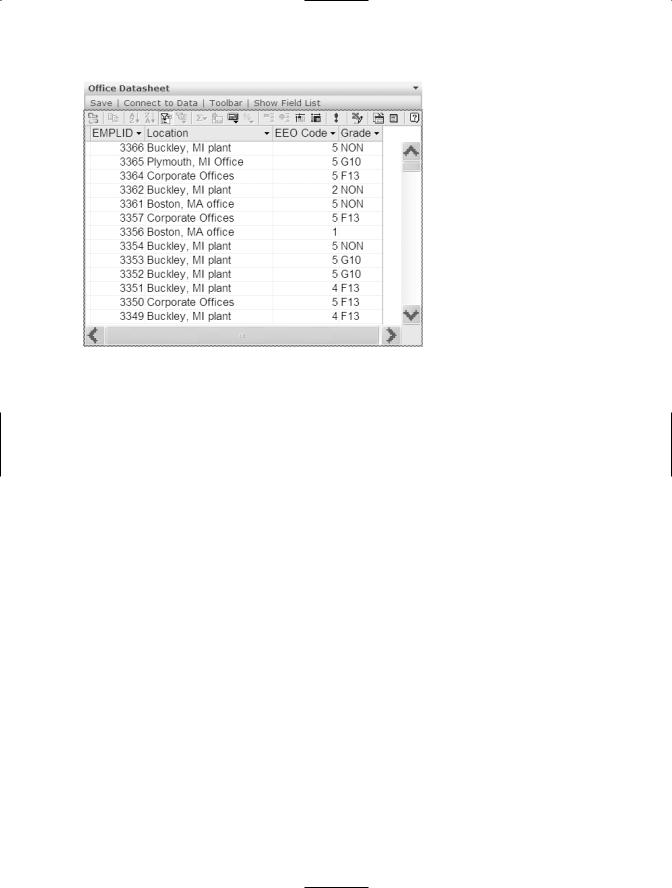
Using the Office Datasheet Web Part
The Office Datasheet Web Part, shown in Figure 9-7, is designed to offer a tabular or list view of data from another data source. After you’ve established a data connection (see “Connecting Web Parts to Data” earlier in this chapter), you can view the data, add new data, sort, and filter the data. Click the Toolbar button on the toolstrip to access Sort, Filter, and other commands.
CHAPTER 9 ■ USING SHAREPOINT’S OFFICE WEB PARTS |
185 |
Figure 9-7. The Office Datasheet Web Part typically displays tabular data.
If you want to add a quick total to the data, scroll to the bottom of a column and click the AutoCalc button. Select the type of total you want from the list that opens. The web part inserts a new totals row at the bottom of the datasheet.
To remove a field from the display, click and drag the field header off the datasheet. When the pointer includes a red X, drop it. To add fields back to the display, click the Field List button to add fields to the display. Drag the fields you want to see into the datasheet (the web part places the fields into the Column Area).
Using the Office PivotTable Web Part
A PivotTable, shown in Figure 9-8, differs from a datasheet in that it offers a threedimensional view of the data.