

Beginning SharePoint With Excel - From Novice To Professional (2006)
.pdf56 C H A P T E R 3 ■ W O R K I N G W I T H S H A R E P O I N T L I S T S I N E X C E L
If you’re relatively new to PivotTables, you can find more information on creating and manipulating PivotTable reports in Excel. Choose Help Microsoft Excel Help, then enter pivot in the search box. For
a quick overview, the Microsoft web site includes a fine demo:
http://office.microsoft.com/en-us/assistance/HA011989031033.aspx
It offers a training module as well:
http://office.microsoft.com/training/training.aspx?AssetID=RC010136191033
Creating a PivotChart Report
To create a PivotChart from the data in the PivotTable, click the Chart Wizard button on the PivotTable toolbar. Excel charts the PivotTable report data in a separate worksheet, as shown in Figure 3-18.
Figure 3-18. Click the Chart button on the ChartWizard toolbar to create a PivotChart based on the current PivotTable report.

C H A P T E R 3 ■ W O R K I N G W I T H S H A R E P O I N T L I S T S I N E X C E L |
57 |
Refreshing PivotTable and PivotChart Data
The data for the PivotTable report or PivotChart is external data stored on the SharePoint site, not in the Excel workbook. You should occasionally refresh the data to retrieve the latest data from the site. How often you refresh depends on how often the data in the SharePoint list is modified. To retrieve current data from the SharePoint list, click the Refresh Data button on the PivotTable toolbar.
Creating a PivotTable Report from Excel Offline Data
To create a PivotTable report using data previously exported to Excel, follow these steps:
1.Select any cell in the list, then choose Data PivotTable and PivotChart Report to launch the PivotTable and PivotChart Wizard.
2.In the first step of the wizard, choose Microsoft Office Excel list or database. Choose the kind of report you want to create and click Next.
3.In the second step of the wizard, ensure that the entire list (except the blank row for a new record) is selected. Click Next.
4.In the final step of the wizard, choose a location for the PivotTable report and click Finish to create the report.
Summary
This chapter focused on reasons you would choose to export SharePoint lists to Excel, and techniques for exporting and synchronizing lists. Offline synchronization provides convenience for road warriors. You have access to PivotTable and PivotChart reports, and other advanced summarization and analysis tools, as soon as you export to Excel. The combination of SharePoint and Excel provides more functionality and a broader feature set for data manipulation and analysis.


C H A P T E R 4
■ ■ ■
Creating SharePoint Views
One of the most important reasons for importing Excel data into a SharePoint site is the power, flexibility, and control that comes with being able to create and save views of the data. Views make it possible for users to focus on data customized to their unique needs. With views, you can create and save multiple configurations that each display data differently. You can choose which columns to display, and in what order you want to see them. You can change the sort order, group the data differently, and even filter the data to just show records that meet specific criteria. In addition, you can display column totals, designate how many records to show, and choose different layouts.
In this chapter, we’ll show you how to create totally customized views of SharePoint lists, and how to change the default view to one that best fits your needs. Then, in Chapter 7, we’ll take views to the next level by showing you some practical business solutions using Excel lists and SharePoint views.
■Note Throughout this chapter, we’ll be referring to creating views of SharePoint lists—it’s irrelevant whether a list was created in Excel and imported into SharePoint, or created directly in SharePoint. All the information in the chapter also applies to SharePoint document libraries.
Modifying a SharePoint List
When you create a SharePoint list or import a spreadsheet into SharePoint, SharePoint displays all the columns in the order you create them, or the order in which they appear in the spreadsheet. You can add columns to the list; change the order in which the columns appear on the New Item and Edit Item forms; modify a column’s name, description, and other properties; and remove columns from the list.
59

60 CHAPTER 4 ■ CREATING SHAREPOINT VIEWS
Adding Columns to a List
In SharePoint, you can create columns that hold single lines of text and others that hold pictures. In all, SharePoint has ten column types available, described fully in the section “Column Types”:
•Single line of text
•Multiple lines of text
•Choice (menu to choose from)
•Number (1, 1.0, 100)
•Currency ($, ¥, £)
•Date and Time
•Lookup (information already on this site)
•Yes/No (check box)
•Hyperlink or Picture
•Calculated (calculation based on other columns)
Creating a Column
To create a new column, follow these steps:
1.Open the list on the SharePoint site.
2.Click Modify Settings and Columns in the Actions list.
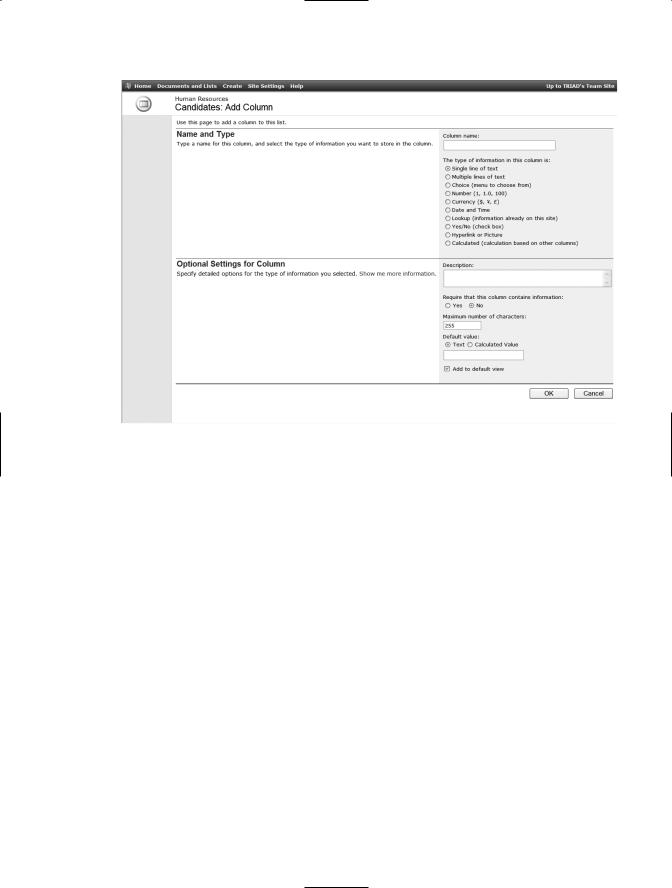
3.Click Add a Column in the Column section of the “Customize [list]” page. This opens the Add Column page, a portion of which is shown in Figure 4-1.
CHAPTER 4 ■ CREATING SHAREPOINT VIEWS |
61 |
Figure 4-1. Use the Add Column page to select the type of column you want to create, and to enter required and optional settings for that column.
When you create a column, you’re required to enter a column name and choose
a column type. You can then enter optional settings for the column. Regardless of the column type you select, you can enter the following optional settings:
•A description of the column: This text appears on the New Item and Edit forms directly underneath the text box for the column.
•Whether you want to require that the column contain information: Required columns are designated by an asterisk on the New Item and Edit form. If a user skips a required column and tries to save and close the form, a message pops up that reads, “You must specific a nonblank value for [Column Name].”
•Whether you want the column added to the default view of the list: The default view of the list is the view that displays when you open the list. By default, this is set to All Items, but can be changed to any view (see more about creating views in the section “Creating a New View” later in this chapter).

62 CHAPTER 4 ■ CREATING SHAREPOINT VIEWS
Column Types
Each column type has additional optional settings based on the type you select. To understand each type and when you might use it, we review each of the types in the following sections.
Single Line of Text
Use the Single line of text option to enter alphanumeric characters in a text box. The default setting is 255 characters, but you can limit this to fewer characters or expand it to more. However, if you need more than that, you might want to look at the next option. You can also set a default value to save users from having to enter the most common entry. For example, say 90 percent of your employees live in Michigan. You could enter MI in the State column. Those from other states could overwrite the default value.
Multiple Lines of Text
With this column type, you can choose how many lines of text you want to display (5 is the default), but users can enter as much text as they want. You can also choose to allow rich HTML text, which means users can use formatting such as bold, italics, fonts, and so on.
Choice (Menu to Choose From)
You can use this choice to create a drop-down list, radio buttons, or in the case of multiple selections, checkboxes. Enter the choices you want to appear in the “Type each choice on a separate line” text box, as shown in Figure 4-2.

CHAPTER 4 ■ CREATING SHAREPOINT VIEWS |
63 |
Figure 4-2. To create choices for users to pick from, enter each choice on a separate line of the text box.
If you want users to be able to enter items not in the list, select Yes under “Allow ‘Fill-in’ choices.” The New Item and Edit forms allow users to enter a different choice, as shown here:
As soon as users select a value from the list, they cannot revert to a blank entry. If you want to allow this option, enter text such as “Select from list . . .” as the first choice. Users can always revert to that choice to indicate they haven’t made a selection.
For more information about the Choice column type, see the sidebar “Choice vs. Lookup.”

64 CHAPTER 4 ■ CREATING SHAREPOINT VIEWS
CHOICE VS. LOOKUP
Both the Choice and the Lookup column types allow users to select data from a drop-down list. Either option makes it easier for users to enter data, and gives you better control of your data and more consistency in the responses. What are the criteria for distinguishing which column type to use? Follow these guidelines.
Use Choice if
•the number of options is limited to less than ten. This is a good rule of thumb. You can list many more options than this, but you have to edit the column to modify the list.
•the list is relatively static; Gender, for example.
•you want to display radio buttons rather than a drop-down list.
•you want users to be able to select more than one option using checkboxes.
Use Lookup if
•the list is longer than ten items.
•new items are regularly added to the list.
•you want to be able to select from a list of site members. Rather than re-creating this list, you can create a lookup based on the site’s user information.
•you want the column to display presence information about site users. Presence information appears next to the column, and lets users know if this person is logged on to Microsoft Windows Messenger for online chats. The status is regularly updated each time the person logs in or out.
•the column is part of a larger list of data already maintained on the site or in an Excel spreadsheet (in the latter case, you have to import the spreadsheet before creating the lookup column).
After you’ve selected the Choice or Lookup column type, you cannot change to the other type without re-creating the column, so it’s useful to evaluate your current and future needs carefully before selecting either of these column types.
Number (1, 1.0, 100)
You can enter any integer in a column of this column type. You can specify a minimum and/or maximum allowed value in the Min and Max text boxes if you want to validate the column entry. You can also specify the number of decimals you want to display, from 0 to 5. Leave the default choice of Automatic if you want to display as many decimal places as are entered. Check the Show as percentage checkbox if you’d like the number shown with a percent sign.
CHAPTER 4 ■ CREATING SHAREPOINT VIEWS |
65 |
Currency ($, ¥, £)
Currency has the same options as Number, except that you can specify a currency format rather than showing the number as a percentage. Select the currency format from the drop-down list of more than 60 available formats.
Date and Time
Use a Date and Time column type for any date-related data. You can choose to display date only, or date and time. If you want to set a default value, you can choose Today’s Date, a specific date and time you enter, or a calculated date. For example, you can enter =Today+7 to enter a default of a week from the current date (see Chapter 5 for more about calculating dates).
Lookup (Information Already on This Site)
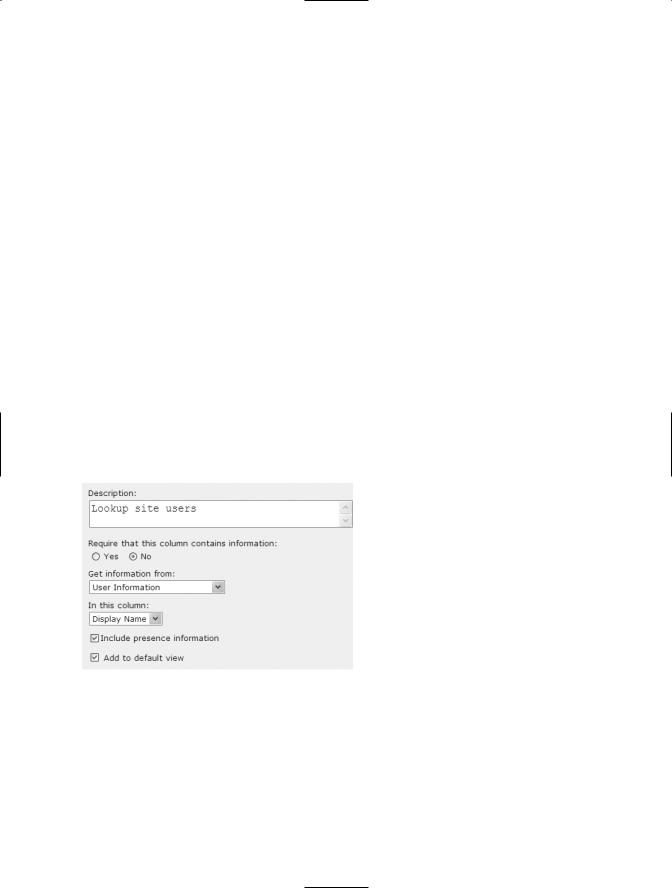
With the Lookup column type (see Figure 4-3), you can create a drop-down list that draws from a list already on the site. For example, you can create a lookup to display site members, and another one to display cities or countries. To use this column type, the list has to be present already on the site. If the list doesn’t exist, back up to create or import the list first, and then come back to create this column.
Figure 4-3. Use the options for Lookup to create a drop-down menu that contains data from another list on the site.
To select the list you want to use, click the down arrow on the “Get information from” drop-down list and select from the menu of lists on the site. Select User Information if you want to select from the site’s members. If you select this option, the Include presence information checkbox is selected by default. With this option selected, SharePoint monitors