

Beginning SharePoint With Excel - From Novice To Professional (2006)
.pdf136 C H A P T E R 7 ■ B U I L D I N G O U T- O F - T H E - B OX B U S I N E S S S O L U T I O N S
4.Click OK to return to the Modify Web Part task pane.
5.Change the Title to Tasks Due Today.
6.Click OK.
Similarly, modify the second Tasks web part to show Active Tasks. Choose the Active Tasks view, then edit the view to include the Est Compl column. However, you don’t need to include Status (the view is filtered for Status = Active). Name the web part Active Tasks.
Modify the third Tasks web part to show Completed Tasks. Choose the Active Tasks view (there is no Completed Tasks view), then edit the view to include the Date Compl column. Change the filter to Status = Complete. Name the web part Completed Tasks.
Finalizing and Launching the Site
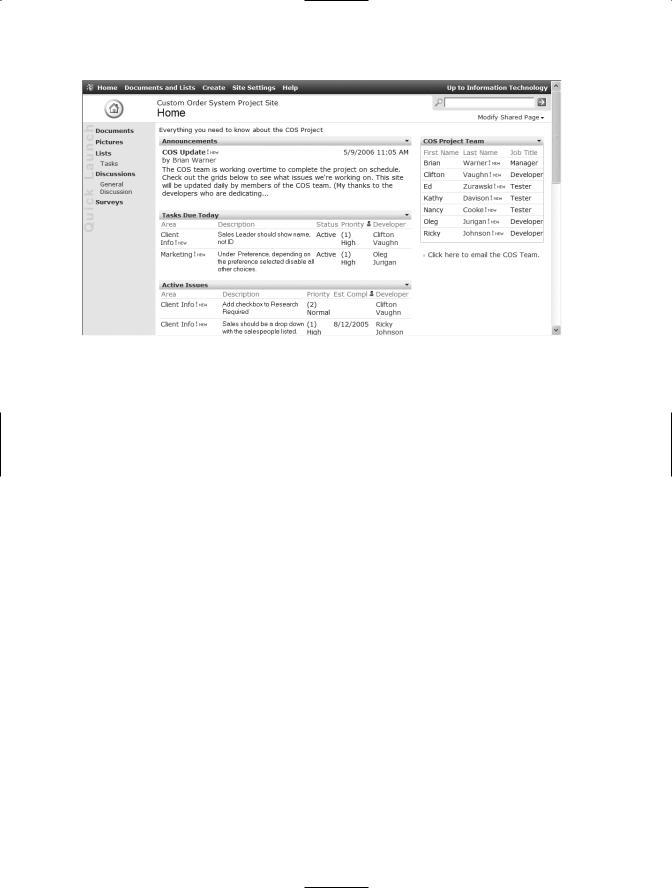
Two views are left to create for the Tasks list: Completed Issues and High Priority Issues. These views will be accessed from the Tasks list, not the home page. After creating the views, there are two more tasks to complete before launch: have Brian add an announcement about the purpose of the site, and add the stakeholders as read-only users. The completed SharePoint site shown in Figure 7-10 provides a complete issue tracking solution for Brian and the COS team.
C H A P T E R 7 ■ B U I L D I N G O U T- O F - T H E - B OX B U S I N E S S S O L U T I O N S |
137 |
Figure 7-10. The home page of the COS Issue Tracking SharePoint site
Extending the Solution
After we created the site, Brian reported that his team was using the site proficiently, and his e-mail volume had ramped way down. However, Brian was still receiving e-mails asking about the scheduling of issues. Specifically, managers wanted to know what tasks were scheduled to be completed in the next three days so they could ensure that subject matter experts would be available if the developers had last-minute questions. A Tasks in the Next Three Days view would lower anxiety.
This view requires two filter criteria. The estimated completion date, Est Compl, needs to be greater than or equal to today, and less than or equal to the date three days from now (today + 3). You can’t use [TODAY] in a filter calculation such as the following:
Est Compl <= [TODAY]+3
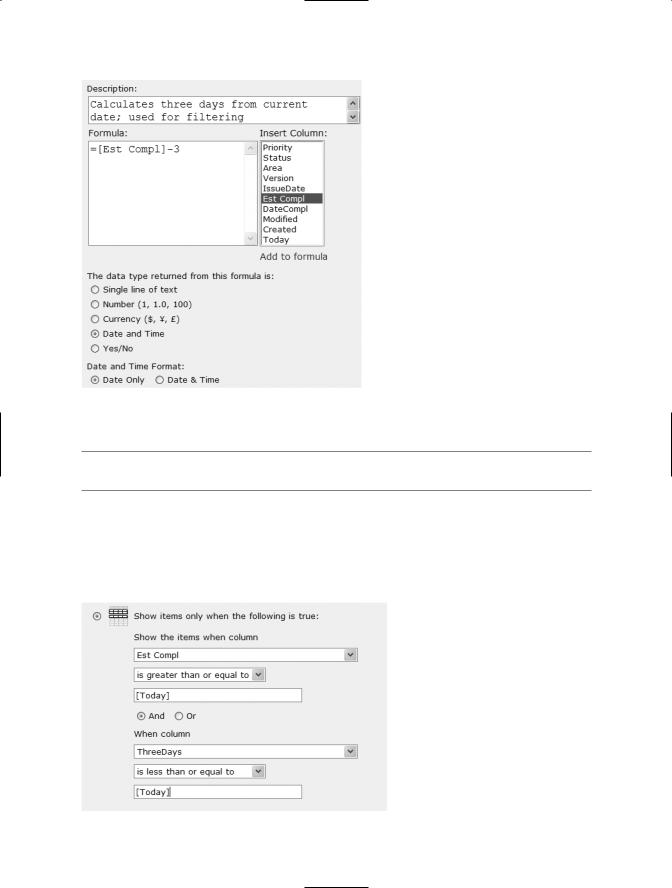
To create this view, you must first create a calculated column that subtracts three days from Est Compl. Figure 7-11 shows the formula and settings for the ThreeDays calculated column.
138 C H A P T E R 7 ■ B U I L D I N G O U T- O F - T H E - B OX B U S I N E S S S O L U T I O N S
Figure 7-11. Creating a column to calculate three days prior to the estimated completion date
■Note For more information on TODAY, see the section “Applying Date Functions” in Chapter 5.
Now you can create a filtered view with two criteria: is the estimated completion date on or after today? If so, is ThreeDays on or before today? Figure 7-12 shows the filter criteria for the NextThreeDays view, which will replace Today’s Tasks on the home page.
Figure 7-12. Using the ThreeDays calculation in a filter

C H A P T E R 7 ■ B U I L D I N G O U T- O F - T H E - B OX B U S I N E S S S O L U T I O N S |
139 |
The Issue Tracking site features a customized list (Tasks, in this example) maintained by an individual or a team, and a home page that provides other users with transparent access to the list. You could create similar sites for a wide variety of business uses, including the following:
•Help desk ticket resolution
•Maintenance requests
•Inventory; items on hand
•Expense reimbursement tracking
•Proposals to be reviewed by a team
•Order tracking
Wherever you find a team member or manager who spends way too much time answering questions from an Excel list, think SharePoint.
Business Solutions Using Charts and Tables
The Issue Tracking site is a decent reporting interface. Stakeholders can get the information they need by reviewing the Tasks list web parts. The next step in SharePoint reporting is a dashboard—a web page used to report summary information about one or more aspects of a business. Dashboards are used in every area of organizational life. In this solution, you’ll create a Sales Performance dashboard.
The Sales Performance Scenario
Kim works in sales analysis, summarizing information about sales performance by sales person, region, and product line. As in many organizations, the sales people that Kim supports earn a commission, and the commission is designed to provide incentives for meeting specific sales goals. For example, this year, all sales people are guaranteed a 3 percent commission on their sales. In every region that meets or exceed its goal, sales commissions will be increased from 3 percent to 5 percent: a 66 percent increase. The sales force has real skin in the game. Kim knows all the sales people; they call her frequently to inquire about the current totals for regional sales, national sales, and sales by category during special promotions.
Information about sales is entered in an Excel spreadsheet. The data includes the name of the client and the client’s current and expected orders. For some clients, there’s an agreement that only the client’s sales people will have access to their data, so sharing the workbook is not an option. Kim needs to control the workbook, and publish parts of
140 C H A P T E R 7 ■ B U I L D I N G O U T- O F - T H E - B OX B U S I N E S S S O L U T I O N S
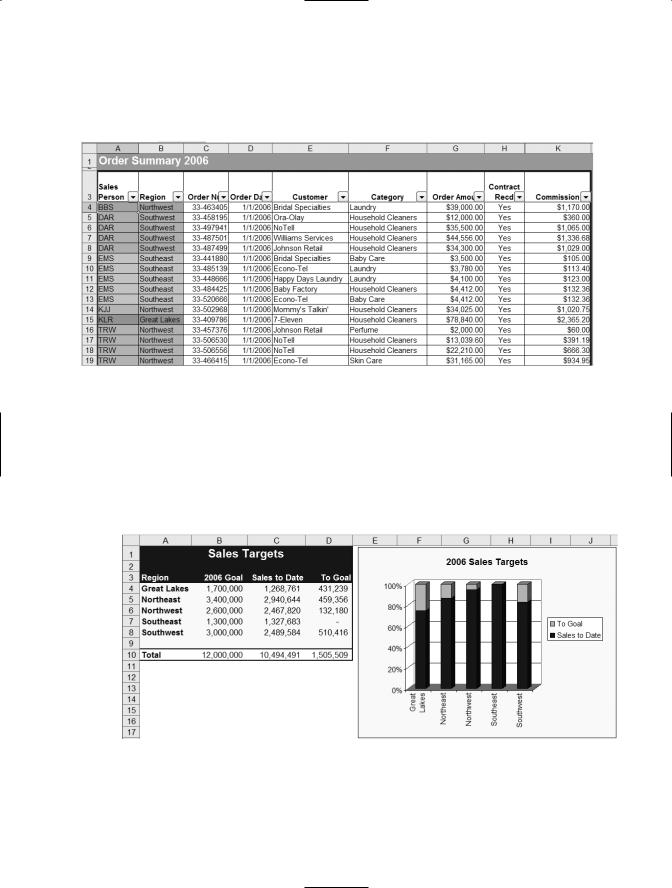
the workbook on a SharePoint site that provides the aggregate information that sales people require. Figure 7-13 shows the first few rows in the Excel worksheet.
Figure 7-13. The Excel worksheet currently used to track sales orders
The workbook includes a number of other worksheets that Kim uses for analysis. She’s most frequently asked about these three sheets:
•Sales Target: Sales goals for each of the five sales regions and a chart of current sales against the goals (see Figure 7-14).
Figure 7-14. The Sales Target worksheet includes a table and a chart
C H A P T E R 7 ■ B U I L D I N G O U T- O F - T H E - B OX B U S I N E S S S O L U T I O N S |
141 |
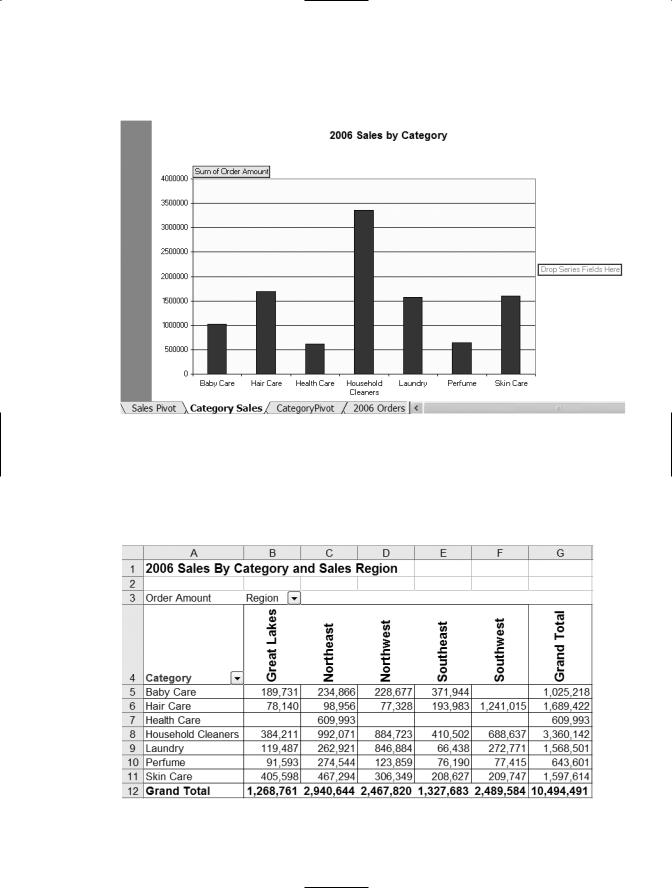
• Category Sales: PivotChart of sales by category (see Figure 7-15).
Figure 7-15. The Category Sales PivotChart report worksheet
•Sales Pivot: A pivot table showing sales by region and product category (see Figure 7-16).
Figure 7-16. The Sales Pivot worksheet’s pivot table shows sales by region and category.

142 C H A P T E R 7 ■ B U I L D I N G O U T- O F - T H E - B OX B U S I N E S S S O L U T I O N S
The tables and charts on these three worksheets are the objects you’ll publish and use to create the Sales Performance dashboard.
Building the SharePoint Sales Performance Dashboard
In this solution, you’ll publish the charts and tables from Kim’s Excel workbook to create HTML pages, then use the Page Viewer Web Part to display the pages on the sales team’s SharePoint site. Sales people already use the site, so Kim won’t have to do much marketing of the site to the sales group.
Here are the high-level activities required to build the Sales Performance dashboard:
1.Save the table on the Sales Target worksheet as a web page.
2.Save the chart on the Sales Target worksheet as a web page.
3.Save the PivotChart on the Category Sales worksheet as a web page.
4.Save the PivotTable on the Sales Pivot worksheet as a web page.
5.Create a web part page to display the Category Sales and Sales Pivot HTML pages using the Page Viewer Web Part.
6.Add descriptive text and a heading to the web part page with the Content Editor Web Part.
7.Add all four web pages to the sales teams’ SharePoint site using the Page Viewer Web Part.
8.Add a link to the web part page on the home page.
Saving the Selections as Web Pages
You could save the entire Sales Target worksheet as a web page, but the worksheet contains two different but related objects: a table and a chart (see Figure 7-14). The table is the most critical of the four web pages because it summarizes the information that’s most frequently requested. Publishing the table and the chart separately provides more layout flexibility when you add the web parts to the SharePoint site.
■Note Before you start saving web pages, create a SharePoint library called webpages to store the web pages. (This library shouldn’t be listed on the Quick Launch bar.) Also add the webpages library to My Network Places so you can save the web pages directly to the library.
C H A P T E R 7 ■ B U I L D I N G O U T- O F - T H E - B OX B U S I N E S S S O L U T I O N S |
143 |
To save the table as a web page, follow these steps:
1.Select the table, then choose File Save as Web Page from the menu to open the Save As dialog box.
2.Choose the Selection option to save only the selected table.
3.Enter a file name (SalesTargetsTable).
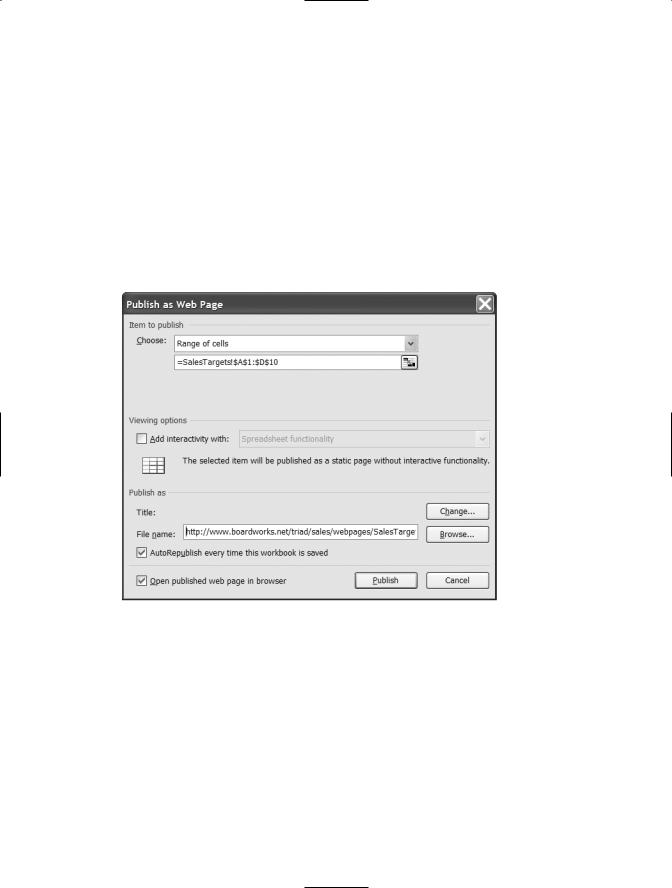
4.Click the Publish button to open the Publish as Web Page dialog box (see Figure 7-17).
Figure 7-17. Set publishing options in the Publish as Web Page dialog box.
144C H A P T E R 7 ■ B U I L D I N G O U T- O F - T H E - B OX B U S I N E S S S O L U T I O N S
5.Leave the Title blank. The Excel table already has a title.
6.Browse and select the webpages folder on the SharePoint site as the file location.
7.Enable the AutoRepublish every time this workbook is saved checkbox.
8.Leave the Open published web page in browser checkbox enabled.
9.Click the Publish button to publish and view the web page.
Follow the same steps to publish the chart, PivotChart, and PivotTable.
■Note See Chapter 6 for more information on publishing Excel objects and selections as web pages.
Tips for Publishing PivotTable and PivotChart Reports
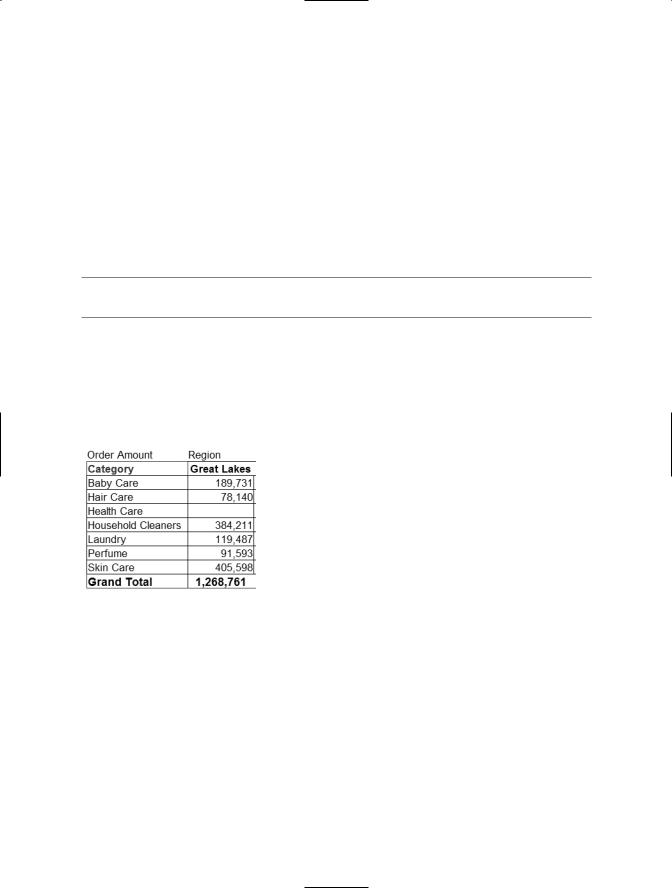
When you publish the PivotTable, the labels for the Order Amount and Region fields appear in the HTML file:
You can’t delete the Order Amount and Region labels; they’re part of the pivot table. You can, however, change the font color for these two cells to white. Save the workbook, and Excel will autorepublish the web page without the labels.
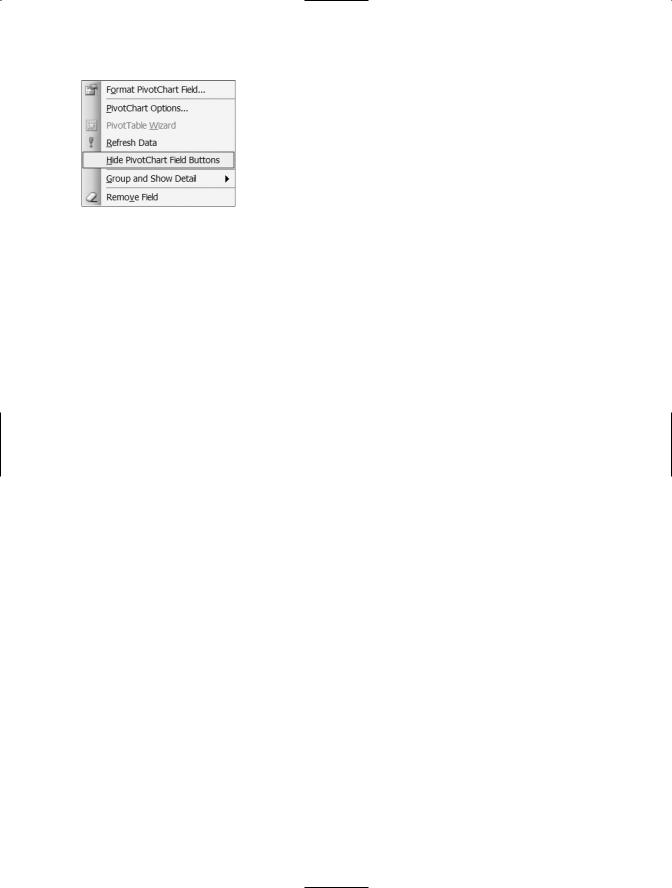
That trick won’t work with the PivotChart buttons. There’s a different and better way to hide the buttons and gain more territory for your chart. Right-click any of the PivotChart field buttons and choose Hide PivotChart Field Buttons from the context menu:
C H A P T E R 7 ■ B U I L D I N G O U T- O F - T H E - B OX B U S I N E S S S O L U T I O N S |
145 |
Charts that are located on their own chart sheets often present difficulties. The resulting HTML pages often are monster charts, over a thousand pixels wide, that are impossible to use (except, perhaps, as wallpaper). You can solve this problem by changing the chart’s location, making it an object on a worksheet. Insert a worksheet, then select the chart sheet and choose Chart Location from the menu. Choose the As object in option and select the new worksheet. You’ll need to spend a few minutes adjusting the chart size, font size, and plot area, but when you publish the chart object as a web page, you’ll have a usable chart.
Using the Page Viewer Web Part to Display the Charts and Tables
All four web pages are created. It’s time to display them on the SharePoint site. Put the Sales Target table and chart on the home page. The other two web parts will be displayed on the separate web part page.
1.Open the SharePoint site in your browser.
2.Choose Modify Shared Page Add Web Parts Browse to open the Add Web Parts task pane.
3.Drag a Page Viewer Web Part from the gallery and drop it in the larger zone on the page. Do it again so you have two Page Viewer Web Parts on the page.
4.Launch another instance of Internet Explorer. Navigate to the webpages folder on the SharePoint site.
5.Open the SalesTargetsTable.html web page. Copy the address for the page from the address bar.
6.Switch back to the browser window that’s displaying the home page of the SharePoint site.