

- •Table of Contents
- •Introduction
- •Saving Time with This Book
- •Foolish Assumptions
- •Part I: Making the Desktop Work for You
- •Part II: Getting the Most from Your File System
- •Part III: Good Housekeeping with Linux
- •Part IV: Tweaking the Kernel on Your Linux System
- •Part V: Securing Your Workspace
- •Part VI: Networking Like a Professional
- •Part VII: Monitoring Your System
- •Part VIII: Serving Up the Internet and More
- •Part X: Programming Tricks
- •Part XI: The Scary (Or Fun!) Stuff
- •Icons Used in This Book
- •Discovering Your Protocols
- •Managing Snapshots with the camera: Protocol
- •Remote File Management with fish:
- •Getting Help with help:, info:, and man:
- •Other KDE Protocols
- •Using GNOME VFS Modules
- •Stacking VFS Modules
- •Working with Packages: rpm and rpms
- •Putting VFS to Work at the Command Line
- •Burning CDs with a VFS
- •Skinning Your Desktop with VFS
- •Classifying Data with MIME
- •Creating KDE File Associations
- •Creating New MIME Types with GNOME
- •Making Basic Prompt Transformations
- •Adding Dynamically Updated Data to Your Prompt
- •Colorizing Your Prompt
- •Seeing a Red Alert When You Have Superuser Privileges
- •Saving Your Work
- •Completing Names Automatically
- •Using the Escape Key to Your Advantage
- •Customizing Completion for Maximum Speed
- •Using cd and ls to Navigate through bash
- •Setting Your CDPATH Variables to Find Directories Fast
- •Streamlining Archive Searches
- •Turning the Output of a Command into a Variable with $( )
- •Using $UID and $EUID in Shell Scripts
- •Customizing Variables for Rapid Transit
- •Finding the Right Shell Script
- •Choosing your victims
- •Timing is everything
- •Cleaning up made easy
- •Changing prototype scripts
- •Customizing Your Autostart File
- •Navigating the History List
- •Scrolling
- •Summoning a command by number
- •Searching through history
- •Customizing the History List
- •Adjusting key default settings
- •Filtering the history list
- •Executing Commands Quickly with History Variables
- •Viewing Your Aliases
- •Using Aliases for Complex Commands
- •Automating Tedious Tasks with Functions
- •Filtering file searches by file type
- •Automatic downloading
- •Monitoring Your System in a Snap
- •Un-tarring the Easy Way
- •What Is Samba?
- •Getting Up and Running with Samba
- •Checking whether Samba is installed
- •Enabling Samba
- •Adjusting the workgroup name and creating user accounts
- •Giving a Windows machine access to your home directory
- •Sharing Linux files and directories with other computers
- •Hooking Everyone Up to the Printer
- •Sharing Linux printers with SWAT
- •Using a Windows printer from Linux
- •Plugging In to Remote Data with Linux Programs Quickly
- •Finding Files with locate
- •Finding Files with find
- •Qualifying Your Search with the find Command
- •Doing updated filename searches
- •Adding time-based qualifications
- •Filtering by file size
- •Perusing commonly used qualifications
- •Acting on What You Find
- •Displaying specific info with -printf
- •Checking disk usage by user
- •Executing commands with find
- •Building Complex Commands with xargs
- •Creating Archives with File Roller
- •Inspecting and Extracting Archives with File Roller
- •Adding Functionality to tar with Complex Commands
- •Building archives from the command line
- •Archiving complex search results
- •Backing up an installed package
- •Uprooting Entire Directory Trees with scp
- •Splitting Big Files into Manageable Chunks
- •Building Software from Downloaded tarballs
- •Compiling a tarball: The basic steps
- •Downloading and compiling SuperKaramba
- •Versatile Downloading with wget
- •Mirroring sites with wget
- •Verifying your bookmarks with wget
- •Downloading files with wget
- •Downloading and unpacking in one quick step
- •Downloading and Uploading with curl
- •Setting Up ADIOS
- •Downloading ADIOS
- •Burning ADIOS to CD
- •Installing ADIOS
- •Finding Your Way around UML
- •Connecting to the Internet from an ADIOS VM
- •Using a GUI with UML
- •Installing Software into UML
- •Merging Changes to Your Prototype
- •Querying RPM Packages for Content
- •Digesting Information
- •Creating a Package Index
- •Querying for Prerequisites
- •Dissecting an RPM Package
- •Using RPM at the Command Line
- •Removing RPMs
- •Flagging Down RPM
- •Getting Graphic with RPM
- •Using Rpmdrake to install from media
- •Installing from your Konqueror browser
- •Verifying Your System
- •Reading the Tamper-Proof Seal
- •Setting Up Synaptic and apt in a Snap
- •Keeping Up-to-Date with apt and Synaptic: The Basics
- •Handy Hints about Synaptic
- •Changing repositories
- •Viewing package details
- •Installing new packages with Synaptic
- •Importing the Keys to the Repository
- •Letting Task Scheduler Work for You
- •Scheduling a new task
- •Editing a task
- •Adding environment variables
- •Reining In Resources with Disk Quotas
- •Installing the quota RPM package
- •Enabling file system quotas
- •Getting your files together
- •Setting quotas
- •Reviewing your quotas
- •Using System Accounting to Keep Track of Users
- •Setting up system accounting
- •Looking up user login hours
- •Checking out command and program usage
- •Running Down the Runlevels
- •Runlevel basics
- •Customizing runlevels in Fedora
- •Customizing runlevels in SuSE
- •Customizing runlevels in Mandrake
- •Customizing runlevels at the command line
- •Switching to a new runlevel
- •Disabling Unused Services
- •Removing Unneeded Services
- •Learning about modules
- •Installing a module with insmod
- •Taking care of dependencies automatically with modprobe and depmod
- •Loading a module for a slightly different kernel with insmod and modprobe
- •Removing modules with rmmod
- •Step 1: Making an Emergency Plan, or Boot Disk
- •Step 2: Finding the Source Code
- •Step 4: Customizing the Kernel
- •Step 5: Building the Kernel
- •Understanding the Principles of SELinux
- •Everything is an object
- •Identifying subjects in SELinux
- •Understanding the security context
- •Disabling or Disarming SELinux
- •Playing the Right Role
- •Exploring the Process-Related Entries in /proc
- •Surveying Your System from /proc
- •Popping the Cork: Speeding Up WINE with /proc
- •Reading and Understanding File Permissions
- •Controlling Permissions at the Command Line
- •Changing File Permissions from a Desktop
- •Encryption Made Easy with kgpg and the KDE Desktop
- •Creating keys with kgpg
- •Sharing your key with the world
- •Importing a public key from a public-key server
- •Encrypting and decrypting documents with drag-and-drop ease
- •Encrypting Documents with gpg at the Command Line
- •Sharing a secret file
- •Creating a key pair and receiving encrypted documents
- •Encrypting documents on your home system
- •Encrypting E-Mail for Added Security
- •Encrypting with Ximian Evolution
- •Setting up Mozilla e-mail for encryption
- •Sending and receiving encrypted messages with Mozilla mail
- •Using Cross-Platform Authentication with Linux and Windows
- •Prepping for cross-platform authentication
- •Setting up cross-platform authentication
- •Using PAM and Kerberos to Serve Up Authentication
- •Establishing synchronized system times
- •Testing your domain name server (DNS)
- •Setting up a Key Distribution Center
- •Setting up automatic ticket management with Kerberos and PAM
- •Adding users to the Key Distribution Center
- •Building Good Rules with PAM
- •Phase
- •Control level
- •Module pathname
- •Arguments
- •Dissecting a Configuration File
- •Skipping a Password with PAM
- •Feeling the Power
- •Gaining Superuser Privileges
- •Pretending to Be Other Users
- •Limiting Privileges with sudo
- •Installing sudo
- •Adding Up the Aliases
- •Adding Aliases to the sudo Configuration File
- •Defining the Alias
- •Creating a User_Alias
- •Creating a Runas_Alias
- •Simplifying group managment with a Host_Alias
- •Mounting and unmounting CDs without the superuser password
- •Managing access to dangerous commands with command aliases
- •Using SSH for Top-Speed Connections
- •Setting Up Public-Key Authentication to Secure SSH
- •Generating the key pair
- •Distributing your public key
- •Passing on your passphrase
- •Logging In with SSH and Key Authentication
- •Starting from the command line
- •Getting graphic
- •Creating Shortcuts to Your Favorite SSH Locations
- •Copying Files with scp
- •Secure (And Fast) Port Forwarding with SSH
- •Finding Your Firewall
- •Setting up a simple firewall in Mandrake Linux
- •Setting up a simple firewall in Fedora Linux
- •Setting up a simple firewall in SuSE Linux
- •Editing the Rules with Webmin
- •Starting a Webmin session
- •Reading the rules with Webmin
- •Changing the rules
- •Editing existing rules
- •Adding a new rule with Webmin
- •Sharing Desktops with VNC
- •Inviting Your Friends to Use Your Desktop
- •Serving Up a New Desktop with VNC Server
- •Using tsclient to View Remote Desktops from Linux
- •Using tsclient with a VNC server
- •Using tsclient with an RDP server
- •Creating New VNC Desktops on Demand
- •Switching display managers in SuSE Linux
- •Switching display managers in Mandrake Linux
- •Connecting gdm and VNC
- •Exploring Your Network with lsof
- •Running lsof
- •Interpreting the lsof output
- •Reading file types
- •Discovering Network Connections
- •Other Timesaving lsof Tricks
- •Packet Sniffing with the Ethereal Network Analyzer
- •Starting Ethereal
- •Capturing packets
- •Applying filters to screen packets
- •Peeking in packets
- •Color-coding packets coming from your network
- •Getting Up and Running with Nessus
- •Installing programs Nessus needs to run
- •Installing Nessus
- •Adding a user to Nessus
- •Generating a certificate
- •Starting the daemon and the interface
- •Reading the grim results
- •Keeping Your Plug-ins Up-to-Date
- •Chatting in the Fedora Chat Room
- •Looking for Answers in the SuSE Chat Room
- •Processing Processes with procps
- •Using ps to filter process status information
- •Viewing ps output the way you want to see it
- •Making parent-child relationships stand out in a ps listing
- •Climbing the family tree with pstree
- •Finding processes with pgrep
- •Killing Processes with pkill
- •Killing Processes with killall
- •Closing Windows with xkill
- •Managing Users and Groups with the Fedora/Mandrake User Manager
- •Adding new users
- •Modifying user accounts
- •Adding groups
- •Filtering users and groups
- •Managing Users and Groups with the SuSE User Administrator
- •Adding new users
- •Modifying user accounts
- •Adding groups
- •Filtering users and groups
- •Adding and deleting log files from the viewer
- •Setting up alerts and warnings
- •Viewing your log files from SuSE
- •Monitoring your log files from SuSE
- •Customizing Your Log Files
- •Keeping an Eye on Resources with KDE System Guard
- •Finding and killing runaway processes
- •Prioritizing processes to smooth a network bottleneck
- •Watching your system load
- •Creating a new worksheet
- •Creating system resource logs
- •Displaying network resources
- •Using Synaptic to download and install Apache
- •Installing Apache from disc
- •Starting the Apache Service
- •Building a Quick Web Page with OpenOffice.org
- •Taking Your Site Public with Dynamic DNS
- •Understanding how dynamic DNS works
- •Setting up dynamic DNS
- •Updating your IP address
- •Installing the Fedora HTTP Configuration tool
- •Putting the HTTP Configuration tool to work
- •Watching Your Web Server Traffic with apachetop
- •Installing apachetop
- •Running and exiting apachetop
- •Navigating apachetop
- •Switching among the log files (or watching several at once)
- •Changing the display time of apachetop statistics
- •Accessing MySQL Control Center features
- •Viewing, managing, and repairing a database with the Databases controls
- •Putting the Server Administration controls to work
- •Adding a new user
- •Watching Your MySQL Traffic with mtop
- •Gathering all the packages that mtop needs
- •Installing mtop
- •Monitoring traffic
- •Building a MySQL Server
- •Installing the necessary packages
- •Starting the MySQL server
- •Replicating MySQL Data
- •Configuring replication: The three topologies
- •Setting up replication for a single slave and master
- •Choosing a Method to Back Up MySQL Data
- •Backing Up and Restoring with mysqldump
- •mysqldump backup options
- •Backing up multiple databases
- •Compressing the archive
- •Restoring a mysqldump archive
- •Making a mysqlhotcopy of Your Database
- •Archiving a Replication Slave
- •Taking Care of Business with MySQL Administrator
- •Installing MySQL Administrator
- •Starting MySQL Administrator
- •Choosing an SSL Certificate
- •Creating a Certificate Signing Request
- •Creating a Signing Authority with openssl
- •Creating a certificate authority
- •Signing a CSR
- •Exploring Your Certificate Collection with Mozilla
- •Introducing hotway
- •Getting Started with hotway
- •Setting Up Evolution to Read HTTPMail Accounts with hotway
- •Ringing the Bells and Blowing the Whistles: Your Evolution Summary Page
- •Installing SpamAssassin
- •Installing from the distribution media
- •Installing from RPM downloads
- •Starting the service
- •Fine-Tuning SpamAssassin to Separate the Ham from the Spam
- •Customizing settings
- •Saving your settings
- •Adding a New Filter to Evolution
- •Serving Up a Big Bowl of the RulesDuJour
- •Registering Your Address
- •Taming a Sendmail Server
- •Tweaking Your Configuration Files with Webmin
- •Serving up mail for multiple domains
- •Relaying e-mail
- •Using aliases to simplify mail handling
- •Deciding What to Archive
- •Choosing Archive Media
- •Tape drives
- •Removable and external disk drives
- •Removable media
- •Optical media (CDs and DVDs)
- •Online storage
- •Choosing an Archive Scheme
- •Full backups
- •Differential backups
- •Incremental backups
- •Incremental versus differential backups
- •Choosing an Archive Program
- •Estimating Your Media Needs
- •Creating Data Archives with tar
- •Backing up files and directories
- •Backing up account information and passwords
- •Targeting bite-sized backups for speedier restores
- •Rolling whole file systems into a tarball
- •Starting an Incremental Backup Cycle
- •Restoring from Backup with tar
- •Backing Up to CD (Or DVD) with cdbackup
- •Creating the backup
- •Restoring from a CD or DVD backup
- •Restoring from a disc containing multiple archives
- •Combining the Power of tar with ssh for Quick Remote Backups
- •Testing the ssh connection to the remote host
- •Creating a tar archive over the ssh connection
- •Backing up to tape drives on remote machines
- •Backing Up to a Remote Computer with rdist and ssh
- •Testing the ssh connection to the remote host
- •Creating the distfile
- •Backing up
- •Getting Started with CVS
- •Checking whether CVS is installed
- •Discovering what to use CVS for
- •Creating a CVS Repository
- •Populating Your Repository with Files
- •Simplifying CVS with cervisia
- •Installing cervisia
- •Putting files in your sandbox
- •Adding more files to your repository
- •Committing your changes
- •Browsing your log files
- •Marking milestones with tags
- •Branching off with cervisia
- •Using the libcurl Library (C Programming)
- •Uploading a File with a Simple Program Using libcurl
- •Line 7: Defining functions and data types
- •Line 14: Calling the initialization function
- •Lines 18– 21: Defining the transfer
- •Line 23: Starting the transfer
- •Line 26: Finishing the upload
- •Installing the Ming Library
- •Building a Simple Flash Movie with Ming
- •Examining the program
- •Compiling the program
- •Running the program
- •Building Interactive Movies with Ming
- •Examining the program
- •Compiling the program
- •Running the program
- •Doing the curl E-shuffle with PHP
- •Combining PHP with curl and XML: An overview
- •Checking out the XML file
- •Downloading and displaying the XML file with a PHP script (and curl)
- •Sending E-Mail from PHP When Problems Occur
- •Debugging Perl Code with DDD
- •Installing and starting DDD
- •Examining the main window
- •Reviewing and stepping through source code
- •Making Stop Signs: Using Breakpoints to Watch Code
- •Setting a breakpoint
- •Modifying a breakpoint
- •Opening the data window
- •Adding a variable to the data window
- •Changing the display to a table
- •Using the Backtrace feature
- •Using the Help menu
- •Making Fedora Distribution CDs
- •Downloading the ISO images
- •Verifying the checksums
- •Burning an ISO File to Disc at the Command Line
- •Finding the identity of your drive
- •Running a test burn
- •Burning the distribution discs
- •Burning CDs without Making an ISO First
- •Finding setuid quickly and easily with kfind
- •Finding setuid and setgid programs at the command line
- •Deciding to Turn Off setuid or setgid
- •Changing the setuid or setgid Bit
- •Who Belongs in Jail?
- •Using UML to Jail Programs
- •Using lsof to Find Out Which Files Are Open
- •Debugging Your Environment with strace
- •Investigating Programs with ltrace
- •Handy strace and ltrace Options
- •Recording Program Errors with valgrind
- •Hardening Your Hat with Bastille
- •Downloading and installing Bastille and its dependencies
- •Welcome to the Bastille
- •Addressing file permission issues
- •Clamping down on SUID privileges
- •Moving on to account security
- •Making the boot process more secure
- •Securing connection broker
- •Limiting compiler access
- •Limiting access to hackers
- •Logging extra information
- •Keeping the daemons in check
- •Securing sendmail
- •Closing the gaps in Apache
- •Keeping temporary files safe
- •Building a better firewall
- •Port scanning with Bastille
- •Turning LIDS On and Off
- •Testing LIDS before Applying It to Your System
- •Controlling File Access with LIDS
- •Hiding Processes with LIDS
- •Running Down the Privilege List
- •Getting Graphical at the Command Line
- •Getting graphical in GNOME
- •Getting graphical with KDE
- •Staying desktop neutral
- •Index
Making Stop Signs: Using Breakpoints to Watch Code |
425 |
The source window shows you the source code for bbc.pl, and a big green arrow points to the first executable line of code in the program. The green arrow always points to the line of code that’s about to execute.
To step through the source code one line at a time, press F5 (or click the Step button on the pop-up menu). DDD then executes a single line of code in your Perl program and moves the green arrow to the next executable line of code.
Making Stop Signs: Using Breakpoints to Watch Code
When you debug your program, you can use breakpoints to stop the execution of the code at a given moment during the programs execution for a closer examination of the state of the program. This is, of course, assuming your program executes for long enough to reach the breakpoint.
Setting a breakpoint
In the source window, find some code that you want to watch and right-click in the blank area to the left of the code (in other words, right-click in the left margin). A pop-up menu appears showing the following options:
Set Breakpoint: Sets a permanent breakpoint at that line. The debugger will stop when your program reaches that statement.
Set Temporary Breakpoint: Sets a temporary breakpoint at that line. The debugger will stop when your program reaches that statement and then will delete the breakpoint.
Continue Until Here: Sets a temporary breakpoint and then immediately continues the program.
That last option (Set Execution Position) doesn’t work with Perl programs — sorry.
When you set a breakpoint, a little red stop sign appears to the left of the code.
Modifying a breakpoint
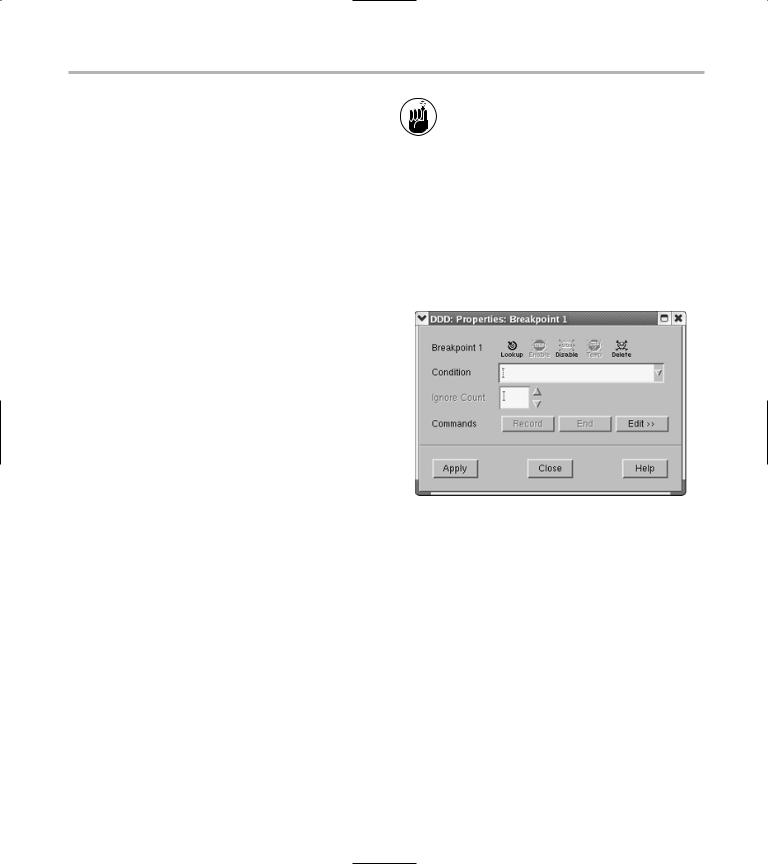
In the process of debugging your program, you may find you want to temporarily disable or completely remove a breakpoint. To modify a breakpoint, rightclick on a stop sign and choose Properties. The Properties: Breakpoint dialog opens (see Figure 55-3).
• Figure 55-3: The Properties: Breakpoint dialog.
From the Properties: Breakpoint dialog, you can enable, disable, or delete the breakpoint by clicking the appropriate button. You can also assign a condition to the breakpoint or associate commands with the breakpoint, as described next.
Assigning a condition to a breakpoint
You can assign a condition to the breakpoint to streamline its functionality. For example, if you want to break only when $headline is undefined, type the following command into the Condition field and then click Apply:
!defined( $headline )
Set Execution Position: Moves the point of execution (that is, the big green arrow) to the line you’re pointing at.
426 Technique 55: Using the DDD Graphical Debugger with Perl
You can build complex breakpoint conditions with the usual Perl and, or, and not operators.
Associating debugger commands with a breakpoint
You can associate debugger commands with a breakpoint to display variable values or display a stacktrace. Click the Edit button and then enter a list of commands for DDD to execute each time the breakpoint fires. When you assign a command to a breakpoint, you have to use commands supported by the Perl debugger (refer to Listing 55-1) and surround them with double quotes. For example, to print the value of the $headline variable when a breakpoint is hit, click Edit and type the following command into the box provided:
“x $headline”
Then click Apply or Close when you’re finished.
Tracking Variable Values
in the Data Window
The next example shows the functionality and timesaving values in DDD. This example takes a couple of steps to set up, but it’s worth the time.
The Perl script ./stock.pl is a stock value tracker. You need to install a few extra Perl programs before you can run stock.pl, but the MCPAN shell can handle that for you easily:
1. Open a terminal window and give yourself superuser privileges with the su - command. Enter the following command:
#perl -MCPAN -e “install Finance::Quote”
2. When the installation program asks if you would like it to satisfy the program dependencies, press Enter to answer yes.
MCPAN takes a few moments to download and install the stock.pl prerequisites.
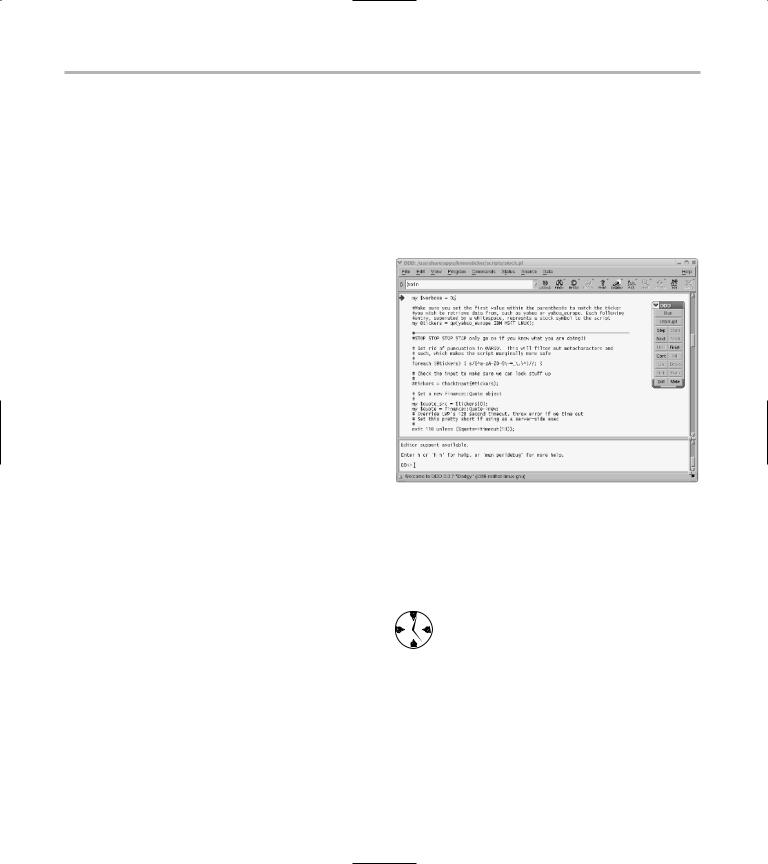
To start the DDD debugger and step through the stock.pl script, enter the following command:
# ddd --perl ./stock.pl
The DDD debugger opens, displaying the source code for stock.pl, as shown in Figure 55-4.
• Figure 55-4: DDD displaying the stock.pl script.
Opening the data window
To open the data window, choose View Data Window. The data window opens at the top of the display.
The data window makes quick work of keeping an eye on the value of variables as you step through a Perl script.
Adding a variable to the data window
To add a variable to the data window, right-click on the variable and choose Display Variable from the pop-up menu. The variable is added to the data window, with the current value displayed beneath the header.

Tracking Variable Values in the Data Window |
427 |
You can also add variable displays to the data window by entering commands in the Perl console. To add the fields to the data window as shown in Figure 55-5, use the following three commands:
graph display @tickers graph display %quotes
graph display $quote->{“TIMEOUT”}
• Figure 55-5: Variables and their values in the data window.
As you step through the code, the values of the variables change in the data window (see Figure 55-6).
Use the Step button to step into functions and subroutines. The Next button steps over the function (executing the function) but doesn’t display the activities within the function line-by-line.
When the code executes, the TIMEOUT variable is assigned a value, as shown in Figure 55-7.
• Figure 55-6: Timeout is currently undefined.
• Figure 55-7: Timeout now has a value of 10.
Changing the display to a table
If the data displayed is hard to read in a row format, you can change the display to a table. Right-click on the header for the data display and choose Rotate from the pop-up menu to change the orientation of the data display.
428 Technique 55: Using the DDD Graphical Debugger with Perl
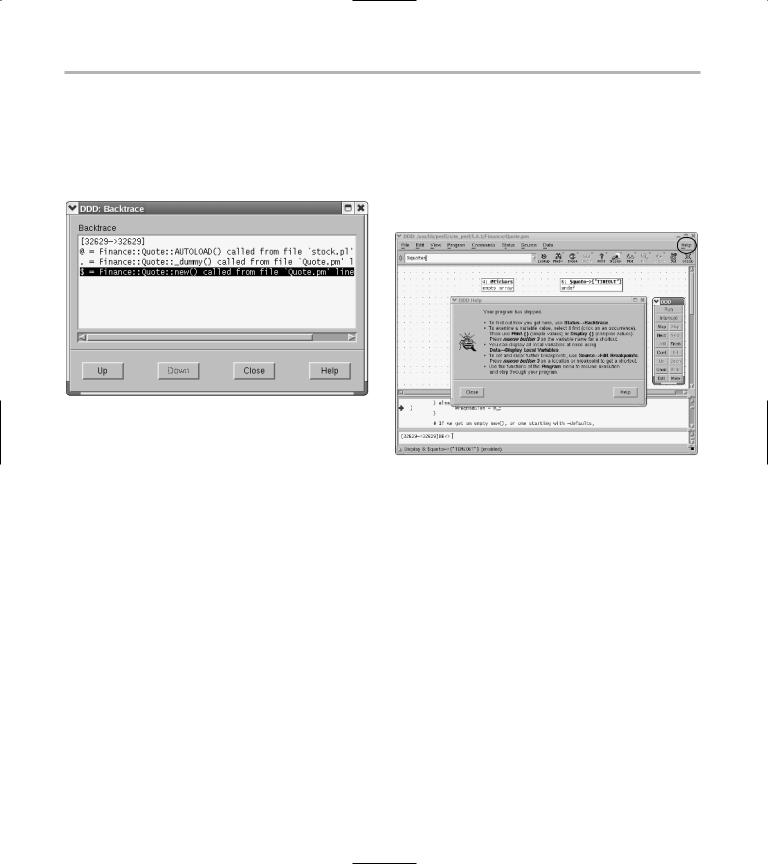
Using the Backtrace feature
The Backtrace feature makes it easy to find the current point of execution when debugging nested subroutines. Choose Status Backtrace to open the Backtrace dialog, shown in Figure 55-8.
Using the Help menu
Click the Help button in the upper-right corner to open a drop-down menu of help options. One noteworthy option on the Help menu is What Now. Click the What Now option to open a handy dialog with suggestions of how you might want to proceed, as shown in Figure 55-9.
• Figure 55-8: The Backtrace dialog.
With a quick glance of the Backtrace dialog, you can
see the contents of your current call stack.
• Figure 55-9: What Now?
The DDD Reference menu choice on the Help menu opens the DDD documentation. This is a quick way to get up to speed on using the DDD debugger with Perl.
Part XI
The Scary (Or Fun!) Stuff


56 Burning CD-Rs
without Getting
Technique Burned
Save Time By
Making your own distribution CDs
Writing CDs or DVDs without creating ISO images first
Creating ISO-formatted images when you need to
This technique is all about writing CDs and DVDs. Burning your own CDs is a quick and easy way to keep the information you use over and over again at your fingertips. Keep backups of your public/
private key pairs, downloaded RPM packages, and data files on CD to save time and money. CDs are small, inexpensive, portable, and easy to create, and with a little care, they last practically forever.
Burning a DVD is just like burning a CD, except that DVDs hold a lot more data and you need a DVD burner to do it. In this technique, if you see a reference to burning a CD, you can safely assume that the technique also works for a DVD.
As we mention throughout this book, one timesaving set of CDs you’ll want to make is a copy of your distribution discs. In this technique, we walk you through making a set of Fedora distribution media from downloaded disc images by using cdrecord at the command line. The same technique applies to any version of Linux distributed with ISO images — just burn each ISO image to a separate CD.
You can find a ton of open-source software on the Web, free for downloading. If you find a package you like, keep an installable copy of the RPM package on CD because open-source projects are known to come and go. Even if worldwide enthusiasm for the software you like disappears, you’ll still have a copy on CD.
You can save time by writing backup files to CD without making an ISO disc image first, but if you want to write CDs to save RPMs for later use, saving them in ISO image format is much more convenient. You can mount an ISO-formatted disc and explore the contents without using custom software. The ISO file system is an industry standard, so if you want to share programs with a friend, save them on an ISO-formatted disc, which your friend’s machine will have a better chance of understanding. In this technique, we show you how to create discs with or without ISO formatting.