

- •Table of Contents
- •Introduction
- •Saving Time with This Book
- •Foolish Assumptions
- •Part I: Making the Desktop Work for You
- •Part II: Getting the Most from Your File System
- •Part III: Good Housekeeping with Linux
- •Part IV: Tweaking the Kernel on Your Linux System
- •Part V: Securing Your Workspace
- •Part VI: Networking Like a Professional
- •Part VII: Monitoring Your System
- •Part VIII: Serving Up the Internet and More
- •Part X: Programming Tricks
- •Part XI: The Scary (Or Fun!) Stuff
- •Icons Used in This Book
- •Discovering Your Protocols
- •Managing Snapshots with the camera: Protocol
- •Remote File Management with fish:
- •Getting Help with help:, info:, and man:
- •Other KDE Protocols
- •Using GNOME VFS Modules
- •Stacking VFS Modules
- •Working with Packages: rpm and rpms
- •Putting VFS to Work at the Command Line
- •Burning CDs with a VFS
- •Skinning Your Desktop with VFS
- •Classifying Data with MIME
- •Creating KDE File Associations
- •Creating New MIME Types with GNOME
- •Making Basic Prompt Transformations
- •Adding Dynamically Updated Data to Your Prompt
- •Colorizing Your Prompt
- •Seeing a Red Alert When You Have Superuser Privileges
- •Saving Your Work
- •Completing Names Automatically
- •Using the Escape Key to Your Advantage
- •Customizing Completion for Maximum Speed
- •Using cd and ls to Navigate through bash
- •Setting Your CDPATH Variables to Find Directories Fast
- •Streamlining Archive Searches
- •Turning the Output of a Command into a Variable with $( )
- •Using $UID and $EUID in Shell Scripts
- •Customizing Variables for Rapid Transit
- •Finding the Right Shell Script
- •Choosing your victims
- •Timing is everything
- •Cleaning up made easy
- •Changing prototype scripts
- •Customizing Your Autostart File
- •Navigating the History List
- •Scrolling
- •Summoning a command by number
- •Searching through history
- •Customizing the History List
- •Adjusting key default settings
- •Filtering the history list
- •Executing Commands Quickly with History Variables
- •Viewing Your Aliases
- •Using Aliases for Complex Commands
- •Automating Tedious Tasks with Functions
- •Filtering file searches by file type
- •Automatic downloading
- •Monitoring Your System in a Snap
- •Un-tarring the Easy Way
- •What Is Samba?
- •Getting Up and Running with Samba
- •Checking whether Samba is installed
- •Enabling Samba
- •Adjusting the workgroup name and creating user accounts
- •Giving a Windows machine access to your home directory
- •Sharing Linux files and directories with other computers
- •Hooking Everyone Up to the Printer
- •Sharing Linux printers with SWAT
- •Using a Windows printer from Linux
- •Plugging In to Remote Data with Linux Programs Quickly
- •Finding Files with locate
- •Finding Files with find
- •Qualifying Your Search with the find Command
- •Doing updated filename searches
- •Adding time-based qualifications
- •Filtering by file size
- •Perusing commonly used qualifications
- •Acting on What You Find
- •Displaying specific info with -printf
- •Checking disk usage by user
- •Executing commands with find
- •Building Complex Commands with xargs
- •Creating Archives with File Roller
- •Inspecting and Extracting Archives with File Roller
- •Adding Functionality to tar with Complex Commands
- •Building archives from the command line
- •Archiving complex search results
- •Backing up an installed package
- •Uprooting Entire Directory Trees with scp
- •Splitting Big Files into Manageable Chunks
- •Building Software from Downloaded tarballs
- •Compiling a tarball: The basic steps
- •Downloading and compiling SuperKaramba
- •Versatile Downloading with wget
- •Mirroring sites with wget
- •Verifying your bookmarks with wget
- •Downloading files with wget
- •Downloading and unpacking in one quick step
- •Downloading and Uploading with curl
- •Setting Up ADIOS
- •Downloading ADIOS
- •Burning ADIOS to CD
- •Installing ADIOS
- •Finding Your Way around UML
- •Connecting to the Internet from an ADIOS VM
- •Using a GUI with UML
- •Installing Software into UML
- •Merging Changes to Your Prototype
- •Querying RPM Packages for Content
- •Digesting Information
- •Creating a Package Index
- •Querying for Prerequisites
- •Dissecting an RPM Package
- •Using RPM at the Command Line
- •Removing RPMs
- •Flagging Down RPM
- •Getting Graphic with RPM
- •Using Rpmdrake to install from media
- •Installing from your Konqueror browser
- •Verifying Your System
- •Reading the Tamper-Proof Seal
- •Setting Up Synaptic and apt in a Snap
- •Keeping Up-to-Date with apt and Synaptic: The Basics
- •Handy Hints about Synaptic
- •Changing repositories
- •Viewing package details
- •Installing new packages with Synaptic
- •Importing the Keys to the Repository
- •Letting Task Scheduler Work for You
- •Scheduling a new task
- •Editing a task
- •Adding environment variables
- •Reining In Resources with Disk Quotas
- •Installing the quota RPM package
- •Enabling file system quotas
- •Getting your files together
- •Setting quotas
- •Reviewing your quotas
- •Using System Accounting to Keep Track of Users
- •Setting up system accounting
- •Looking up user login hours
- •Checking out command and program usage
- •Running Down the Runlevels
- •Runlevel basics
- •Customizing runlevels in Fedora
- •Customizing runlevels in SuSE
- •Customizing runlevels in Mandrake
- •Customizing runlevels at the command line
- •Switching to a new runlevel
- •Disabling Unused Services
- •Removing Unneeded Services
- •Learning about modules
- •Installing a module with insmod
- •Taking care of dependencies automatically with modprobe and depmod
- •Loading a module for a slightly different kernel with insmod and modprobe
- •Removing modules with rmmod
- •Step 1: Making an Emergency Plan, or Boot Disk
- •Step 2: Finding the Source Code
- •Step 4: Customizing the Kernel
- •Step 5: Building the Kernel
- •Understanding the Principles of SELinux
- •Everything is an object
- •Identifying subjects in SELinux
- •Understanding the security context
- •Disabling or Disarming SELinux
- •Playing the Right Role
- •Exploring the Process-Related Entries in /proc
- •Surveying Your System from /proc
- •Popping the Cork: Speeding Up WINE with /proc
- •Reading and Understanding File Permissions
- •Controlling Permissions at the Command Line
- •Changing File Permissions from a Desktop
- •Encryption Made Easy with kgpg and the KDE Desktop
- •Creating keys with kgpg
- •Sharing your key with the world
- •Importing a public key from a public-key server
- •Encrypting and decrypting documents with drag-and-drop ease
- •Encrypting Documents with gpg at the Command Line
- •Sharing a secret file
- •Creating a key pair and receiving encrypted documents
- •Encrypting documents on your home system
- •Encrypting E-Mail for Added Security
- •Encrypting with Ximian Evolution
- •Setting up Mozilla e-mail for encryption
- •Sending and receiving encrypted messages with Mozilla mail
- •Using Cross-Platform Authentication with Linux and Windows
- •Prepping for cross-platform authentication
- •Setting up cross-platform authentication
- •Using PAM and Kerberos to Serve Up Authentication
- •Establishing synchronized system times
- •Testing your domain name server (DNS)
- •Setting up a Key Distribution Center
- •Setting up automatic ticket management with Kerberos and PAM
- •Adding users to the Key Distribution Center
- •Building Good Rules with PAM
- •Phase
- •Control level
- •Module pathname
- •Arguments
- •Dissecting a Configuration File
- •Skipping a Password with PAM
- •Feeling the Power
- •Gaining Superuser Privileges
- •Pretending to Be Other Users
- •Limiting Privileges with sudo
- •Installing sudo
- •Adding Up the Aliases
- •Adding Aliases to the sudo Configuration File
- •Defining the Alias
- •Creating a User_Alias
- •Creating a Runas_Alias
- •Simplifying group managment with a Host_Alias
- •Mounting and unmounting CDs without the superuser password
- •Managing access to dangerous commands with command aliases
- •Using SSH for Top-Speed Connections
- •Setting Up Public-Key Authentication to Secure SSH
- •Generating the key pair
- •Distributing your public key
- •Passing on your passphrase
- •Logging In with SSH and Key Authentication
- •Starting from the command line
- •Getting graphic
- •Creating Shortcuts to Your Favorite SSH Locations
- •Copying Files with scp
- •Secure (And Fast) Port Forwarding with SSH
- •Finding Your Firewall
- •Setting up a simple firewall in Mandrake Linux
- •Setting up a simple firewall in Fedora Linux
- •Setting up a simple firewall in SuSE Linux
- •Editing the Rules with Webmin
- •Starting a Webmin session
- •Reading the rules with Webmin
- •Changing the rules
- •Editing existing rules
- •Adding a new rule with Webmin
- •Sharing Desktops with VNC
- •Inviting Your Friends to Use Your Desktop
- •Serving Up a New Desktop with VNC Server
- •Using tsclient to View Remote Desktops from Linux
- •Using tsclient with a VNC server
- •Using tsclient with an RDP server
- •Creating New VNC Desktops on Demand
- •Switching display managers in SuSE Linux
- •Switching display managers in Mandrake Linux
- •Connecting gdm and VNC
- •Exploring Your Network with lsof
- •Running lsof
- •Interpreting the lsof output
- •Reading file types
- •Discovering Network Connections
- •Other Timesaving lsof Tricks
- •Packet Sniffing with the Ethereal Network Analyzer
- •Starting Ethereal
- •Capturing packets
- •Applying filters to screen packets
- •Peeking in packets
- •Color-coding packets coming from your network
- •Getting Up and Running with Nessus
- •Installing programs Nessus needs to run
- •Installing Nessus
- •Adding a user to Nessus
- •Generating a certificate
- •Starting the daemon and the interface
- •Reading the grim results
- •Keeping Your Plug-ins Up-to-Date
- •Chatting in the Fedora Chat Room
- •Looking for Answers in the SuSE Chat Room
- •Processing Processes with procps
- •Using ps to filter process status information
- •Viewing ps output the way you want to see it
- •Making parent-child relationships stand out in a ps listing
- •Climbing the family tree with pstree
- •Finding processes with pgrep
- •Killing Processes with pkill
- •Killing Processes with killall
- •Closing Windows with xkill
- •Managing Users and Groups with the Fedora/Mandrake User Manager
- •Adding new users
- •Modifying user accounts
- •Adding groups
- •Filtering users and groups
- •Managing Users and Groups with the SuSE User Administrator
- •Adding new users
- •Modifying user accounts
- •Adding groups
- •Filtering users and groups
- •Adding and deleting log files from the viewer
- •Setting up alerts and warnings
- •Viewing your log files from SuSE
- •Monitoring your log files from SuSE
- •Customizing Your Log Files
- •Keeping an Eye on Resources with KDE System Guard
- •Finding and killing runaway processes
- •Prioritizing processes to smooth a network bottleneck
- •Watching your system load
- •Creating a new worksheet
- •Creating system resource logs
- •Displaying network resources
- •Using Synaptic to download and install Apache
- •Installing Apache from disc
- •Starting the Apache Service
- •Building a Quick Web Page with OpenOffice.org
- •Taking Your Site Public with Dynamic DNS
- •Understanding how dynamic DNS works
- •Setting up dynamic DNS
- •Updating your IP address
- •Installing the Fedora HTTP Configuration tool
- •Putting the HTTP Configuration tool to work
- •Watching Your Web Server Traffic with apachetop
- •Installing apachetop
- •Running and exiting apachetop
- •Navigating apachetop
- •Switching among the log files (or watching several at once)
- •Changing the display time of apachetop statistics
- •Accessing MySQL Control Center features
- •Viewing, managing, and repairing a database with the Databases controls
- •Putting the Server Administration controls to work
- •Adding a new user
- •Watching Your MySQL Traffic with mtop
- •Gathering all the packages that mtop needs
- •Installing mtop
- •Monitoring traffic
- •Building a MySQL Server
- •Installing the necessary packages
- •Starting the MySQL server
- •Replicating MySQL Data
- •Configuring replication: The three topologies
- •Setting up replication for a single slave and master
- •Choosing a Method to Back Up MySQL Data
- •Backing Up and Restoring with mysqldump
- •mysqldump backup options
- •Backing up multiple databases
- •Compressing the archive
- •Restoring a mysqldump archive
- •Making a mysqlhotcopy of Your Database
- •Archiving a Replication Slave
- •Taking Care of Business with MySQL Administrator
- •Installing MySQL Administrator
- •Starting MySQL Administrator
- •Choosing an SSL Certificate
- •Creating a Certificate Signing Request
- •Creating a Signing Authority with openssl
- •Creating a certificate authority
- •Signing a CSR
- •Exploring Your Certificate Collection with Mozilla
- •Introducing hotway
- •Getting Started with hotway
- •Setting Up Evolution to Read HTTPMail Accounts with hotway
- •Ringing the Bells and Blowing the Whistles: Your Evolution Summary Page
- •Installing SpamAssassin
- •Installing from the distribution media
- •Installing from RPM downloads
- •Starting the service
- •Fine-Tuning SpamAssassin to Separate the Ham from the Spam
- •Customizing settings
- •Saving your settings
- •Adding a New Filter to Evolution
- •Serving Up a Big Bowl of the RulesDuJour
- •Registering Your Address
- •Taming a Sendmail Server
- •Tweaking Your Configuration Files with Webmin
- •Serving up mail for multiple domains
- •Relaying e-mail
- •Using aliases to simplify mail handling
- •Deciding What to Archive
- •Choosing Archive Media
- •Tape drives
- •Removable and external disk drives
- •Removable media
- •Optical media (CDs and DVDs)
- •Online storage
- •Choosing an Archive Scheme
- •Full backups
- •Differential backups
- •Incremental backups
- •Incremental versus differential backups
- •Choosing an Archive Program
- •Estimating Your Media Needs
- •Creating Data Archives with tar
- •Backing up files and directories
- •Backing up account information and passwords
- •Targeting bite-sized backups for speedier restores
- •Rolling whole file systems into a tarball
- •Starting an Incremental Backup Cycle
- •Restoring from Backup with tar
- •Backing Up to CD (Or DVD) with cdbackup
- •Creating the backup
- •Restoring from a CD or DVD backup
- •Restoring from a disc containing multiple archives
- •Combining the Power of tar with ssh for Quick Remote Backups
- •Testing the ssh connection to the remote host
- •Creating a tar archive over the ssh connection
- •Backing up to tape drives on remote machines
- •Backing Up to a Remote Computer with rdist and ssh
- •Testing the ssh connection to the remote host
- •Creating the distfile
- •Backing up
- •Getting Started with CVS
- •Checking whether CVS is installed
- •Discovering what to use CVS for
- •Creating a CVS Repository
- •Populating Your Repository with Files
- •Simplifying CVS with cervisia
- •Installing cervisia
- •Putting files in your sandbox
- •Adding more files to your repository
- •Committing your changes
- •Browsing your log files
- •Marking milestones with tags
- •Branching off with cervisia
- •Using the libcurl Library (C Programming)
- •Uploading a File with a Simple Program Using libcurl
- •Line 7: Defining functions and data types
- •Line 14: Calling the initialization function
- •Lines 18– 21: Defining the transfer
- •Line 23: Starting the transfer
- •Line 26: Finishing the upload
- •Installing the Ming Library
- •Building a Simple Flash Movie with Ming
- •Examining the program
- •Compiling the program
- •Running the program
- •Building Interactive Movies with Ming
- •Examining the program
- •Compiling the program
- •Running the program
- •Doing the curl E-shuffle with PHP
- •Combining PHP with curl and XML: An overview
- •Checking out the XML file
- •Downloading and displaying the XML file with a PHP script (and curl)
- •Sending E-Mail from PHP When Problems Occur
- •Debugging Perl Code with DDD
- •Installing and starting DDD
- •Examining the main window
- •Reviewing and stepping through source code
- •Making Stop Signs: Using Breakpoints to Watch Code
- •Setting a breakpoint
- •Modifying a breakpoint
- •Opening the data window
- •Adding a variable to the data window
- •Changing the display to a table
- •Using the Backtrace feature
- •Using the Help menu
- •Making Fedora Distribution CDs
- •Downloading the ISO images
- •Verifying the checksums
- •Burning an ISO File to Disc at the Command Line
- •Finding the identity of your drive
- •Running a test burn
- •Burning the distribution discs
- •Burning CDs without Making an ISO First
- •Finding setuid quickly and easily with kfind
- •Finding setuid and setgid programs at the command line
- •Deciding to Turn Off setuid or setgid
- •Changing the setuid or setgid Bit
- •Who Belongs in Jail?
- •Using UML to Jail Programs
- •Using lsof to Find Out Which Files Are Open
- •Debugging Your Environment with strace
- •Investigating Programs with ltrace
- •Handy strace and ltrace Options
- •Recording Program Errors with valgrind
- •Hardening Your Hat with Bastille
- •Downloading and installing Bastille and its dependencies
- •Welcome to the Bastille
- •Addressing file permission issues
- •Clamping down on SUID privileges
- •Moving on to account security
- •Making the boot process more secure
- •Securing connection broker
- •Limiting compiler access
- •Limiting access to hackers
- •Logging extra information
- •Keeping the daemons in check
- •Securing sendmail
- •Closing the gaps in Apache
- •Keeping temporary files safe
- •Building a better firewall
- •Port scanning with Bastille
- •Turning LIDS On and Off
- •Testing LIDS before Applying It to Your System
- •Controlling File Access with LIDS
- •Hiding Processes with LIDS
- •Running Down the Privilege List
- •Getting Graphical at the Command Line
- •Getting graphical in GNOME
- •Getting graphical with KDE
- •Staying desktop neutral
- •Index
318 Technique 43: Keeping an Eye on Your Servers
Watching Your Web Server Traffic with apachetop
apachetop is a real-time monitor for the Apache Web server. It’s an open-source project, readily available on the Web. Installation is quick, and it’s an easy program to use.
With apachetop, you can see the host machine that your visitors are using, determine whether they came by way of a search engine, and find out what pages they visited while they were there.
You can also use apachetop to see if your visitors are repeatedly asking for documents that don’t exist. You may want to rename your Web pages if the same page name is mistyped over and over.
8.
9.
This command tells apachetop where to find the Apache log file. (The Apache server distributed with Fedora writes log files in an unusual location, so you have to tell apachetop how to find them.)
configure checks out your system, looking for the compilers and libraries it needs to properly build a working program.
Compile the program with the following command:
# make
Then copy the file into a useful place with this command:
# make install
With apachetop installed, you’re ready to run the program and start putting it to use. See the following sections for details.
Installing apachetop
To download and install apachetop, follow these steps:
1. Open a browser window and surf to
clueful.shagged.org/apachetop
2. Click the link to download the latest stable release. As of this writing, it’s
apachetop-0.11.tar.gz
3. When the Download Manager opens, save the download to your home directory.
4. Open a terminal window and give yourself superuser privileges with the su command.
5. Unpack the tarball with this command:
#tar -zxvf apachetop-0.11.tar.gz
6.Move to the apachetop directory:
#cd apachetop-0.11
7.Configure the package with the following command:
#./configure --with-logfile=/etc/ httpd/logs/access_log
Running and exiting apachetop
To run apachetop, move to the /usr/local/sbin directory and enter the following command:
# ./apachetop
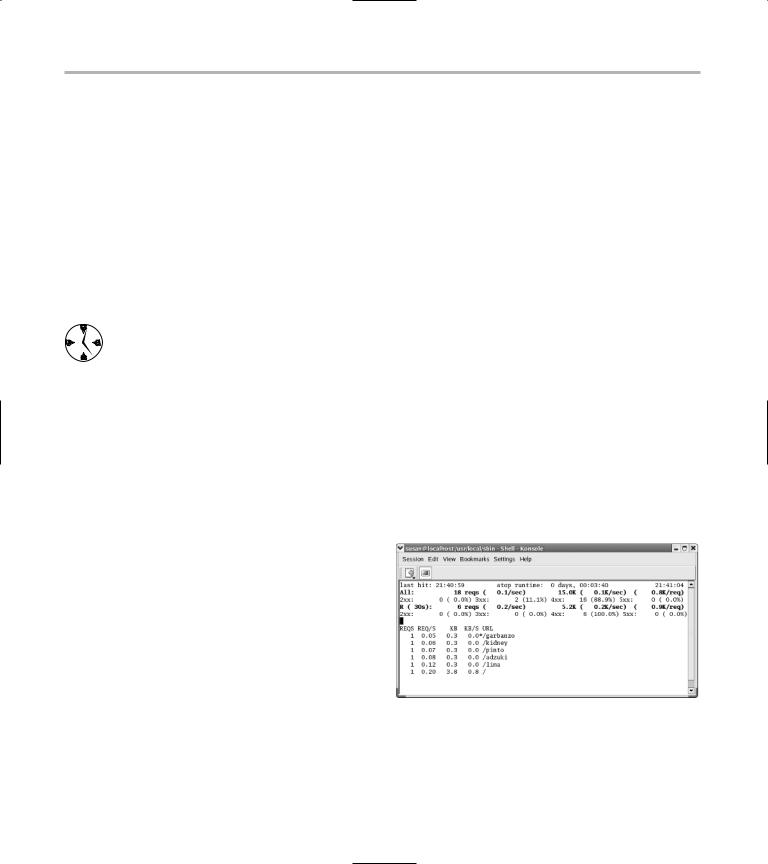
apachetop opens, displaying a status window that shows your server activity (see Figure 43-1).
• Figure 43-1: apachetop in action.
When you’re done using apachetop, just type q to quit, and apachetop returns you to the command line.

Watching Your Web Server Traffic with apachetop 319
Navigating apachetop
The top portion of the apachetop display (refer to Figure 43-1) shows the statistics for the server. The lower portion of the display lists information about specific HTTP requests. Here are some navigation tricks that help you find your way around apachetop:
Use the upand down-arrow keys to move the selection asterisk through the list of specific requests.
For more information about a specific request, move the cursor to the request line and press the right-arrow key. The request screen now includes the host and referrer IP addresses for the visitor, as shown in Figure 43-2.
• Figure 43-2: Extended information about who’s visiting your server.
To customize the information displayed about a specific request from a user visiting your Apache server, type t to view the Toggle Subdisplay menu. From here, type
u to exclude URL information
r to exclude or include referrer information
h to exclude or include host information
When you’re finished looking at detailed information about a specific request, use the left-arrow key to return to the request list.
You can sort the information in the request list by typing s to access the Sort By menu. From this menu, you can choose from
r to sort by the number of requests made
R to sort by the number of requests per second
b to sort by the size of the request in bytes
B to sort by the number of bytes per second transferred
Enter #apachetop -h at the command line (or type ? while apachetop is running) to see online help.
Switching among the log files (or watching several at once)
By default, Apache records activity in five different log files, which you can find in the /etc/httpd/logs directory:
access_log
error_log
ssl_access_log
ssl_error_log
ssl_request_log
At configuration time, we told apachetop to watch the access_log. To view entries in one of the other log files, use the following command:
# apachetop -f /etc/httpd/logs/filename
You can watch many log files at the same time by appending multiple -f logfile options to the end of the command line:
#apachetop -f /etc/httpd/logs/access_log
\
-f /etc/httpd/logs/error_log \ -f /etc/httpd/logs/ssl_access_log
\
-f /etc/httpd/logs/ssl_error_log

320 Technique 43: Keeping an Eye on Your Servers
Changing the display time of apachetop statistics
By default, apachetop displays statistics for only the previous 30 seconds. Unless you have a lot of traffic at your server, you may want to extend the display time to hold the information longer.
You can customize the apachetop display to retain statistics about your server for a longer or shorter length of time, depending on your needs. If you have a lot of server traffic, shortening the display time leaves you with easier- to-read reports. If your server traffic is low, a longer display time allows you to gather information over the course of hours for the sake of comparison and easy monitoring.
Use the following command to extend the display time to an hour (3600 seconds):
# apachetop -T 3600
The default refresh rate for the display is 5 seconds. If you have a lot of traffic and want the screen to refresh more often, use the following command:
# apachetop -r 2
Now, the screen refreshes every 2 seconds. Of course, you can combine display options on the command line:
# apachetop -r 2 -T 3600
This command refreshes the statistics every 2 seconds and displays the request activities for the previous hour.
Monitoring MySQL Server with the MySQL Control Center
One cool tool for monitoring and maintaining your MySQL databases in a graphical environment is the MySQL Control Center (MySQLCC). The MySQL Control Center is available from the official MySQL
Web site (www.mysql.com). The Control Center (like MySQL) is dual-licensed — see the MySQL Web site for licensing specifics.
Downloading and installing the
MySQL Control Center
To download and install the MySQL Control Center, follow these steps:
1. Open a browser and surf to
www.mysql.com/downloads/mysqlcc.html
2. Click the Pick a Mirror link for the Linux
(x86, glibc 2.3) download.
It’s the second link in the Linux Downloads portion of the page.
3. When the Select a Mirror page opens, click an
HTTP link from a mirror close to your location.
4. When the Download Manager opens, save the tarball to your home directory.
We’re telling you to download and install MySQLCC in your home directory for the sake of having a consistent point of reference for this technique. You may want to save it elsewhere on your system. To make it easy to run (no matter where you install it), include the directory in your search path so you can run it without issuing the complete pathname every time. See Technique 7 to find out how.
5. Open a terminal window, give yourself superuser privileges with the su command, and unpack the tarball with the following command:
#tar -xzvf \ mysqlcc-0.9.4-linux-glibc23.tar.gz
6.Move into the mysqlcc-0.9.4-linux-glibc23 directory:
#cd mysql-0.9.4-linux-glibc23
That’s it! MySQLCC doesn’t come with any fancy installers; you just load the program onto your computer and run it as we describe in the next section.
Monitoring MySQL Server with the MySQL Control Center 321
Accessing MySQL Control Center features
After you install the MySQL Control Center, you’re ready to take advantage of its handy tools. Here’s how to get to them:
1. Start the Control Center with the following command:
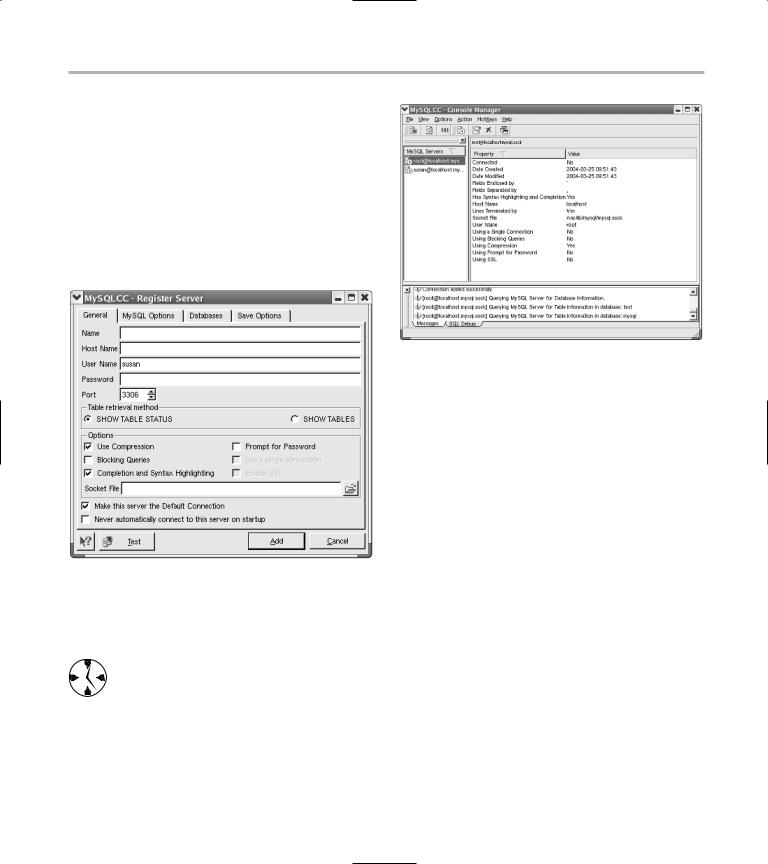
#./mysqlcc
The MySQLCC window and the Register Server dialog both open (see Figure 43-3).
• Figure 43-3: MySQLCC’s opening view.
2. On the General tab of the Register Server dialog, enter the name of the computer in the Host Name field.
If you have multiple MySQL servers running (scattered around your network), you may want to enter a server name that’s meaningful to you in the Name field to make the different servers easy to distinguish.
3. Click Add to display the session properties
•Figure 43-4: The Console Manager.
4.Double-click a server name in the MySQL Servers frame to expand the tree control and display the controls for Databases, Server Administration, and User Administration.
5.Highlight any entry in the Server tree control (Databases, Server Administration, or User Administration) to display status information about that aspect of the MySQL server.
The following sections have more details on each of these controls.
Viewing, managing, and repairing a database with the Databases controls
The Databases controls enable you to view your database, and you also have tools for managing data and fixing problems as well.
MySQLCC is a complete MySQL client application. You can use MySQLCC to execute SQL commands and queries, but it’s really designed to give you
a quick overview of the state of your database. To view the statistics for databases, follow these steps:
neatly in the Console Manager (see Figure 43-4).
322 Technique 43: Keeping an Eye on Your Servers
1. Follow the steps in the section, “Accessing
MySQL Control Center features,” earlier in this technique, to access the controls.
2. Highlight the Databases entry, as shown in
Figure 43-5.
•Figure 43-5: The Databases statistics.
3.Click the tree control next to the Databases folder to display the databases on the server.
4.Click the tree control next to the Tables entry to view the tables in the database.
5.Highlight a table name to view the fields within that table (see Figure 43-6).
6.Double-click the table name to see the data within that table.
The table data is displayed, as shown in Figure 43-7.
You can adjust the number of rows displayed, but by default, MySQLCC displays the first 1,000 rows. To adjust the default row limit, highlight the server (in the left-most pane), click the Edit button (in the toolbar), then choose MySQL Options and type a row count into the limit field.
• Figure 43-6: A quick view of the fields within a table.
• Figure 43-7: Table data displayed with the Control Center.
The Databases controls include some handy tools to help you manage and repair your MySQL database:
1. Highlight Tables in the tree control and then choose Action Tools to open the drop-down menu (see Figure 43-8).
2. Choose an option from the Tools menu. Here are your choices: