

- •Table of Contents
- •Introduction
- •Saving Time with This Book
- •Foolish Assumptions
- •Part I: Making the Desktop Work for You
- •Part II: Getting the Most from Your File System
- •Part III: Good Housekeeping with Linux
- •Part IV: Tweaking the Kernel on Your Linux System
- •Part V: Securing Your Workspace
- •Part VI: Networking Like a Professional
- •Part VII: Monitoring Your System
- •Part VIII: Serving Up the Internet and More
- •Part X: Programming Tricks
- •Part XI: The Scary (Or Fun!) Stuff
- •Icons Used in This Book
- •Discovering Your Protocols
- •Managing Snapshots with the camera: Protocol
- •Remote File Management with fish:
- •Getting Help with help:, info:, and man:
- •Other KDE Protocols
- •Using GNOME VFS Modules
- •Stacking VFS Modules
- •Working with Packages: rpm and rpms
- •Putting VFS to Work at the Command Line
- •Burning CDs with a VFS
- •Skinning Your Desktop with VFS
- •Classifying Data with MIME
- •Creating KDE File Associations
- •Creating New MIME Types with GNOME
- •Making Basic Prompt Transformations
- •Adding Dynamically Updated Data to Your Prompt
- •Colorizing Your Prompt
- •Seeing a Red Alert When You Have Superuser Privileges
- •Saving Your Work
- •Completing Names Automatically
- •Using the Escape Key to Your Advantage
- •Customizing Completion for Maximum Speed
- •Using cd and ls to Navigate through bash
- •Setting Your CDPATH Variables to Find Directories Fast
- •Streamlining Archive Searches
- •Turning the Output of a Command into a Variable with $( )
- •Using $UID and $EUID in Shell Scripts
- •Customizing Variables for Rapid Transit
- •Finding the Right Shell Script
- •Choosing your victims
- •Timing is everything
- •Cleaning up made easy
- •Changing prototype scripts
- •Customizing Your Autostart File
- •Navigating the History List
- •Scrolling
- •Summoning a command by number
- •Searching through history
- •Customizing the History List
- •Adjusting key default settings
- •Filtering the history list
- •Executing Commands Quickly with History Variables
- •Viewing Your Aliases
- •Using Aliases for Complex Commands
- •Automating Tedious Tasks with Functions
- •Filtering file searches by file type
- •Automatic downloading
- •Monitoring Your System in a Snap
- •Un-tarring the Easy Way
- •What Is Samba?
- •Getting Up and Running with Samba
- •Checking whether Samba is installed
- •Enabling Samba
- •Adjusting the workgroup name and creating user accounts
- •Giving a Windows machine access to your home directory
- •Sharing Linux files and directories with other computers
- •Hooking Everyone Up to the Printer
- •Sharing Linux printers with SWAT
- •Using a Windows printer from Linux
- •Plugging In to Remote Data with Linux Programs Quickly
- •Finding Files with locate
- •Finding Files with find
- •Qualifying Your Search with the find Command
- •Doing updated filename searches
- •Adding time-based qualifications
- •Filtering by file size
- •Perusing commonly used qualifications
- •Acting on What You Find
- •Displaying specific info with -printf
- •Checking disk usage by user
- •Executing commands with find
- •Building Complex Commands with xargs
- •Creating Archives with File Roller
- •Inspecting and Extracting Archives with File Roller
- •Adding Functionality to tar with Complex Commands
- •Building archives from the command line
- •Archiving complex search results
- •Backing up an installed package
- •Uprooting Entire Directory Trees with scp
- •Splitting Big Files into Manageable Chunks
- •Building Software from Downloaded tarballs
- •Compiling a tarball: The basic steps
- •Downloading and compiling SuperKaramba
- •Versatile Downloading with wget
- •Mirroring sites with wget
- •Verifying your bookmarks with wget
- •Downloading files with wget
- •Downloading and unpacking in one quick step
- •Downloading and Uploading with curl
- •Setting Up ADIOS
- •Downloading ADIOS
- •Burning ADIOS to CD
- •Installing ADIOS
- •Finding Your Way around UML
- •Connecting to the Internet from an ADIOS VM
- •Using a GUI with UML
- •Installing Software into UML
- •Merging Changes to Your Prototype
- •Querying RPM Packages for Content
- •Digesting Information
- •Creating a Package Index
- •Querying for Prerequisites
- •Dissecting an RPM Package
- •Using RPM at the Command Line
- •Removing RPMs
- •Flagging Down RPM
- •Getting Graphic with RPM
- •Using Rpmdrake to install from media
- •Installing from your Konqueror browser
- •Verifying Your System
- •Reading the Tamper-Proof Seal
- •Setting Up Synaptic and apt in a Snap
- •Keeping Up-to-Date with apt and Synaptic: The Basics
- •Handy Hints about Synaptic
- •Changing repositories
- •Viewing package details
- •Installing new packages with Synaptic
- •Importing the Keys to the Repository
- •Letting Task Scheduler Work for You
- •Scheduling a new task
- •Editing a task
- •Adding environment variables
- •Reining In Resources with Disk Quotas
- •Installing the quota RPM package
- •Enabling file system quotas
- •Getting your files together
- •Setting quotas
- •Reviewing your quotas
- •Using System Accounting to Keep Track of Users
- •Setting up system accounting
- •Looking up user login hours
- •Checking out command and program usage
- •Running Down the Runlevels
- •Runlevel basics
- •Customizing runlevels in Fedora
- •Customizing runlevels in SuSE
- •Customizing runlevels in Mandrake
- •Customizing runlevels at the command line
- •Switching to a new runlevel
- •Disabling Unused Services
- •Removing Unneeded Services
- •Learning about modules
- •Installing a module with insmod
- •Taking care of dependencies automatically with modprobe and depmod
- •Loading a module for a slightly different kernel with insmod and modprobe
- •Removing modules with rmmod
- •Step 1: Making an Emergency Plan, or Boot Disk
- •Step 2: Finding the Source Code
- •Step 4: Customizing the Kernel
- •Step 5: Building the Kernel
- •Understanding the Principles of SELinux
- •Everything is an object
- •Identifying subjects in SELinux
- •Understanding the security context
- •Disabling or Disarming SELinux
- •Playing the Right Role
- •Exploring the Process-Related Entries in /proc
- •Surveying Your System from /proc
- •Popping the Cork: Speeding Up WINE with /proc
- •Reading and Understanding File Permissions
- •Controlling Permissions at the Command Line
- •Changing File Permissions from a Desktop
- •Encryption Made Easy with kgpg and the KDE Desktop
- •Creating keys with kgpg
- •Sharing your key with the world
- •Importing a public key from a public-key server
- •Encrypting and decrypting documents with drag-and-drop ease
- •Encrypting Documents with gpg at the Command Line
- •Sharing a secret file
- •Creating a key pair and receiving encrypted documents
- •Encrypting documents on your home system
- •Encrypting E-Mail for Added Security
- •Encrypting with Ximian Evolution
- •Setting up Mozilla e-mail for encryption
- •Sending and receiving encrypted messages with Mozilla mail
- •Using Cross-Platform Authentication with Linux and Windows
- •Prepping for cross-platform authentication
- •Setting up cross-platform authentication
- •Using PAM and Kerberos to Serve Up Authentication
- •Establishing synchronized system times
- •Testing your domain name server (DNS)
- •Setting up a Key Distribution Center
- •Setting up automatic ticket management with Kerberos and PAM
- •Adding users to the Key Distribution Center
- •Building Good Rules with PAM
- •Phase
- •Control level
- •Module pathname
- •Arguments
- •Dissecting a Configuration File
- •Skipping a Password with PAM
- •Feeling the Power
- •Gaining Superuser Privileges
- •Pretending to Be Other Users
- •Limiting Privileges with sudo
- •Installing sudo
- •Adding Up the Aliases
- •Adding Aliases to the sudo Configuration File
- •Defining the Alias
- •Creating a User_Alias
- •Creating a Runas_Alias
- •Simplifying group managment with a Host_Alias
- •Mounting and unmounting CDs without the superuser password
- •Managing access to dangerous commands with command aliases
- •Using SSH for Top-Speed Connections
- •Setting Up Public-Key Authentication to Secure SSH
- •Generating the key pair
- •Distributing your public key
- •Passing on your passphrase
- •Logging In with SSH and Key Authentication
- •Starting from the command line
- •Getting graphic
- •Creating Shortcuts to Your Favorite SSH Locations
- •Copying Files with scp
- •Secure (And Fast) Port Forwarding with SSH
- •Finding Your Firewall
- •Setting up a simple firewall in Mandrake Linux
- •Setting up a simple firewall in Fedora Linux
- •Setting up a simple firewall in SuSE Linux
- •Editing the Rules with Webmin
- •Starting a Webmin session
- •Reading the rules with Webmin
- •Changing the rules
- •Editing existing rules
- •Adding a new rule with Webmin
- •Sharing Desktops with VNC
- •Inviting Your Friends to Use Your Desktop
- •Serving Up a New Desktop with VNC Server
- •Using tsclient to View Remote Desktops from Linux
- •Using tsclient with a VNC server
- •Using tsclient with an RDP server
- •Creating New VNC Desktops on Demand
- •Switching display managers in SuSE Linux
- •Switching display managers in Mandrake Linux
- •Connecting gdm and VNC
- •Exploring Your Network with lsof
- •Running lsof
- •Interpreting the lsof output
- •Reading file types
- •Discovering Network Connections
- •Other Timesaving lsof Tricks
- •Packet Sniffing with the Ethereal Network Analyzer
- •Starting Ethereal
- •Capturing packets
- •Applying filters to screen packets
- •Peeking in packets
- •Color-coding packets coming from your network
- •Getting Up and Running with Nessus
- •Installing programs Nessus needs to run
- •Installing Nessus
- •Adding a user to Nessus
- •Generating a certificate
- •Starting the daemon and the interface
- •Reading the grim results
- •Keeping Your Plug-ins Up-to-Date
- •Chatting in the Fedora Chat Room
- •Looking for Answers in the SuSE Chat Room
- •Processing Processes with procps
- •Using ps to filter process status information
- •Viewing ps output the way you want to see it
- •Making parent-child relationships stand out in a ps listing
- •Climbing the family tree with pstree
- •Finding processes with pgrep
- •Killing Processes with pkill
- •Killing Processes with killall
- •Closing Windows with xkill
- •Managing Users and Groups with the Fedora/Mandrake User Manager
- •Adding new users
- •Modifying user accounts
- •Adding groups
- •Filtering users and groups
- •Managing Users and Groups with the SuSE User Administrator
- •Adding new users
- •Modifying user accounts
- •Adding groups
- •Filtering users and groups
- •Adding and deleting log files from the viewer
- •Setting up alerts and warnings
- •Viewing your log files from SuSE
- •Monitoring your log files from SuSE
- •Customizing Your Log Files
- •Keeping an Eye on Resources with KDE System Guard
- •Finding and killing runaway processes
- •Prioritizing processes to smooth a network bottleneck
- •Watching your system load
- •Creating a new worksheet
- •Creating system resource logs
- •Displaying network resources
- •Using Synaptic to download and install Apache
- •Installing Apache from disc
- •Starting the Apache Service
- •Building a Quick Web Page with OpenOffice.org
- •Taking Your Site Public with Dynamic DNS
- •Understanding how dynamic DNS works
- •Setting up dynamic DNS
- •Updating your IP address
- •Installing the Fedora HTTP Configuration tool
- •Putting the HTTP Configuration tool to work
- •Watching Your Web Server Traffic with apachetop
- •Installing apachetop
- •Running and exiting apachetop
- •Navigating apachetop
- •Switching among the log files (or watching several at once)
- •Changing the display time of apachetop statistics
- •Accessing MySQL Control Center features
- •Viewing, managing, and repairing a database with the Databases controls
- •Putting the Server Administration controls to work
- •Adding a new user
- •Watching Your MySQL Traffic with mtop
- •Gathering all the packages that mtop needs
- •Installing mtop
- •Monitoring traffic
- •Building a MySQL Server
- •Installing the necessary packages
- •Starting the MySQL server
- •Replicating MySQL Data
- •Configuring replication: The three topologies
- •Setting up replication for a single slave and master
- •Choosing a Method to Back Up MySQL Data
- •Backing Up and Restoring with mysqldump
- •mysqldump backup options
- •Backing up multiple databases
- •Compressing the archive
- •Restoring a mysqldump archive
- •Making a mysqlhotcopy of Your Database
- •Archiving a Replication Slave
- •Taking Care of Business with MySQL Administrator
- •Installing MySQL Administrator
- •Starting MySQL Administrator
- •Choosing an SSL Certificate
- •Creating a Certificate Signing Request
- •Creating a Signing Authority with openssl
- •Creating a certificate authority
- •Signing a CSR
- •Exploring Your Certificate Collection with Mozilla
- •Introducing hotway
- •Getting Started with hotway
- •Setting Up Evolution to Read HTTPMail Accounts with hotway
- •Ringing the Bells and Blowing the Whistles: Your Evolution Summary Page
- •Installing SpamAssassin
- •Installing from the distribution media
- •Installing from RPM downloads
- •Starting the service
- •Fine-Tuning SpamAssassin to Separate the Ham from the Spam
- •Customizing settings
- •Saving your settings
- •Adding a New Filter to Evolution
- •Serving Up a Big Bowl of the RulesDuJour
- •Registering Your Address
- •Taming a Sendmail Server
- •Tweaking Your Configuration Files with Webmin
- •Serving up mail for multiple domains
- •Relaying e-mail
- •Using aliases to simplify mail handling
- •Deciding What to Archive
- •Choosing Archive Media
- •Tape drives
- •Removable and external disk drives
- •Removable media
- •Optical media (CDs and DVDs)
- •Online storage
- •Choosing an Archive Scheme
- •Full backups
- •Differential backups
- •Incremental backups
- •Incremental versus differential backups
- •Choosing an Archive Program
- •Estimating Your Media Needs
- •Creating Data Archives with tar
- •Backing up files and directories
- •Backing up account information and passwords
- •Targeting bite-sized backups for speedier restores
- •Rolling whole file systems into a tarball
- •Starting an Incremental Backup Cycle
- •Restoring from Backup with tar
- •Backing Up to CD (Or DVD) with cdbackup
- •Creating the backup
- •Restoring from a CD or DVD backup
- •Restoring from a disc containing multiple archives
- •Combining the Power of tar with ssh for Quick Remote Backups
- •Testing the ssh connection to the remote host
- •Creating a tar archive over the ssh connection
- •Backing up to tape drives on remote machines
- •Backing Up to a Remote Computer with rdist and ssh
- •Testing the ssh connection to the remote host
- •Creating the distfile
- •Backing up
- •Getting Started with CVS
- •Checking whether CVS is installed
- •Discovering what to use CVS for
- •Creating a CVS Repository
- •Populating Your Repository with Files
- •Simplifying CVS with cervisia
- •Installing cervisia
- •Putting files in your sandbox
- •Adding more files to your repository
- •Committing your changes
- •Browsing your log files
- •Marking milestones with tags
- •Branching off with cervisia
- •Using the libcurl Library (C Programming)
- •Uploading a File with a Simple Program Using libcurl
- •Line 7: Defining functions and data types
- •Line 14: Calling the initialization function
- •Lines 18– 21: Defining the transfer
- •Line 23: Starting the transfer
- •Line 26: Finishing the upload
- •Installing the Ming Library
- •Building a Simple Flash Movie with Ming
- •Examining the program
- •Compiling the program
- •Running the program
- •Building Interactive Movies with Ming
- •Examining the program
- •Compiling the program
- •Running the program
- •Doing the curl E-shuffle with PHP
- •Combining PHP with curl and XML: An overview
- •Checking out the XML file
- •Downloading and displaying the XML file with a PHP script (and curl)
- •Sending E-Mail from PHP When Problems Occur
- •Debugging Perl Code with DDD
- •Installing and starting DDD
- •Examining the main window
- •Reviewing and stepping through source code
- •Making Stop Signs: Using Breakpoints to Watch Code
- •Setting a breakpoint
- •Modifying a breakpoint
- •Opening the data window
- •Adding a variable to the data window
- •Changing the display to a table
- •Using the Backtrace feature
- •Using the Help menu
- •Making Fedora Distribution CDs
- •Downloading the ISO images
- •Verifying the checksums
- •Burning an ISO File to Disc at the Command Line
- •Finding the identity of your drive
- •Running a test burn
- •Burning the distribution discs
- •Burning CDs without Making an ISO First
- •Finding setuid quickly and easily with kfind
- •Finding setuid and setgid programs at the command line
- •Deciding to Turn Off setuid or setgid
- •Changing the setuid or setgid Bit
- •Who Belongs in Jail?
- •Using UML to Jail Programs
- •Using lsof to Find Out Which Files Are Open
- •Debugging Your Environment with strace
- •Investigating Programs with ltrace
- •Handy strace and ltrace Options
- •Recording Program Errors with valgrind
- •Hardening Your Hat with Bastille
- •Downloading and installing Bastille and its dependencies
- •Welcome to the Bastille
- •Addressing file permission issues
- •Clamping down on SUID privileges
- •Moving on to account security
- •Making the boot process more secure
- •Securing connection broker
- •Limiting compiler access
- •Limiting access to hackers
- •Logging extra information
- •Keeping the daemons in check
- •Securing sendmail
- •Closing the gaps in Apache
- •Keeping temporary files safe
- •Building a better firewall
- •Port scanning with Bastille
- •Turning LIDS On and Off
- •Testing LIDS before Applying It to Your System
- •Controlling File Access with LIDS
- •Hiding Processes with LIDS
- •Running Down the Privilege List
- •Getting Graphical at the Command Line
- •Getting graphical in GNOME
- •Getting graphical with KDE
- •Staying desktop neutral
- •Index
Packet Sniffing with the Ethereal Network Analyzer |
251 |
-c command: Displays files that are opened by any occurrence of the given command. (You can specify a partial command name here; for example, -c xm displays files opened by commands whose names start with xm.)
-u username: Displays files opened by user username.
-i TCP@host: Displays TCP connections to host.
-p processID: Displays files opened by the given process.
If you’ve ever tried to umount a CD that’s being used by another user, you know that Linux won’t let you. The other user might not even be using the CD; if that user has a terminal window open to the directory, you can’t eject the CD until he or she is done. To find out who’s hogging the drive, use the following command:
# lsof | grep /mnt/cdrom
The result set shows you the device user. Hopefully, this user can surrender the drive so others can
use it.
Packet Sniffing with the Ethereal Network Analyzer
Normally, your machine doesn’t read the network packets that aren’t intended for it. The Ethereal Network Analyzer is a packet sniffer that watches all the packets that go across your network and lets you open and read the packets you choose.
Starting Ethereal
To open the Ethereal Network Analyzer, follow these steps:
1. If you’re running Fedora Linux, open the Main Menu and choose Internet More Internet Applications Ethereal.
If you’re using SuSE, open the Main Menu and choose Internet Administration.
If you’re using Mandrake, open the Main Menu and choose System Monitoring Ethereal.
2. Enter your password when prompted.
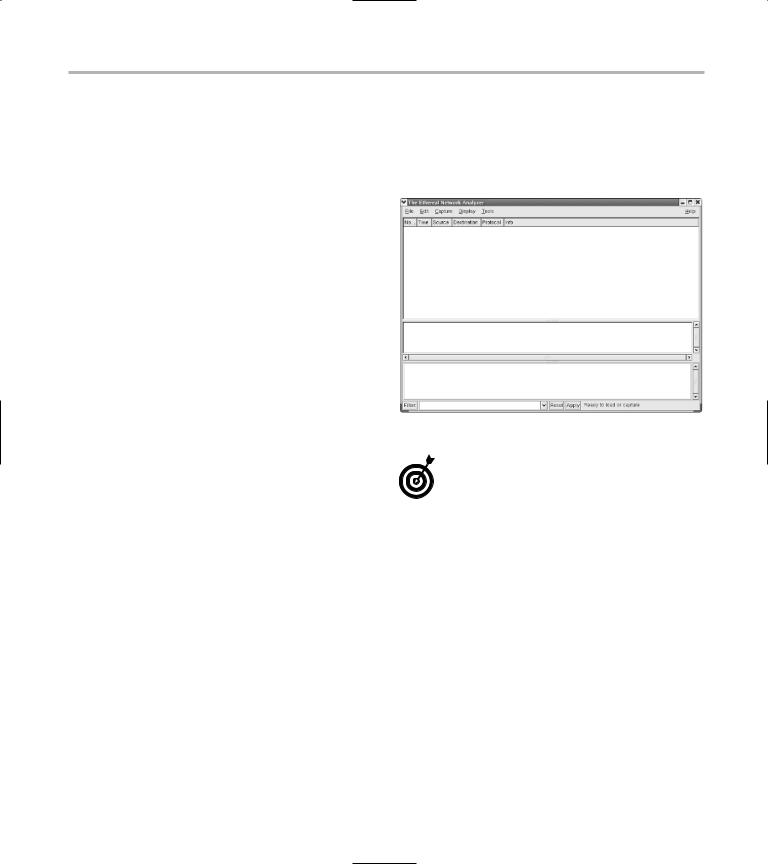
Ethereal opens, as shown in Figure 36-4.
• Figure 36-4: The Ethereal main window.
The Ethereal Network Analyzer is included with most Linux distributions. If it’s not on your menu, it should be on the disc. Just install the RPMs with the following commands:
#rpm -Uhv ethereal-version.rpm
#rpm -Uhv ethereal-gnome-version.rpm
Capturing packets
To start capturing network packets in Ethereal, follow these steps:
1. Choose Capture Start.
The Capture Options setup dialog opens, as shown in Figure 36-5.
2. In the Interface list box, choose the network interface that you want to watch.
Typically, you choose eth0.
3. Check the Update List of Packets in Real Time and Automatic Scrolling in Live Capture boxes.
252 Technique 36: Streamlining Your Network Surveillance
• Figure 36-5: The Capture Options setup dialog.
As a rule, checking the Enable Network Name Resolution box really slows things down.
4. Click OK.
Ethereal starts sniffing (see Figure 36-6). If you look closely at the Source and Destination columns, you’ll see that packets are flowing back and forth between machines.
Use the Start and Stop options in the Capture menu to sample short segments of network usage for a quick scan. Unless you tell Ethereal to save the captured packets, it doesn’t create a log file, but the working file can get big fast. If your system has plenty of power, it won’t hurt to leave the capture session running, but if you’re running on a slow machine, sampling is a good idea.
• Figure 36-6: Ethereal capturing network packets.
Applying filters to screen packets
To make the traffic easier to follow, apply filters to select only the packets you’re interested in. Ethereal filters screen packets by protocol type. You can choose from hundreds of protocols, but many are so obscure that you’ll never encounter them.
You can set up an HTTP filter to monitor the Internet traffic between your system and the Web. If excessive surfing is slowing down the network, you can screen all the network packets for the HTTP protocol and find the prime offenders.
To add and apply a filter, follow these steps:
1. Choose Edit Display Filters.
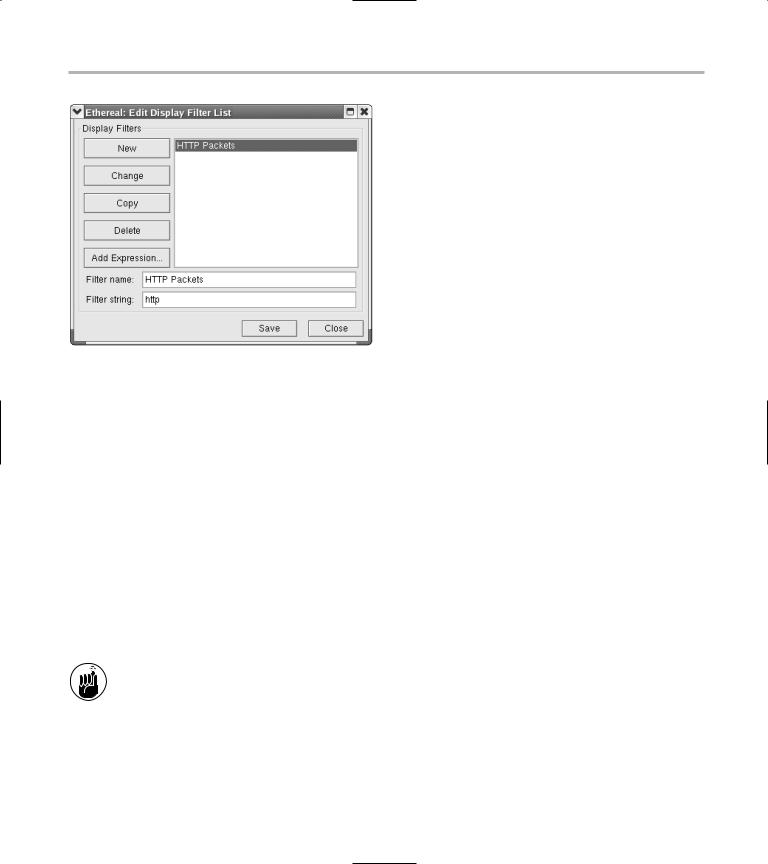
The Edit Display Filter List dialog opens, as shown in Figure 36-7.
2. Type HTTP Packets in the Filter Name field and type http in the Filter String field, and then click New.
3. Click Save and then click Close.
You’ve created a new filter named HTTP Packets.
Packet Sniffing with the Ethereal Network Analyzer |
253 |
•Figure 36-7: Adding a display filter.
4.To apply the filter, click the Filter button in the lower-left corner of Ethereal’s main window.
5.In the Display Filter dialog that appears, highlight the filter name and click OK.
After a short delay, the packet list shows only HTTP packets.
Peeking in packets
When you’ve found a series of packets that might be interesting, you can take a peek inside. Highlight a packet and choose Tools Follow TCP Stream. A window opens, displaying the contents of the TCP stream. The dialog displays the chatter between the machines, with each machine responding in a different color.
Packet data is not meant to be readable by humans. Some protocols contain recognizable text (such as the HTML code that a Web browser uses), but other protocols (like SSH) are encrypted.
Network chatter is sent in a series of wrappers. The outermost layer contains hardware information, and the inner layers hold the meat of the message. The outermost layers are the least human-friendly, and the inner layer is occasionally understandable.
In the middle pane of the Ethereal window, you see a display of the wrappers that make up the packet (refer to Figure 36-6). The wrappers that are higher in the tree control are the machine-friendly wrappers. The lower wrappers are human-friendly.
Expand the lower branches in the tree control to see an interpretation of the packet that’s highlighted in the top panel. The bottom window displays the corresponding raw data in the packet.
Color-coding packets coming from your network
The packet listing is much easier to read if you colorize the packets coming from the computers on your network. Follow these steps to add color to the display:
1. Choose Display Colorize Display.
The Apply Color Filters dialog opens.
2. Click New.
The Edit Color Filter dialog opens.
3. Enter a name in the Name field.
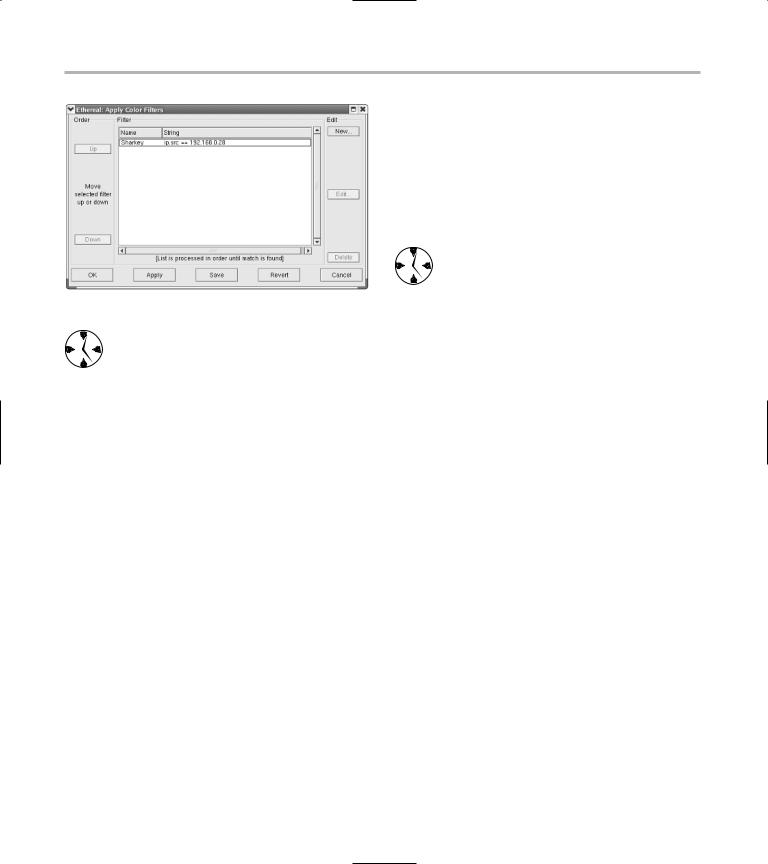
4. In the String field, enter the IP address you want to colorize by using the following form (see Figure 36-8):
ip.src == 192.168.0.218
5. Click the Foreground Color button and use the color selector to choose the font color. Then click OK.
254 Technique 36: Streamlining Your Network Surveillance
• Figure 36-8: The completed Apply Color Filters dialog.
If you really want conversations to stand out at a glance, choose a background color as well. That can get a bit garish, but it’s worth experimenting with.
6. Click OK to close the Color Filter dialog.
7. Click Save and then OK in the Apply Color
Filters dialog.
A dialog opens, charting the progress as the filter runs, and in a snap, the display is colorized. The new colors make it easy to tell who’s chattering on your network.
Colorize each machine on your local network to make it easy to spot the traffic that’s not being generated by a network computer. It’s also an easy way to monitor an individual user’s traffic.

37 |
Evaluating Your |
|
|
|
Network Security |
Technique |
with Nessus |
|
Save Time By
Using Nessus to evaluate your network security
Closing any security vulnerabilities you find before a hacker can exploit them
It doesn’t matter if you’re the administrator of a big network or a small one, a hacker running loose on your system can cause mega-damage (and time loss) in a matter of minutes. Running a tight ship is important. When you set up your network, you’re likely to have taken quite a few measures to ensure your network’s security, but how do you know
you haven’t missed something?
A top-notch open-source project called Nessus provides a security scanner that can check your (hopefully) tight ship for leaks — security vulnerabilities that hackers could exploit if they had the chance. If your system freely gives up information about open ports (or more specifically, the services running behind them), hackers can exploit that information easier than they could if they had to make guesses about your system.
Nessus can do a lot more than detect open ports. Here are some other timesaving features Nessus has to offer:
If the security tests you need aren’t included in the distribution, you can write your own customized plug-ins to get the job done.
Nessus has a friendly graphical user interface with easy-to-read reports, or you can run it from the command line.
The Nessus project stays up-to-date with recent security issues and provides easy automatic updates of the security test scripts.
Nessus also supports SSL services, making sure your network is secure while it works on your ports.
The Nessus plug-ins search for backdoors, denial-of-service vulnerabilities, sturdy firewalls, remote shell accesses, peer-to-peer filesharing, useless services, and tons of other security risks. The database currently has over 2,000 plug-ins.
Nessus can handle big or small networks with ease, with tailored testing that won’t waste a lot of time.