

JavaScript execution speed |
281 |
|
|
grips with the grim realities and compromises built into the browsers that we know and love. If we don’t acknowledge these lower layers of the software stack, things can start to go wrong.
If our application takes several seconds to respond to a button being clicked or several minutes to process a form, then we are in trouble, however elegant the design of the system. Similarly, if our application needs to grab 20MB of system memory every time we ask it what the time is and lets go of only 15MB, then our potential users will quickly discard it.
JavaScript is (rightly) not known for being a fast language, and it won’t perform mathematical calculations with the rapidity of hand-tuned C. JavaScript objects are not light either, and DOM elements in particular take up a lot of memory. Web browser implementations too tend to be a little rough around the edges in many cases and prone to memory leaks of their own.
Performance of JavaScript code is especially important to Ajax developers because we are boldly going where no web programmer has gone before. The amount of JavaScript that a full-blown Ajax application needs is significantly more than a traditional web application would use. Further, our JavaScript objects may be longer lived than is usual in a classic web app, because we don’t refresh the entire page often, if at all.
In the following two sections, we’ll pursue the two pillars of performance, namely, execution speed and memory footprint. Finally, we’ll round out this chapter with a case study that demonstrates the importance of naming and understanding the patterns that a developer uses when working with Ajax and with the DOM.
8.2 JavaScript execution speed
We live in a world that values speed, in which things have to get finished yesterday. (If you don’t live in such a world, drop me a postcard, or better still, an immigration form.) Fast code is at a competitive advantage to slower code, provided that it does the job, of course. As developers of code, we should take an interest in how fast our code runs and how to improve it.
As a general rule, a program will execute at the speed of its slowest subsystem. We can time how fast our entire program runs, but having a number at the end of that won’t tell us very much. It’s much more useful if we can also time individual subsystems. The business of measuring the execution speed of code in detail is generally known as profiling. The process of creating good code, like creating good art, is never finished but just stops in interesting places. (Bad code, on the other hand, often just stops in interesting places.) We can always squeeze a little

282CHAPTER 8
Performance
more speed out of our code by optimizing. The limiting factor is usually our time rather than our skill or ingenuity. With the help of a good profiler to identify the bottlenecks in our code, we can determine where to concentrate our efforts to get the best results. If, on the other hand, we try to optimize our code while writing it, the results can be mixed. Performance bottlenecks are rarely where one would expect them to be.
In this section, we will examine several ways of timing application code, and we’ll build a simple profiling tool in JavaScript, as well as examine a real profiler in action. We’ll then go on to look at a few simple programs and run them through the profiler to see how best to optimize them.
8.2.1Timing your application the hard way
The simplest tool for measuring time that we have at our disposal is the system clock, which JavaScript exposes to us through the Date object. If we instantiate a Date object with no arguments, then it tells us the current time. If one Date is subtracted from another, it will give us the difference in milliseconds. Listing 8.1 summarizes our use of the Date object to time events.
Listing 8.1 Timing code with the Date object
function myTimeConsumingFunction(){ var beginning=new Date();
...
//do something interesting and time-consuming!
...
var ending=new Date();
var duration=ending-beginning; alert("this function took "+duration
+"ms to do something interesting!");
}
We define a date at each end of the block of code that we want to measure, in this case our function, and then calculate the duration as the difference between the two. In this example, we used an alert() statement to notify us of the timing, but this will work only in the simplest of cases without interrupting the workflow that we are trying to measure. The usual approach to gathering this sort of data is to write it to a log file, but the JavaScript security model prevents us from accessing the local filesystem. The best approach available to an Ajax application is to store profiling data in memory as a series of objects, which we later render as DOM nodes to create a report.
JavaScript execution speed |
283 |
|
|
Note that we want our profiling code to be as fast and simple as possible while the program is running, to avoid interfering with the system that we are trying to measure. Writing a variable to memory is much quicker than creating extra DOM nodes during the middle of the program flow.
Listing 8.2 defines a simple stopwatch library that we can use to profile our code. Profiling data is stored in memory while the test program runs and rendered as a report afterward.
Listing 8.2 stopwatch.js
var stopwatch=new Object(); |
|
Array of registered timers |
||||
stopwatch.watches=new Array(); |
|
|
||||
|
||||||
stopwatch.getWatch=function(id,startNow){ |
|
Entry point for client code |
||||
|
||||||
var watch=stopwatch.watches[id]; |
|
|
|
|
|
|
if (!watch){ |
|
|
|
|
|
|
watch=new stopwatch.StopWatch(id); |
|
|
||||
} |
|
|
|
|
|
|
if (startNow){ |
|
|
|
|
|
|
watch.start(); |
|
|
|
|
|
|
} |
|
|
|
|
|
|
return watch; |
|
|
|
|
|
|
} |
|
|
|
|
|
|
stopwatch.StopWatch=function(id){ |
|
|
Stopwatch object constructor |
|||
|
|
|||||
this.id=id; |
|
|
|
|
|
|
stopwatch.watches[id]=this; |
|
|
|
|
|
|
this.events=new Array(); this.objViewSpec=[
{name: "count", type: "simple"}, {name: "total", type: "simple"},
{name: "events", type: "array", inline:true}
];
}
stopwatch.StopWatch.prototype.start=function(){ this.current=new TimedEvent();
}
stopwatch.StopWatch.prototype.stop=function(){ if (this.current){
this.current.stop();
this.events.append(this.current);
this.count++;
this.total+=this.current.duration;
this.current=null;
}
}
stopwatch.TimedEvent=function(){ |
|
Timed event object constructor |
|
this.start=new Date();
284CHAPTER 8
Performance
this.objViewSpec=[
{name: "start", type: "simple"}, {name: "duration", type: "simple"}
];
}
stopwatch.TimedEvent.prototype.stop=function(){ var stop=new Date(); this.duration=stop-this.start;
} |
|
|
stopwatch.report=function(div){ |
|
Profile report generator |
|
||
var realDiv=xGetElementById(div); |
|
|
var report=new objviewer.ObjectViewer(stopwatch.watches,realDiv);
}
Our stopwatch system is composed of one or more categories, each of which can time one active event at a time and maintain a list of previous timed events. When client code calls stopwatch.start() with a given ID as argument, the system will create a new StopWatch object for that category or else reuse the existing one. The client code can then start() and stop() the watch several times. On each call to stop(), a TimedEvent object is generated, noting the start time and duration of that timed event. If a stopwatch is started multiple times without being stopped in between, all but the latest call to start() will be discarded.
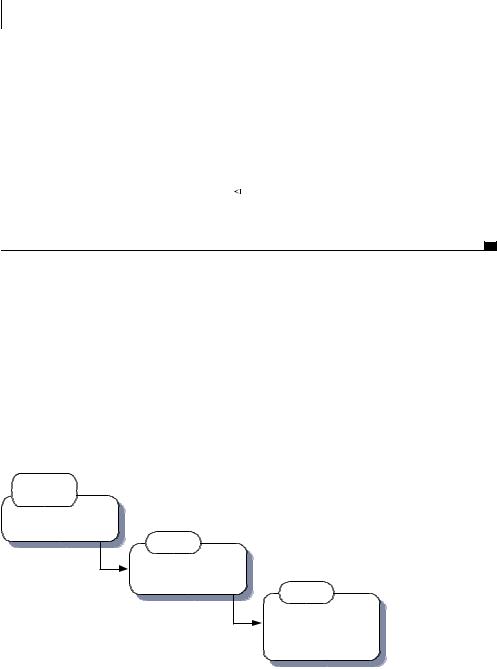
This results in an object graph of StopWatch categories, each containing a history of timed events, as illustrated in figure 8.1.
Stopwatch (singleton)
Category
+ id : String
Watches 0...n
Event
+ start : Date
+ duration : Number
Events 0...n
Figure 8.1 Object graph of stopwatch library classes. Each category is represented by an object that contains a history of events for that category. All categories are accessible from the stopwatch.watches singleton.

JavaScript execution speed |
285 |
|
|
When data has been gathered, the entire object graph can be queried and visualized. The render() function here makes use of the ObjectViewer library that we encountered in chapter 5 to automatically render a report. We leave it as an exercise to the reader to output the data in CSV format for cutting and pasting into a file.
Listing 8.3 shows how to apply the stopwatch code to our example “time consuming” function.
Listing 8.3 Timing code with the stopwatch library
function myTimeConsumingFunction(){
var watch=stopwatch.getWatch("my time consuming function",true);
...
//do something interesting and time-consuming!
...
watch.stop();
}
The stopwatch code can now be added relatively unobtrusively into our code. We can define as few or as many categories as we like, for different purposes. In this case, we named the category after the function name.
Before we move on, let’s apply this to a working example. A suitable candidate is the mousemat example that we used in chapter 4 when discussing the Observer pattern and JavaScript events. The example has two processes watching mouse movements over the main mousemat DOM element. One writes the current coordinates to the browser status bar, and the other plots the mouse cursor position in a small thumbnail element. Both are providing us with useful information, but they involve some processing overhead, too. We might wonder which is taking up the most processor time.
Using our stopwatch library, we can easily add profiling capabilities to the example. Listing 8.4 shows us the modified page, with a new DIV element to hold the profiler report and a few stopwatch JavaScript methods sprinkled across the blocks of code that we are interested in.
Listing 8.4 mousemat.html with profiling
<html>
<head>
<link rel='stylesheet' type='text/css' href='mousemat.css' /> <link rel='stylesheet' type='text/css' href='objviewer.css' /> <script type='text/javascript' src='x/x_core.js'></script>

286CHAPTER 8
Performance
<script type='text/javascript' src='extras-array.js'></script> <script type='text/javascript' src='styling.js'></script> <script type='text/javascript' src='objviewer.js'></script> <script type='text/javascript' src='stopwatch.js'></script> <script type='text/javascript' src='eventRouter.js'></script> <script type='text/javascript'>
var cursor=null;
window.onload=function(){
var watch=stopwatch.getWatch("window onload",true); var mat=document.getElementById('mousemat'); cursor=document.getElementById('cursor');
var mouseRouter=new jsEvent.EventRouter(mat,"onmousemove"); mouseRouter.addListener(writeStatus); mouseRouter.addListener(drawThumbnail);
watch.stop();
}
function writeStatus(e){
var watch=stopwatch.getWatch("write status",true); window.status=e.clientX+","+e.clientY; watch.stop();
}
function drawThumbnail(e){
var watch=stopwatch.getWatch("draw thumbnail",true); cursor.style.left=((e.clientX/5)-2)+"px"; cursor.style.top=((e.clientY/5)-2)+"px"; watch.stop();
}
</script>
</head>
<body>
<div>
<a href='javascript:stopwatch.report("profiler")'>profile</a> </div>
<div>
<div class='mousemat' id='mousemat'></div> <div class='thumbnail' id='thumbnail'>
<div class='cursor' id='cursor'></div> </div>
<div class='profiler objViewBorder' id='profiler'></div> </div>
</body>
</html>

JavaScript execution speed |
287 |
|
|
We define three stopwatches: for the window.onload event and for each mouse listener process. We assign meaningful names to the stopwatches, as these will be used by the report that we generate. Let’s load the modified application, then, and give it a quick spin.
When we mouse over the mousemat as before, our profiler is busy collecting data, which we can examine at any point by clicking the profile link in the top left. Figure 8.2 shows the application in the browser after a few hundred mouse moves, with the profiler report showing.
On both Firefox and Internet Explorer browsers we can see that in this case, the write status method takes less than one quarter the time of the draw thumbnail method.
Note that the window.onload event appears to have executed in 0 ms, owing to the limited granularity of the JavaScript Date object. With this profiling system, we’re working entirely within the JavaScript interpreter, with all of the limitations that apply there. Mozilla browsers can take advantage of a native profiler built into the browser. Let’s look at that next.
Figure 8.2 Mousemat example from chapter 4 with the JavaScript profiler running and generating a report on the active stopwatches. We have chosen to profile the window.onload event, the drawing of the thumbnail cursor in response to mouse movement, and the updating of the status bar with the mouse coordinates. count indicates the number of recordings made of each code block, and total the time spent in that block of code.