


CHAPTER THREE
The M-Mode and Doppler Examination
Introduction
M-mode echocardiography was first described as a clinically useful tool in veterinary medicine in 1977 when Pipers reported its use in the horse (1). M-mode echocardiograms in animals were difficult to obtain, and up to that time, its primary use was in medical research with the aid of invasive methods such as implanted catheters and catheter-tipped transducers, removal or displacement of lung lobes, and transducer placement directly on the cardiac surface (2–6). As noninvasive methods of imaging dogs improved (7–10), early descriptive articles appeared documenting the echocardiographic appearance of cardiac disorders in animals (11–19). The need for quantitative information became apparent as echocardiography’s practicality and applicability in veterinary medicine became evident. Normal M-mode reference values were rapidly determined for the dog (19– 24), cat (25–33), horse (1,34–38), cow (39), and pig (40). More reference values were published soon thereafter, with many articles directing specific attention to the effects of various physiologic and chemical influences on the echocardiogram.
Doppler, including color-flow, pulsed-wave, continuous-wave, and tissue Doppler imaging, has increased the diagnostic accuracy and predictive value of echocardiography. The normal appearance of cardiac flow profiles and the technique required for Doppler ultrasound has been described for many species and breeds (41–53).
M-Mode Echocardiography
Introduction
M-mode refers to motion mode. This type of image displays cardiac structures in a one-dimensional plane. M-mode images are obtained from the real-time long-axis left ventricular inflow outflow plane or from the left ventricular transverse plane by placing a cursor over the structures you want to see. The cursor represents one beam of sound, and this imaging method has been referred to as an “ice pick” view of the heart. Only the structures associated with the cursor are seen in the M-mode image (Figures 3.1, 3.2, 3.3). The features associated with that one line of sound through the heart scroll across the monitor and change in thickness or position as the heart fills and contracts. The resulting M-mode image has depth through the heart on the Y axis and time on the X axis.
M-Mode Images
One-dimensional image of structures
Only structures associated with the cursor are seen
Depth on the Y axis
Time on the X axis

Records subtle changes in wall and valve motion
Used for accurate measurements of size
Figure 3.1 The cursor is placed over the right and left ventricle. The right ventricle, ventricular septum, left ventricular chamber, and left ventricular wall are seen. (A) During diastole, the wall and septum become thinner and the chamber enlarges. (B) During systole, the wall and septum become thicker and the left ventricular chamber becomes smaller. The right ventricle and wall also exhibit theses changes, but they may not be seen as clearly. Only the structures under the cursor are displayed on the M-mode image as they change over time. Here three cardiac cycles are seen. Time is displayed on the X axis and the Y axis is depth. The oldest beat is displayed on the far left. RVW = right ventricular wall, RV = right ventricle, IVS = interventricular septum, LV = left ventricle, LVW = left ventricular wall, CT = chordae tendinae, d = diastole, s = systole, RA = right atrium, AO = aorta, LA = left atrium, PA = pulmonary artery.

Figure 3.2 The mitral valve has an M shape on the M-mode when the cursor is placed over the tips of the mitral valve. (A) Rapid ventricular filling during early diastole forces the septal leaflet open. The mural leaflet moves down toward the wall. As pressures equalize between the left atrium and left ventricle, flow decreases and the leaflets move toward an almost closed position. As the left atrium contracts and flow into the left ventricle increases, again the mitral valve moves up toward the septum again. (B) Closure of the mitral valve occurs after atrial systole, and the leaflets appear as several lines within the ventricular cavity. Four diastolic filling periods are seen on this diagram. Time is displayed on the X axis and the Y axis is depth. The oldest beat is displayed on the far left. RVW =

right ventricular wall, RV = right ventricle, IVS = interventricular septum, LV = left ventricle, LVW = left ventricular wall, MV = mitral valve, s = systole, d = diastole, RA = right atrium, AO = aorta, LA = left atrium, PA = pulmonary artery.
Figure 3.3 A cursor placed over the aorta displays the aorta as two parallel lines. (A) The aorta moves downward, and the left atrium becomes smaller as it empties during diastole. A line in the middle of the aorta represents the closed cusps during diastole. (B) The aorta moves upward during systole, and the left atrium enlarges as it fills during this time period. The aortic valve opens toward the walls of the aorta with the onset of systole, remains there for the duration of systole, and then moves rapidly to

a closed position at the end of systole. Time is displayed on the X axis and the Y axis is depth. The oldest beat is displayed on the far left. RA = right atrium, AO = aorta, LA = left atrium, AOV = aortic valve, s = systole, d = diastole.
M-mode echocardiography has a very high sampling rate when compared to two-dimensional imaging and is superior to real-time images for measuring size and recording subtle changes in wall and valve motion. M-mode images used for accurate assessment of size and function are obtained at the levels of the left ventricle, the mitral valve, and the aortic root.

Controls
Once a real-time image of good quality is obtained there are only two main controls needed to obtain an M-mode image. These are cursor positioning and sweep speed.
Cursor
The M-mode image depends on where the cursor is positioned on the real-time image. A track ball is used to move the cursor over the two-dimensional image. Whatever structures the cursor transects will be displayed on the M-mode image.
Sweep Speed
The M-mode image can be compressed or expanded along the X axis. The sweep speed controls how fast an image moves across the screen. Typical sweep speeds are 25, 50, and 100 mm per second. At 25 mm/sec many cardiac cycles are included on one frozen frame. At a sweep speed of 100 mm/sec, fewer cardiac cycles are seen per frame. A sweep speed of 50 or 100 mm/sec is usually necessary with the high heart rates of cats, in order to better separate the events of diastole and systole. The slow heart rates of horses require a slower sweep speed of 50 or 25 mm/sec in order to obtain a few cardiac cycles per frozen image (Figure 3.4).
Figure 3.4 Sweep speed controls how fast an image moves across the screen. On the left at 33.3 mm/sec five cardiac cycles are included on one frozen frame. On the right at a sweep speed of 100 mm/sec, one cardiac cycle is displayed. RV = right ventricle, LV = left ventricle.
M-Mode Images and Technique
Left Ventricle
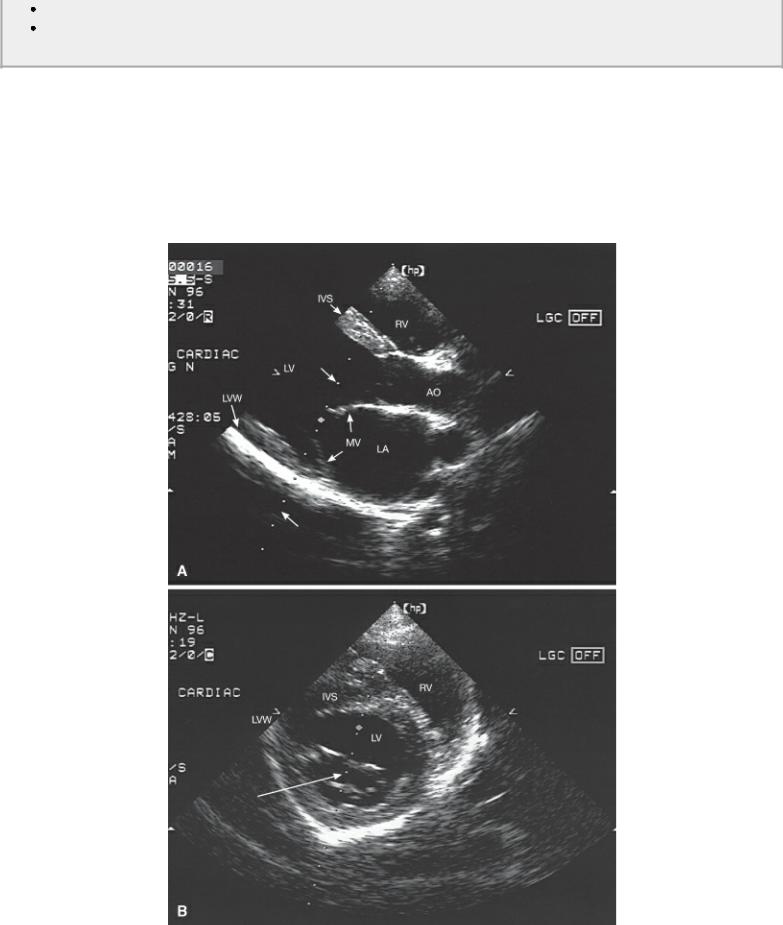
Left ventricular images are obtained by placing the cursor perpendicular to the interventricular septum and left ventricular free wall at the level of the chordae tendinae, between the tips of the mitral valve leaflets and the left ventricular papillary muscles (Figures 3.1, 3.5). Imaging planes include the right
parasternal long-axis left ventricular inflow outflow plane and transverse plane at the level of the chordae (54–57). In the horse the left parasternal transverse plane at the level of the chordae and right parasternal four-chamber planes are also used (41,58).
Figure 3.5 Left ventricular M-modes may be obtained from several two-dimensional views. (A) The right parasternal long-axis left ventricular outflow view in the (A) dog and in the (B) horse. The cursor is positioned perpendicular to the interventricular septum and left ventricular free wall at the level of the chordae tendinae, between the tips of the mitral valve leaflets and the left ventricular papillary muscles. (C) Right parasternal transverse images of the left ventricle at the level of the chordae tendinae in large and small animals may also be used. The cursor is placed over the septum and free wall, bisecting the image into perfect right and left halves. (D) Right parasternal four-chamber views are also used in the horse. The M-mode cursor (arrow) is placed perpendicular to the septum and left ventricular wall. It should be located between the tips of the mitral valve leaflets and the papillary muscles at the largest portion of the left ventricle over the chordae tendinae in both long axis and transverse planes. RV = right ventricle, LV = left ventricle, IVS = interventricular septum, AO = aorta, LA = left atrium, LVW = left ventricular wall, CT = chordae tendinae.


An M-mode cursor placed through a tipped (apex up) left ventricular outflow plane is often diagonal through the ventricle. Adjust the image so the interventricular septum and anterior aortic wall line up almost horizontally across the sector image. The M-mode cursor is placed perpendicular to the interventricular septum and left ventricular wall below the tips of the mitral valves at the largest ventricular chamber size. Take care to generate the M-mode from the best longitudinal image possible. Do not foreshorten the ventricle; the left ventricular wall and septum should be parallel to each other, the aortic valve should be seen, and mitral valve motion should show good excursion toward the septum. On transverse images the cursor should be placed over the septum and free wall dissecting the image into perfect right and left halves (Figure 3.5). Fan the transducer from mitral valve to papillary muscle and the plane intercepting the chordae tendinae between both of these standard planes is the desired one for M-mode image generation of the left ventricle. The right ventricle should be seen at the top of the sector image. If it is not seen or the M-mode does not have a clearly defined top to the septum, the transducer is probably located too close to the apex of the heart. Slide cranial an intercostal space, perhaps two in a large dog, and dorsal in the intercostal space
(toward that heart base) in order to correct this problem. The crystals will probably have to be pointed a little more caudally as well after this move.
M-Mode
Left Ventricle
Imaging Planes
Right parasternal transverse LV
Right parasternal long axis LV outflow view
The left parasternal transverse left ventricle and right parasternal four-chamber views may be used in the horse.
Imaging Technique
Place the cursor perpendicular to the septum and wall on all views.
The cursor should be between tips of the mitral valve and the papillary muscles at the level of the chordae and the largest LV dimension.
On transverse views the ventricle should be divided into equal and identical halves.
The longest, widest left ventricular chamber on long-axis imaging planes and the smallest circular left ventricle at the level of the chordae on transverse views should be used for M-mode images. This sounds contradictory, but if the imaging plane is slightly lateral to midline on a long axis, the chamber will be smaller, and if the imaging plane is oblique to the transverse plane and not perpendicular to it, the left ventricle will be larger.
The M-mode has a right ventricle at the top of the image, followed by the interventricular septum, the left ventricular chamber, and then the left ventricular free wall at the bottom of the image (Figures 3.6, 3.7). The pericardium on an M-mode image is always a very bright line just below the left ventricular free wall. The normal septum and left ventricular wall move away from each other as the ventricle fills during diastole and they move toward each other as the heart contracts during systole (Figure 3.1). The wall and septum thicken during ventricular contraction and become thinner as they relax during ventricular filling. The free wall of the left ventricle should continue its slight downward or filling motion until just before ventricular systole. In many cases there is a slight downward dip of the posterior wall and a small upward motion of the ventricular septum with atrial contraction. This will not be appreciated with fast heart rates.
Figure 3.6 This is an M-mode of the left ventricle in a horse. The right ventricular wall and right ventricle are at the top of the image; the interventricular septum, left ventricular chamber, and left ventricular wall are below them. RVW = right ventricular wall, RV = right ventricle, IVS = interventricular septum, LV = left ventricle, LVW = left ventricular wall, CT = chordae tendinae, P = pericardium, d = diastole, s = systole.
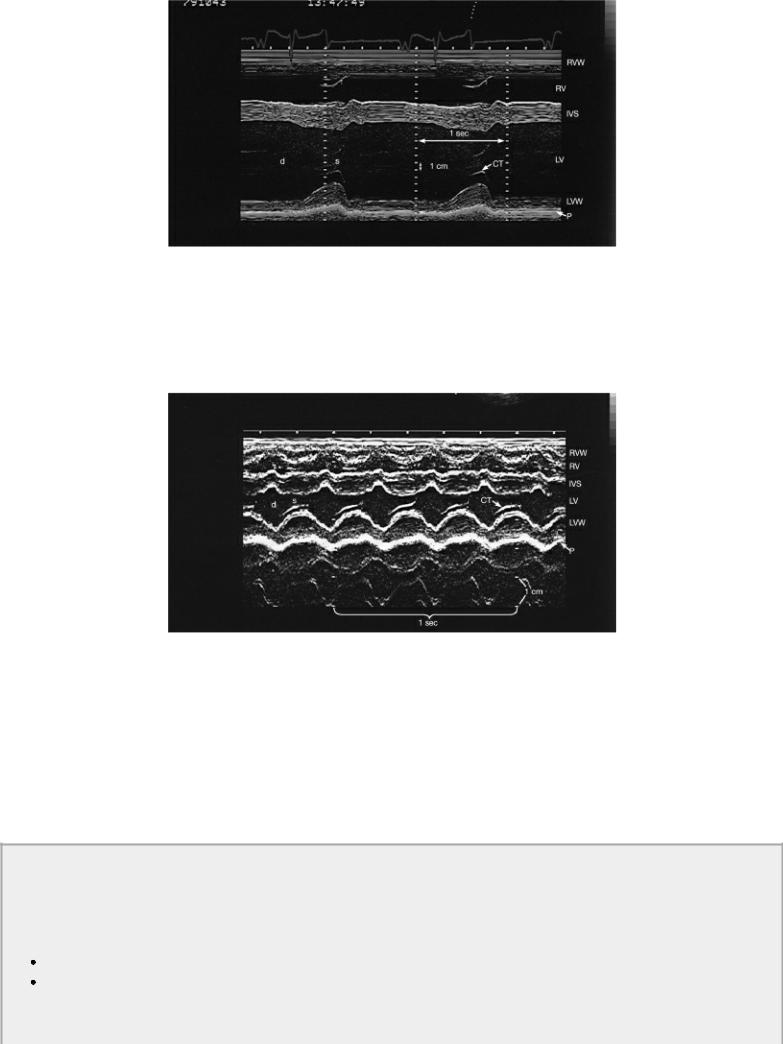
Figure 3.7 M-modes in cats require increased sweep speeds in order to spread out the events of diastole and systole. RVW = right ventricular wall, RV = right ventricle, IVS = interventricular septum, LV = left ventricle, LVW = left ventricular wall, CT = chordae tendinae, P = pericardium, d = diastole, s = systole.
Mitral Valve
Cursor position over the tips of the mitral valve leaflets produces an M-shaped structure on the M- mode image. The cursor should be positioned perpendicular to the septum and mitral valve leaflets. The right parasternal long-axis left ventricular inflow outflow view or transverse view at the level of the mitral valve may be used (Figure 3.8) (41,54–58). When using the long-axis image, make sure the septum and free wall are parallel to each other, that the aortic valve is seen, and that the mitral valve leaflets move well.
M-Mode
Mitral Valve
Imaging Planes
Right parasternal long-axis left ventricular outflow view
Right parasternal transverse mitral valve view
Imaging Technique
Place the cursor perpendicular to the septum over the tips of the mitral valve on the long axis view.
On transverse views place the cursor perpendicular to the valves as it divides the image into equal and similar halves.
Figure 3.8 Two views maybe used to obtain good M-modes of the mitral valves. (A) A cursor (arrow) may be placed over the tips of the mitral leaflets on the left ventricular inflow outflow view. (B) Alternately the cursor may be placed over the mitral valve on the transverse right parasternal image. The cursor should bisect the ventricle into perfect right and left halves. RV = right ventricle, IVS = interventricular septum, LV = left ventricle, MV = mitral valve, LVW = left ventricular wall, LA = left atrium, AO = aorta.
Initial motion of the valve reflects early diastole and rapid ventricular filling. The first peak of an M-shaped line, the “E” point (for early filling) should almost touch the septum as it does on real-time images (Figures 3.2, 3.9). This early filling phase of diastole is driven by a pressure gradient. The left ventricle has just finished emptying while the left atrium has just completed its filling phase. As the

left ventricle fills and the pressure differential decreases, flow through the valve decreases. This creates the downward motion seen after the E point as the valve leaflets do not remain fully open secondary to the decreased flow through the valve. The valve remains partially open during middiastole as blood flows slowly through it into the ventricle. Toward the end of diastole as the left atrium contracts, the valve leaflets are forced up toward the septum and down toward the wall again by the rush of blood into the left ventricle associated with atrial systole. Since flow volume associated with atrial contraction is less during this phase, the amplitude of the second peak of the M, referred to as the A point (for atrial contraction), and is lower than the E point in a normal heart. Following atrial contraction the leaflets move toward a closed position (the “C” point for closure) where they are displayed as multiple straight lines that move in a slightly upward direction on the M-mode throughout systole. Rapid heart rates will result in a mitral valve that does not have M-shaped motion since the rapid ventricular filling and atrial contraction phases of diastole coincide (Figure 3.10). Slow heart rates spread out the two phases of filling (Figure 3.11).
Figure 3.9 The mitral valve looks like an M on M-mode images. The E point represents maximum opening due to rapid ventricular filling. The A point represents maximum excursion following atrial contraction. The valve is represented by multiple lines during systole. RV = right ventricle, IVS = interventricular septum, LV = left ventricle, AMV, PMV = anterior and posterior mitral valve, LVW = left ventricular wall, d = diastole, s = systole, E = early diastolic motion—E peak, A = late diastolic motion—A peak.
Figure 3.10 When heart rates are high, the two phases of ventricular filling coincide, as in the first three beats on this M-mode, and the mitral valve no longer has an M shape. The latter two beats have a slightly slower heart rate and flow secondary to atrial contraction is just beginning to be visible on the back side of the E peak. RV = right ventricle, IVS = interventricular septum, LV = left ventricle, MV = mitral valve, LVW = left ventricular wall, d = diastole, s = systole.

Figure 3.11 Slow heart rates separate the two phases of ventricular filling. Mitral valve motion in this horse with a heart rate of 35 shows extra undulations during mid-diastole (arrow). RV = right ventricle, IVS = interventricular septum, LV = left ventricle, LVW = left ventricular wall, d = diastole, s = systole, E = early diastolic motion—E peak, A = late diastolic motion—A peak.
Aortic Root
Positioning the cursor through the aorta and left atrium produces an M-mode of the base of the heart. This is obtained from the right parasternal long-axis left ventricular inflow outflow or transverse view of the aorta and left atrium (Figure 3.12) (41,54–58). Using a long-axis inflow outflow view, place the cursor perpendicular to the aortic walls and through the aortic valve. The inflow outflow view should be as long as possible with the wall and septum perpendicular to each other, and there should be good aortic and mitral valve motion. If positioned correctly the cursor should then be located through the largest portion of the left atrium. On transverse images, all three aortic valve cusps should be clearly and symmetrically seen. The interatrial septum and left auricle should also be clearly seen. Place the cursor through the middle of the aorta and through the left atrium. The cursor can be located close to the junction of the left auricle and atrium but not in the auricle (Figure 3.12). On the M-mode, the right atrium is at the top of the image, followed by the anterior and posterior aortic walls (Figures 3.3, 3.13). These walls move parallel to each other. Below the aorta is the left atrium. The left atrium fills during ventricular systole, and this is one reason the aorta moves upward at that time. There should be very little posterior left atrial wall motion.

M-Mode
Aorta and Left Atrium
Imaging Planes
Right parasternal long-axis LV outflow view
Right parasternal transverse aorta
Imaging Technique
Place the cursor perpendicular to the aortic walls over the aortic valves.
Make sure the cursor is over the atrium and not the auricle on transverse planes.
Figure 3.12 The aortic root M-mode is obtained by placing the cursor perpendicular to the aortic walls and through the left atrium on either the (A) long-axis left ventricular outflow view or (B) the transverse view at the level of the aorta. RV = right ventricle, IVS = interventricular septum, LV = left ventricle, AO = aorta, AOV = aortic valve, MV = mitral valve, LVW = left ventricular wall, LA = left atrium, LAU = left auricle, PA = pulmonary artery.

Figure 3.13 The M-mode at the base of the heart shows the right ventricle at the top of the image, followed by the aorta and left atrium. The aortic valve has a box shape and is seen between the two parallel walls of the aorta (arrow). RV = right ventricle, AO = aorta, AOV = aortic valves, LA = left atrium, d = diastole, s = systole.

The aortic valves are a line in the center of the aorta during diastole. With systole, the valve cusps move rapidly toward each wall and remain there until the end of ventricular ejection when they move back to the center of the vessel and close. This creates a box-like image on the M-mode. Aortic valve motion is often easier to record from short-axis images.
Mitral Annular Motion
Mitral annular motion is recorded from the left parasternal apical four-chamber view of the heart. The M-mode cursor is placed along the interventricular septum and motion of the annulus is displayed (Figure 3.14). During systole annular motion is upward; during diastole annular motion is downward (Figure 3.15).
Figure 3.14 Mitral annular motion (MAM) is recorded from the left parasternal apical four-chamber view of the heart. The M-mode cursor is placed along the interventricular septum (arrow) and motion of the annulus is displayed to the left in this image. The MAM measurement is indicated by the double-headed arrow. LV = left ventricle, RV = right ventricle, LA = left atrium, RA = right atrium.
Figure 3.15 During systole mitral annular motion (MAM) is upward, during diastole annular motion is downward. The vertical line on this image coincides with the beginning of the QRS complex and systole.