

has a velocity of 5 m/sec, the proximal chamber must have a pressure of at least 100 mm Hg (4 × 52) more than the right atrium. If right atrial pressure is 0 then the proximal chamber has a pressure of at least 100 mm Hg. Assuming normal right ventricular pressure in the distal chamber of about 20 mm Hg (barring any other congenital defect), the pressure gradient across the stenotic area can be estimated at around 80 mm Hg.
Cats with infundibular hypertrophy and obstruction almost all have evidence of small left ventricular chambers and left ventricular outflow obstruction with left ventricular infundibular hypertrophy and evidence of systolic anterior mitral valve motion in some. The cause of the LVOT obstruction is not clear. It is hypothesized that it may be hypertrophic cardiomyopathy or volume contraction (84). Cats with severe infundibular obstruction to outflow had right ventricular outflow tract diameter to pulmonary valve diameter ratios of <.25.
This defect is easily missed or can be confused with a ventricular septal defect. The turbulent flow associated with a midventricular obstruction on transverse right parasternal imaging planes is close to the same location that shunted blood from a ventricular septal defect enters the right ventricular chamber. It can also be misdiagnosed as valvular pulmonic stenosis if a CW Doppler cursor is partially aligned with the midventricular turbulent jet. Use structural changes within the right side of the heart to help identify the presence of a possible midventricular or infundibular obstruction. An abrupt decrease in hypertrophy within the right ventricular chamber or outflow tract should be a clue that a midventricular or infundibular obstruction exists and use color-flow Doppler to help identify the origination of turbulence (91,93).
Inflow Obstructions
Mitral Stenosis
Mitral stenosis is a rare congenital abnormality in dogs and cats. It has a high incidence in the Bull terrier and Newfoundland (94–98). It may occur as a single entity or in combination with other defects. In man, it is often found in conjunction with subaortic stenosis, patent ductus arteriosus, ventricular septal defect, endocardial fibroelastosis, and coarctation of the aorta. Concomitant defects in dogs and cats include subaortic stenosis, patent ductus arteriosus, pulmonic stenosis, and mitral valve dysplasia (95,96,98,99). Mitral stenosis in man is usually acquired secondary to endocarditis, rheumatic fever, or a variety of other causes, but its development as an acquired lesion in animals cannot be confirmed (96).
Mitral stenosis has varying morphologies, which may include thickened leaflets with hypertrophied papillary muscles, a supravalvular ring, billowing leaflets with abnormal chordae all attached to one papillary muscle creating a tunnel, and hypoplastic valves (95,96,99). The diagnosis of mitral stenosis was the first clinical application of ultrasound in man, and the disease has some very characteristic echocardiographic findings.
M-mode echocardiography shows thick mitral leaflets, parallel motion of the anterior and posterior mitral valve leaflets (concordant motion), prolonged mitral valve EF slope, and a dilated left atrium (Figure 10.41). Two-dimensional findings include a dilated left atrium, doming of the mitral valve leaflets, reduced excursion of either or both mitral leaflets, thick mitral valve leaflets, and possibly a supravalvular ring (Figures 10.42, 10.43, 10.44). A pressure gradient, increased pressure half-time, and possibly mitral insufficiency are present on Doppler examination of mitral stenosis (94–97,99).

Features:
Mitral Stenosis
Concordant MV motion
Doming of MV leaflets
Reduced EF slope
Prolonged PHT
High PG
Dilated LA
Figure 10.41 M-mode echocardiography shows thick mitral leaflets, concordant motion of the anterior and posterior mitral valve leaflets (arrow), and prolonged mitral valve EF slope in hearts with valvular mitral stenosis. RV = right ventricle, LV = left ventricle, MV = mitral valve.
Figure 10.42 When the tips of the mitral valves point toward each other (arrows) as opposed to pointing toward the left ventricular chamber during maximal mitral valve excursion the leaflets are said to dome, a sign of mitral stenosis. Plane = left parasternal apical five-chamber view, LV = left ventricle, LA = left atrium, AO = aorta, MV = mitral valve.

Figure 10.43 Doming of the mitral valves may be seen on parasternal long-axis views as well. The leaflet tips point toward each other at maximal excursion implying fusion of the valve leaflets. Both leaflets dome (arrows). The left atrium is dilated secondary to back pressure and possibly insufficiency. Plane = right parasternal long-axis four-chamber view, LV = left ventricle, LA = left atrium.
Figure 10.44 Mitral stenosis may manifest as a supravalvular ring (large arrow). The mitral valves are normal (small arrow). Plane = right parasternal long-axis four-chamber view, LV = left ventricle, LA = left atrium.

M-Mode Evaluation
Concordant mitral valve motion means the leaflets move in parallel; the posterior and anterior leaflets do not move away from each other as they normally do. The posterior leaflet will move upward toward the septum at the same time the anterior leaflets does. This is seen when there is commissural fusion of the leaflets and is easy to document on M-mode images (Figure 10.41).
Two-Dimensional Evaluation
Two-dimensional images show doming of the mitral valve leaflets when there is fusion of the cusps (Figures 10.42, 10.43). The tips of the leaflets will point toward each other at maximal opening. The body of the anterior leaflet will bow or dome up toward the outflow tact, and sometimes the posterior leaflet domes toward the free wall of the left ventricle.
Fusion of the mitral leaflets also reduces the anterior and posterior excursion of leaflets during diastole. In order to document the reduced excursion during diastole, look at the tips of the leaflets and not along the body of the leaflets where the septal leaflet will billow up toward the outflow tract and the parietal leaflet billows down to the free wall. To document this on M-mode images, the M- mode cursor must be positioned at the tips of the leaflets. The mitral valve EF slope will be reduced.
Although the finding of concordant motion is diagnostic of mitral stenosis, the latter two findings— reduced EF slope and reduced excursion—are not specific for the disease. Reduced excursion may be seen in the presence of aortic insufficiency, a common finding in dogs with subaortic stenosis. Almost one-half of dogs with mitral stenosis in one report also had subaortic stenosis (96). Poor flow into the left ventricle for any reason will also reduce mitral valve motion and excursion. Doming of the body of the leaflets will differentiate reduced motion secondary to aortic insufficiency or reduced flow from poor excursion secondary to mitral stenosis. Reduced ventricular compliance may be a cause of delayed early diastolic mitral valve closure. This is often seen with heart disease resulting in left ventricular hypertrophy. There are also reports of mitral stenosis in man in which concordant mitral valve motion is not present or may not be evident (95,99,100).
A thick mitral valve is usually present with mitral stenosis but may also be seen with dysplastic valves, subaortic stenosis, and acquired degenerative or infective lesions. The diagnosis of mitral stenosis as opposed to these other differentials can be made when the other features of stenosis are present including doming, reduced EF slope, concordant diastolic motion, and increased pressure half-

time (95).
Restriction to left ventricular filling causes left atrial pressure to increase and the left atrium to dilate (Figure 10.43). Elevation in pressure secondary to increased output due to excitement or exercise may exacerbate the clinical signs associated with mitral stenosis. The development of atrial arrhythmias especially atrial fibrillation will decrease flow into the ventricle and elevate atrial pressure. The degree of left atrial dilation is affected not only by the obstruction to left ventricular inflow but also by the degree of mitral insufficiency if present (94,96).
Chronic elevation in left atrial and pulmonary venous pressure will lead to chronic interstitial changes within the pulmonary arterioles and secondary pulmonary hypertension. Pulmonary hypertension affects the right side of the heart, and echocardiographic evidence of pulmonary hypertension includes right ventricular and pulmonary artery dilation, right ventricular hypertrophy, tricuspid insufficiency, and changes in the pulmonary flow profile. The echocardiographic findings in pulmonary hypertension are discussed in Chapter 6. When hypertension becomes significant, decreases in left ventricular preload may alleviate some of the symptoms of mitral stenosis (101).
Mitral valve area in man is measured directly from transverse images of the mitral valve. Normal mitral valve area in the dog is 3.69 ± 1.42 cm2 (Figure 10.45) (102). An area greater than 2.5 cm2 (normal 4–6) in man typically creates only mild symptoms. A valve area of less than 1 cm2/m2 of body surface area represents severe mitral stenosis in man. This has not been validated in animals. Problems with direct measurement include poor resolution, improper selection of the frame for measurement, and gain settings. When the transverse image is not perpendicular to the mitral valve and an oblique view is used, the size of the mitral orifice may be incorrectly assessed. The tips of the mitral valve leaflets must be seen in cross section otherwise the orifice size will be overestimated secondary to billowing of the body of the leaflets.
Mitral Valve Area
Canine—normal
3.69 ± 1.42 cm2
Figure 10.45 Mitral valve area is measured directly from transverse images of the mitral valve. Normal mitral valve area in the dog is 3.69 ± 1.42 cm2. Plane = right parasternal transverse mitral valve, RV = right ventricle, LV = left ventricle, VS = ventricular septum, MVA = mitral valve area.


leaflets, reduced excursion of the valve tips, concordant motion of the anterior and septal leaflets, a dilated right atrium, and often, tricuspid insufficiency. The free edges of the valve are apically displaced, but the annulus is not displaced (Figure 10.49) (108,109). The right ventricle will be dilated if there is tricuspid insufficiency but will be normal or small if there is no valvular regurgitation. The tricuspid valve may be nodular, thick, and can be dysplastic with short chordae tendinae and abnormal papillary muscles (Figure 10.50). Right to left shunting through a patent foramen ovale may exist when right atrial pressure is high enough.
Features:
Tricuspid Stenosis
Concordant TV motion
Doming of TV leaflets
Reduced EF slope
Prolonged PHT
High PG
Dilated RA
Possible patent foramen
Figure 10.50 A stenotic tricuspid valve may be nodular, thick, and can be dysplastic with short chordae tendinae and abnormal papillary muscles (arrows). Plane = foreshortened left apical fourchamber view, RV = right ventricle, LV = left ventricle, TV = tricuspid valve, RA = right atrium.
M-mode images show paradoxical septal motion where the septum move down toward the left ventricular chamber during diastole secondary to elevated diastolic pressure in the right side of the heart relative to the left. The parietal leaflet of the tricuspid valve will show slow deceleration time because of delayed equilibration of pressure between the right atrium and ventricle. Normally right ventricular pressure increases rapidly and right atrial pressure decreases rapidly during early diastole giving the E peak of tricuspid valve motion a rapid deceleration time (110). The left ventricular chamber may be smaller than normal because of poor right ventricular forward stroke volume if the animal is in right-sided congestive heart failure and because of the paradoxical septal motion (110).


pressure half-time (238 msec) in this heart with tricuspid stenosis. TV = tricuspid valve, Vmax = maximum velocity, Vmean = mean velocity, max PG = maximum pressure gradient, mean PG = mean pressure gradient, VTI = velocity time integral, HR = heart rat.
Peak flow velocity is increased in order to maintain normal flow volume through the valve (based upon the continuity equation) and is proportionate to the degree of stenosis. Deceleration of flow during early diastole will be slow because of the increased time for right ventricular and right atrial pressure to equalize (108–110,112–114). If right atrial pressure is not very elevated for instance then it would not take long for the pressure gradient between the atrium and ventricle to diminish as in normal transvalvular flow where we see a rapid deceleration rate of flow during early (E wave) diastole. The more stenotic and restricted flow is through the valve, the higher the right atrial pressure and the longer it will take a pressure gradient to diminish.
Peak trans tricuspid flow velocity increases in response to the high right atrial pressure and the effort to maintain normal forward flow. The increased flow velocity is proportionate to the severity o f the stenosis. Pressure in the right side of the heart is low, and even a mean pressure gradient of 5 mm Hg in humans suggests the presence of hemodynamically significant tricuspid stenosis (108). Mean pressure gradient is calculated by tracing the flow velocity integral (Figure 10.52).

Tricuspid Stenosis
Mean PG in man >5 mm Hg = significant TS
Cor Triatriatum
Cor triatriatum refers to the division of the right or left atrium into cranial and caudal cambers. The membrane on the right side is a remnant of the embryonic right sinus venosus valve. When the membrane is present within the right atrium, it is referred to as cor triatriatum dexter (115–117). Its presence within the left atrium is referred to as cor triatriatum sinister, and it is the result of improper resorption of the common pulmonary veins during embryonic development (118). Cor triatriatum dexter is typically found in the dog, while cor triatriatum sinister is primarily found in cats (115–117). Although cor triatriatum may be the only defect present, associated problems include tricuspid valve anomalies, pulmonic stenosis, patent ductus arteriosus, patent foramen ovale, mitral regurgitation, and persistent left cranial vena cava in man and in dogs (117–123). The patent foramen may shunt right to left if it is located within the high pressure chamber of cor triatriatum dexter.
Cor Triatriatum Dexter
Canine
Cor Triatriatum Sinister
Feline
Cor Triatriatum Dexter
Echocardiographic images of the right atrium show a membrane dividing the chamber into two (Figure 10.53). This membrane restricts venous return into the right side of the heart by obstructing caudal vena cava flow and possibly coronary sinus flow. The membrane varies in its location within the right atrium in man. The cranial chamber may receive either the caudal and cranial vena cava or only one of the vena cava. The tricuspid valve may be within either chamber depending upon the site of the membrane and its angle through the atrium. The majority of dogs have a low pressure distal chamber that receives the cranial vena cava and contains the tricuspid valve, and a proximal high pressure chamber that receives the caudal vena cava and the coronary sinus (123). The tricuspid valve is located within the distal chamber and may or may not be normal (116, 117,124–126). Atypical angles and planes through the right atrium are sometimes necessary in order to visualize the membrane. The membrane may also form a tunnel type of connection between the cranial and caudal chambers as opposed to forming a distinct division into two chambers.
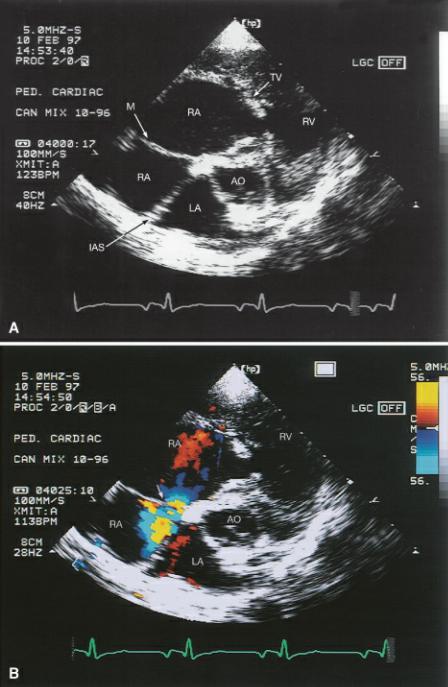
Figure 10.53 (A) A membrane divides the right atrium into a cranial (proximal) high pressure chamber and caudal (distal) low pressure chambers when cor triatriatum dexter exists. (B) The connection (arrow) between the two parts of the right atrium may not be obvious without color-flow Doppler. Plane = right parasternal transverse heart base, RA = right atrium, TV = tricuspid valve, RV = right ventricle, LA = left atrium, IAS = interatrial septum, AO = aorta, M = membrane.

In cor triatriatum sinister, the membrane divides the left atrium into cranial and caudal chambers (Figure 10.54). This membrane should be differentiated from supravalvular mitral stenosis. The fibrous ring associated with mitral stenosis is always distal to the fossa ovalis, closer to the mitral valve and inferior to the left auricular appendage. The membrane of cor triatriatum sinister is located proximal to the fossa ovalis near the base of the atrium. The left auricular appendage is in the low pressure compartment of cor triatriatum sinister (127). The pulmonary veins typically empty into the proximal chamber (high pressure chamber), and the distal chamber (low pressure chamber) contains the mitral valve and left auricular appendage (128).
Cor Triatriatum Sinister
Membrane
Proximal to fossa ovalis
Left auricular appendage
In low pressure chamber
Distal to membrane
Supravalvular Mitral Stenosis
Membrane
Distal to fossa ovalis
Left auricular appendage
In high pressure chamber
Proximal to membrane
Figure 10.54 (A) A membrane separates the left atrial chamber in cranial and caudal sections with cor triatriatum sinister. (B) Spectral Doppler reveals a pressure gradient of 35 mm Hg between the cranial and caudal chambers of the left atrium. Plane = right parasternal four-chamber view, LV = left ventricle, LA = left atrium, IAS = interatrial septum, M = membrane, MV = mitral valve.
Cor triatriatum sinister can be subcategorized into three types depending upon the shape and location of the membrane and its relationship with the pulmonary veins and interatrial septum. Type A cor triatriatum has a funnel-like membrane that connects the proximal and distal chambers. The pulmonary veins in this type of membrane may all enter the proximal chamber (high pressure), be divided between the two chambers, or there may be anomalous drainage into the right atrium. Type B cor triatriatum has a wedge-shaped membrane with the fossa ovalis located within the proximal chamber. Pulmonary veins may all enter the proximal chamber and blood shunts to the right atrium, or they may be divided between both portions of the atrium. Type C cor triatriatum sinister involves a midline membrane where the foramen ovale is located in the proximal chamber with all pulmonary veins entering the distal low pressure chamber. The type and location of the membrane plays a large role in resulting clinical signs and development of congestive heart failure (129). Doppler can confirm the presence of a pressure gradient. Significant gradients may lead to left heart failure and pulmonary hypertension.